Table of Contents
Canadian agriculture and agri-food system
Current state and future potential
The agriculture and agri-food system touches all Canadians and communities in Canada.
Key players in this system
- producers (primary agriculture)
- processing
- food retailers and wholesalers
- foodservice providers
It is part of a broader supply chain, which includes
- input and service suppliers
- transportation
- consumers, at home and abroad
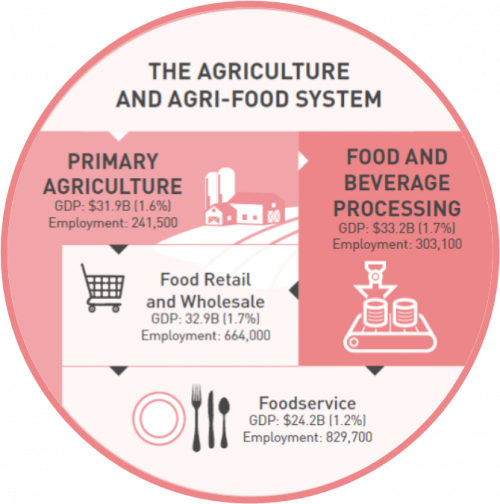
Description of the above image
| GDP ($ billion) | Percentage of total GDP | Employment | |
|---|---|---|---|
| Primary agriculture | 31.9 | 1.6 | 241,500 |
| Food and beverage processing | 33.2 | 1.7 | 303,100 |
| Food retail and wholesale | 32.9 | 1.7 | 664,000 |
| Foodservice | 24.2 | 1.2 | 829,700 |
Primary agriculture
Canada has over 62 million hectares of agricultural land (154 million acres) concentrated primarily across the Prairies and Southern Ontario.
Between 2017 and 2021, the three prairie provinces accounted for an average of 55% of total cash receipts, including 61% of crop receipts and 44% livestock receipts.
Some provinces are more diversified than others. Primary agriculture’s contribution to provincial Gross Domestic Product (GDP) varies across Canada.
Top 10 commodities by average farm cash receipts, 2017 to 2021

Source: Statistics Canada
Description of the above image
Top 10 Canadian commodities by average farm cash receipts, 2017 to 2021
Canola: $10 billion
Cattle and calves: $9 billion
Milk: $7 billion
Wheat (except durum wheat): $6 billion
Hogs: $5 billion
Vegetables (greenhouse and field): $4 billion
Poultry (chickens and turkeys): $3 billion
Soybeans: $3 billion
Corn: $2 billion
Floriculture and nursery products and sod: $2 billion
Contribution of primary agriculture to provincial gross domestic product, 2021

Source: Statistics Canada
Description of the above image
Contribution of primary agriculture to provincial gross domestic product, 2021
British Columbia: 1.2%
Alberta: 1.4%
Saskatchewan: 5.6%
Manitoba: 4.6%
Ontario: 1.2%
Quebec: 1.5%
New Brunswick: 2.1%
Nova Scotia: 1.1%
Prince Edward Island: 4.4%
Newfoundland and Labrador: 0.2%
Most Canadian producers have seen solid growth over the past decade
- Farm market receipts have grown 5% on average annually and reached a record high of $77 billion in 2021.
- The largest value growth came from grains and oilseeds, which at $30 billion in farm market receipts, accounted for 39% of total farm market receipts in 2021.
Farm market receipts, $ billions, 2021

Notes
- “Special crops” denotes dry peas, dry beans, lentils, chickpeas, mustard seed, canary seed and sunflower seeds.
- Numbers may not add to totals due to rounding.
Source: Statistics Canada
Description of the above image
Farm market receipts, $ billions, 2021
Grains and oilseeds, $29.8 billion
Pulses and special crops, $3.2 billion
Cattle and calves, $10.2 billion
Hogs, $6.3 billion
Dairy, $7.4 billion
Poultry and eggs, $5.2 billion
Horticulture, $7.5 billion
Cannabis, $3.3 billion
Other, $4.5 billion
Notes
- “Special crops” denotes dry peas, dry beans, lentils, chickpeas, mustard seed, canary seed and sunflower seeds.
- Numbers may not add to totals due to rounding.
For primary agriculture, net cash income reached a new record of $23 billion in 2021, despite the challenges of COVID-19, rising input prices and the western drought.
External factors like commodity and input prices, disease and weather, such as the 2021 drought in the prairies, can impact net cash income or result in variability between commodities and sectors.
Net cash income, Canada, 2002 to 2021

Source: Statistics Canada
Description of the above image
Net cash income, Canada, 2002 to 2021
The data indicate a general upward trend from $8 billion in 2002 to $23 billion in 2021.
Food and beverage processing
The food and beverage processing sector is the largest manufacturing sector in Canada in terms of both GDP and employment. Nearly 8,000 food processing and beverage businesses provide direct jobs for over 303,000 Canadians, employing more Canadians than the entire transportation equipment manufacturing sector.
The processing sector uses 42% of Canada’s primary production and supplies 75% of all processed food and beverage products in Canada.
In 2021, 95% of food and beverage processing establishments were small operations (0 to 99 employees) with little variation across sub-industries. Processing plants are located across the country but primarily located in Ontario, Quebec and British Columbia, which account for 77% of total food and beverage processing establishments.
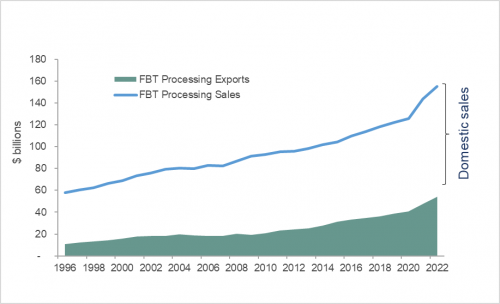
Canadian food, beverage and tobacco (FBT) processing sales and processing exports, 1996 to 2022
Source: Statistics Canada and AAFC calculations
Description of the above image
Canadian food, beverage and tobacco (FBT) processing sales and processing exports, 1996 to 2022
One line shows food, beverage and tobacco processing sales starting at $58 billion in 1996 and ending at $159 billion in 2022. A second section shows food, beverage and tobacco processing exports starting at $11 billion in 1996 and ending at $54 billion in 2022.
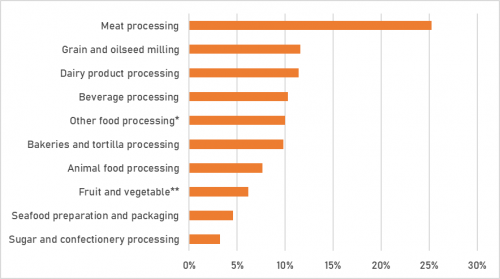
Distribution of food and beverage processing shipments by sub-industry, 2021
Notes
Other food processing includes snack food, coffee and tea, flavored syrup and concentrates, seasoning and dressings as well as all other food manufacturing.
Fruit and vegetable includes specialty food manufacturing.
Source: Statistics Canada and AAFC calculations
Description of the above image
| Distribution (%) | |
|---|---|
| Meat processing | 25 |
| Grain and oilseed milling | 12 |
| Dairy product processing | 11 |
| Beverage processing | 10 |
| Other food processing1 | 10 |
| Bakeries and tortilla processing | 10 |
| Animal food processing | 8 |
| Fruit and vegetable2 | 6 |
| Seafood preparation and packaging | 5 |
| Sugar and confectionery processing | 3 |
Notes
- Includes snack food, coffee and tea, flavored syrup and concentrates, seasoning and dressings and all other food manufacturing.
- And specialty food manufacturing.
Wholesalers, food retail and foodservice
Wholesale is divided into farm products and food, beverage and tobacco products
In 2021, sales of farm products at wholesale reached over $15 billion while food, beverage and tobacco products at wholesale reached $125 billion in sales, both up on a year-over-year basis.
The Canadian food retail sector is highly concentrated
The top three traditional food retailers (Loblaw, Sobeys and Metro) and the top two general merchandise retailers (Walmart and Costco) accounted for about 76% of total grocery sales in 2021.
Large chains dominate in each region of Canada
Independents (for example, co operatives and single stores) are most common in Western Canada and Ontario but are still outnumbered by the large chains.
Smaller retailers tend to serve remote and northern communities (for example, co-ops).
Foodservice sales have been impacted by COVID-19 in recent years
In 2021, total foodservice sales reached $65 billion, up $10 billion from 2020, but still below 2019 sales of $77 billion. The easing of public health restrictions due to COVID-19 in 2021 compared to 2020 as well as increased delivery and take-out options have supported the year-over-year improvement.
Limited-service or quick-serve (for example, take-out) eating places, represented $33 billion in sales, up 22% from 2020 and were close to 2019 levels. Quick-serve sales were least affected by the pandemic and recovered fastest.
Sales at full-service restaurants ($26 billion) and special food services ($4 billion) which includes caterers and mobile food services were up 22% and 19% from 2020, respectively, but remained 23% and 37% below 2019 levels due to continued public health restrictions.
Distribution of foodservice sales by industry, 2021
| Distribution (%) | |
|---|---|
| Special food services | 6 |
| Drinking places | 2 |
| Full-service | 40 |
| Limited service | 51 |
Source: Statistics Canada, Table 21-10-0019-01
Overall, the system felt the impacts of the COVID-19 pandemic…
…but still ensured Canadians had reliable access to food
COVID-19 had a significant impact on the food system. These challenges highlighted a number of structural and systemic issues within Canada’s agri-food system, including:
- The strong interdependencies between all players of the agriculture and agri-food system;
- Concerns for the self-sufficiency of Canada’s domestic agriculture and agri-food system; and
- The need for better data and analytics and importance of intergovernmental collaboration.
Despite these challenges, Canada’s agriculture and agri-food system grew in 2021 compared to 2020 and some sectors have surpassed pre-pandemic GDP.
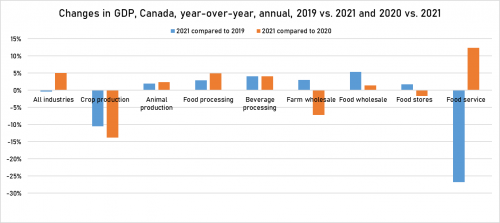
Changes in GDP, Canada, year-over-year, annual, 2019 compared to 2021 and 2020 compared to 2021
Source: Statistics Canada, Table 36-10-0434-01
Description of the above image
Changes in GDP, Canada, year-over-year, annual, 2019 compared to 2021 and 2020 compared to 2021
| Percentage change 2019 to 2021 | Percentage change 2020 to 2021 | |
|---|---|---|
| All industries | 0 | 5 |
| Crop production | -11 | -14 |
| Animal production | 2 | 2 |
| Food processing | 3 | 5 |
| Beverage processing | 4 | 4 |
| Farm wholesale | 3 | -7 |
| Food wholesale | 5 | 1 |
| Food stores | 2 | -2 |
| Food service | -27 | 12 |
The sector has remained resilient in the face of severe drought, rapid inflation and the invasion of Ukraine
Dry conditions began in 2020 and persisted through the winter. The hottest and driest part of the season occurred during critical crop development stages, which amplified the impact. The situation in July/August 2021 represented the largest and most severe drought conditions in the last 70 years.
Despite the western drought, continued COVID-19-related supply chain disruptions, and rising input costs, Net Cash Income rose significantly in 2021 by over 30%, thanks to robust crop and livestock commodity prices which lifted receipts higher, well beyond farm expenses.
The sector entered 2022 facing higher inflation as a result of robust global demand recovery amidst persistent supply-chain issues from the pandemic.
The Russian invasion of Ukraine also exacerbated the global situation by spreading shocks across the world and Canadian agricultural markets, leading to increased uncertainty and volatility, pushing both crop and input prices higher.
Despite the negative impact of rising expenses on farm income, the sector is forecast to still have seen a small growth in 2022 thanks to excellent commodity prices, with further growth expected in 2023.
Food price inflation outpaced overall inflation in 2022
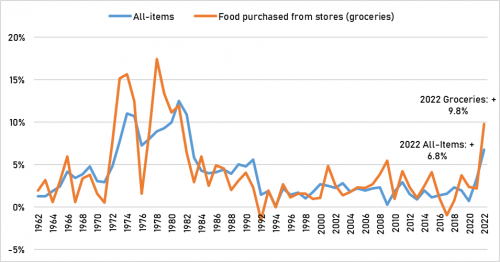
The Consumer Price Index (CPI) rose 6.8% on an annual average basis in 2022, following gains of 3.4% in 2021 and of 0.7% in 2020. The increase in 2022 was a 40-year high, the largest increase since 1982 (+10.9%).
Grocery price increases (+9.8%) outstripped the overall Consumer Price Index (CPI) in 2022.
- Grocery prices rose at the fastest pace since 1981 (+12.0%), after increasing 2.2% in 2021.
Consumer price inflation, year-over-year percentage change, 1962 to 2022
Source: Statistics Canada, Table 18-10-0005-01
Description of the above image
Consumer price inflation, year-over-year percentage change, 1962 to 2022
Year-over-year prices for food from stores increased 9.8% from 2021 to 2022. The graph above shows year-over-year food price inflation peaks in 1973 (+15.2%), 1974 (+15.6%), 1981 (+12%), and 2022 (+9.8%). Food price inflation outpaced overall inflation in 2022.
| All-items (% change) | Food purchased from stores (groceries) (% change) | |
|---|---|---|
| 1962 | 1.3 | 1.9 |
| 1963 | 1.3 | 3.2 |
| 1964 | 1.9 | 0.6 |
| 1965 | 2.4 | 3.1 |
| 1966 | 4.2 | 6.0 |
| 1967 | 3.4 | 0.6 |
| 1968 | 3.9 | 3.4 |
| 1969 | 4.8 | 3.8 |
| 1970 | 3.0 | 1.6 |
| 1971 | 3.0 | 0.5 |
| 1972 | 4.8 | 7.7 |
| 1973 | 7.8 | 15.2 |
| 1974 | 11.0 | 15.6 |
| 1975 | 10.7 | 12.5 |
| 1976 | 7.2 | 1.6 |
| 1977 | 8.0 | 9.0 |
| 1978 | 8.9 | 17.4 |
| 1979 | 9.3 | 13.4 |
| 1980 | 10.0 | 11.2 |
| 1981 | 12.5 | 12.0 |
| 1982 | 10.9 | 6.4 |
| 1983 | 5.8 | 2.9 |
| 1984 | 4.3 | 6.0 |
| 1985 | 4.0 | 2.5 |
| 1986 | 4.1 | 4.9 |
| 1987 | 4.4 | 4.6 |
| 1988 | 3.9 | 2.0 |
| 1989 | 5.1 | 3.1 |
| 1990 | 4.8 | 4.0 |
| 1991 | 5.6 | 2.3 |
| 1992 | 1.4 | -1.5 |
| 1993 | 1.9 | 1.9 |
| 1994 | 0.1 | 0.0 |
| 1995 | 2.2 | 2.7 |
| 1996 | 1.5 | 1.1 |
| 1997 | 1.7 | 1.6 |
| 1998 | 1.0 | 1.6 |
| 1999 | 1.8 | 1.0 |
| 2000 | 2.7 | 1.1 |
| 2001 | 2.5 | 4.8 |
| 2002 | 2.2 | 2.6 |
| 2003 | 2.8 | 1.4 |
| 2004 | 1.8 | 1.8 |
| 2005 | 2.2 | 2.3 |
| 2006 | 2.0 | 2.3 |
| 2007 | 2.2 | 2.7 |
| 2008 | 2.3 | 3.9 |
| 2009 | 0.3 | 5.5 |
| 2010 | 1.8 | 1.0 |
| 2011 | 2.9 | 4.2 |
| 2012 | 1.5 | 2.3 |
| 2013 | 0.9 | 1.1 |
| 2014 | 2.0 | 2.5 |
| 2015 | 1.1 | 4.1 |
| 2016 | 1.4 | 1.0 |
| 2017 | 1.6 | -1.0 |
| 2018 | 2.3 | 0.8 |
| 2019 | 1.9 | 3.7 |
| 2020 | 0.7 | 2.4 |
| 2021 | 3.4 | 2.2 |
| 2022 | 6.8 | 9.8 |
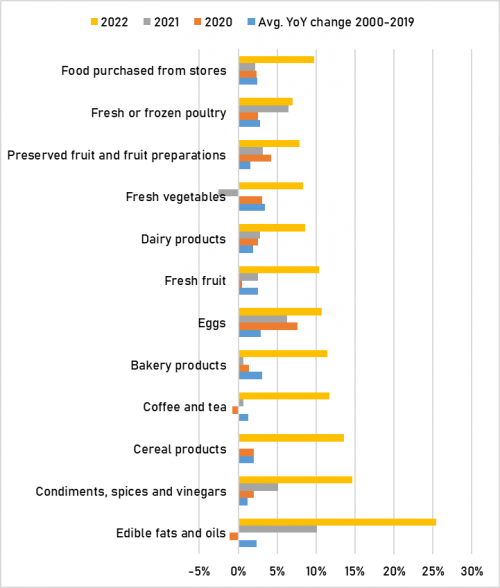
Year-over-year food price inflation, select categories
Source: Statistics Canada, Table 18-10-0005-01
Description of the above image
Year-over-year food price inflation, select categories
| Average year-over-year percentage change 2000 to 2019 | 2020 % | 2021 % | 2022 % | |
|---|---|---|---|---|
| Edible fats and oils | 2 | -1 | 10 | 25 |
| Condiments, spices and vinegars | 1 | 2 | 5 | 15 |
| Cereal products | 2 | 2 | 0 | 14 |
| Coffee and tea | 1 | -1 | 1 | 12 |
| Bakery products | 3 | 1 | 1 | 11 |
| Eggs | 3 | 8 | 6 | 11 |
| Fresh fruit | 2 | 1 | 3 | 10 |
| Dairy products | 2 | 3 | 3 | 9 |
| Fresh vegetables | 3 | 3 | -3 | 8 |
| Preserved vegetables and vegetable preparations | 2 | 3 | 1 | 12 |
| Fresh or frozen poultry | 3 | 2 | 6 | 7 |
| Food purchased from stores | 2 | 2 | 2 | 10 |
Positioning the system for sustainable economic growth
Canada has some key advantages that can help make it a leader in food production and processing:
- abundant land and water resources
- access to international markets
- strong research and development capacity
- strong global reputation as a trusted supplier of safe, top-quality food
- strong stewards of the land
Targeted action moving forward can help the system continue to capitalize on opportunities well into the next decade and beyond.
- There is an opportunity to draw on lessons learned from the pandemic and capitalize on the strengths of the Canadian agriculture and agri-food system that were recognized before and still remain:
- Canada’s Economic Strategy Tables and the Royal Bank of Canada’s Farmer 4.0: agriculture could add as much as $11 billion to Canada’s GDP by 2030.
- Over $1.5 billion in recent funding to environmental and climate change programming will boost Canada’s capacity for sustainable production.
- Agricultural Climate Solutions, Agricultural Clean Technology, the Resilient Agricultural Landscapes Program and cost-shared agri-environmental programming.
Continued growth will require overcoming challenges and seizing opportunities
Challenges include
- effects of climate change with severe weather events (for example, drought, floods, fires) impacting production.
- volatility in global trade
- challenges securing labour
- taking greater efforts towards sustainability, including climate change mitigation and adaptation
- need for sustained investment in agricultural research, combined with adoption of emerging technology
- strained retailer-supplier relationship
- potential negative impact of animal disease outbreaks (such as African Swine Fever and Avian Influenza) on domestic production and trade
- Impact of rapid food price inflation on food affordability for Canadians
Opportunities include
- taking advantage of free trade agreements and expanding into new markets
- regulatory agility to help the sector realize its growth potential
- development of safe new products and sustainable production systems can lead to competitive advantages (for example, seed varieties, plant-based proteins, vertical farming systems, biomaterials)
- increased demand for Canadian products by meeting consumer expectations for sustainability
- extracting more value from our primary agriculture production and support food processing in pursuing new or emerging opportunities to diversify their operations
- a Grocery Code of Conduct is expected to improve transparency, predictability and fair dealing in supplier-retailer relationships, which will have positive effects across the supply chain and ultimately benefit consumers as well
Canada remains a competitive global force – strong and growing
From 2011 to 2021, exports of Canadian agriculture, agri-food and seafood products increased by 86%, reaching a record high of $82.4 billion in 2021.
Canada remained a top exporter of agriculture, agri-food and seafood products in 2021 despite a severe drought in western Canada.
Exports of agricultural and agri-food commodities are projected to drop slightly over the short term as commodity prices are expected to decline from their current historical peaks. But steady growth is expected to resume over the medium term.
The total value of agriculture and agri-food exports, including fish and seafood, is projected to reach $105 billion by 2032.
Canadian exports of agricultural and agri-food commodities

Source: AAFC Medium Term Outlook, Department of Fisheries and Oceans Canada and Statistics Canada
Description of the above image
Canadian exports of agricultural and agri-food commodities
- Fish and Seafood historical was 10.6% in 2021 and is projected to be 10.4% by 2032.
- Dried pulses and animal feed historical was 6.5% in 2021 and is projected to be 6.2% by 2032.
- Grains and grain products historical was 21.3% in 2021 and is projected to be 21.1% by 2032.
- Oilseeds and oilseed products historical was 22.1% in 2021 and is projected to be 21.7% by 2032.
- Livestock and red meat historical was 15.3% in 2021 and is projected to be 11.2% by 2032.
- Other historical was 24.2% in 2021 and is projected to be 29.4% by 2032.
The agriculture and agri-food system holds great promise and potential
According to some analysts, agriculture and agri-food is one of the sectors with the highest economic growth potential in Canada.
Canada’s key advantages can make us a leader in sustainable food production and processing.
Demand is growing for the kinds of food that Canadian producers and processors can deliver.
Canada’s reputation for environmental stewardship can lead to increased demand/price for its products.
Opportunity for Canadian agriculture to make a significant contribution to meeting Canada’s climate goals and contribute to more globally sustainable agriculture.
Taking advantage of these key opportunities will ensure the system is competitive, sustainable, resilient and prosperous well into the future.
Farm income forecast for 2022 and 2023
This presentation summarizes the key results from AAFC’s farm income forecast:
- The forecast provides two-year projections regarding the performance of the Canadian agricultural sector, including: farm income at the aggregate level; and net operating income, balance sheets, and total family income at the farm level.
- Short-term forecasts of domestic farm financial conditions for 2022 and 2023 were completed in December 2022 in consultation with the provincial ministries of agriculture and Statistics Canada (STC), based on market and growing conditions at that time.
- The forecast is based on federal-provincial views on the short-term economic outlook.
The winter farm income forecast provides an updated short-term financial outlook of the Canadian agriculture in an increasingly uncertain and volatile market environment.
- In 2021, despite the drought in Western Canada, continued COVID-19-related supply chain disruptions, and rising input costs, Net Cash Income rose significantly — 30.4%, thanks to robust crop and livestock commodity prices, which lifted receipts higher, well beyond farm expenses.
- The sector entered the year 2022 facing higher inflation as a result of robust global demand recovery amidst persistent supply-chain issues from the pandemic.
- The Russian invasion of Ukraine has also exacerbated the global situation by spreading shocks across the world and Canadian agricultural markets, leading to increased uncertainty and volatility, pushing both crop and input prices higher.
- Beside continued impacts of the pandemic, the sector faced other challenges in 2022, including:
- the lingering impacts of last year’s drought on the crop and livestock sectors. Despite significant improvement to Prairies growing conditions and production in 2022, drought conditions persisted in some parts of Western Canada
- Hurricane Fiona in late September, causing significant damage across the agricultural sub-sectors in the Maritimes
- remaining export restrictions on PEI seed potatoes following the discovery of potato wart disease in 2021, and outbreaks of avian influenza across Canadian provinces
- the flood impacts on British Columbia agricultural industry in late 2021 also persisted into 2022
The winter forecast attempts to provide a comprehensive assessment of the outlook for primary agriculture in Canada for 2022, and incorporates the impact of as many drivers as possible. However, uncertainty remains elevated moving into 2023.
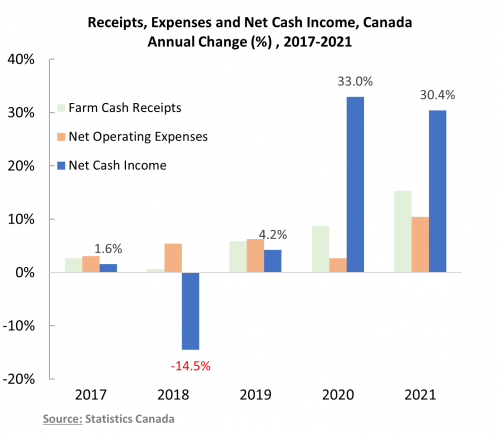
Evolution of Net Cash Income and key drivers
Source: Statistics Canada
Description of the above image
Receipts, expenses and net cash income
This chart presents annual percentage changes in Net Cash Income and its components of Farm Cash Receipts and Net Operating Expenses, between 2017 and 2021. Net cash income had strong increases in 2020 and 2021 due to strong growth in farm cash receipts. Farm cash receipts were up 2.7% in 2017, 0.7% in 2018, 5.9% in 2019, 8.7% in 2020 and 15.3% in 2021. Net Operating Expenses were up 3.1% in 2017, 5.4% in 2018, 6.3% in 2019, 2.7% in 2020 and 10.5% in 2021. Net Cash Income was up 1.6% in 2017, declined -14.5% in 2018, and increased 4.2% in 2019, 33.0% in 2020 and 30.4% in 2021.

Source: Statistics Canada
Description of the above image
Production of major grains and oilseeds
This chart presents annual percentage changes in the production of major grains and oilseeds in Canada between 2017 and 2021. Crop production rose 34% in 2022 following the drought induced reduction of 28% in 2021.
Source: Bank of Canada
Description of the above image
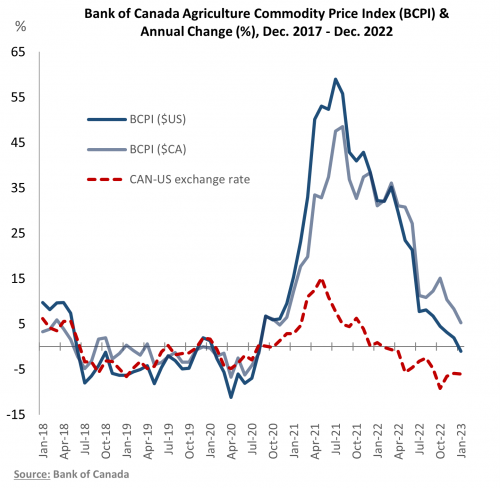
Bank of Canada Agricultural Commodity Price Index
This chart presents year-over-year changes in the Bank of Canada monthly Agricultural Commodity Price Index (BCPI). The components of the BCPI include: potatoes, cattle, hogs, wheat, barley, canola and corn. The BCPI is priced in US dollars, however, the Canada-US exchange rate is used to convert the BCPI into its equivalent index in Canadian dollars, which are all shown on this chart. Agricultural commodity prices started to rise in late 2020. Agricultural commodity prices continued to increase sharply during 2021. But, in the summer of 2022, improved global supply conditions and a gradual end to Russia’s blockade of Ukrainian grain exports along with changing macroeconomic factors (including rising interest rates and global recession concerns) drove agricultural commodity prices lower.

Source: Statistics Canada, AAFC calculations
Description of the above image
Machinery fuel, fertilizer and commercial feed price
This chart presents the annual percentage changes in the prices of machinery fuel, fertilizers and commercial feed, the three major farm expense items. In 2020 with a global economic decline, crude oil and natural gas prices dropped and, accordingly, farm energy expenses declined. For 2021, with global economic growth and the recovery of global trade, rising energy prices drove farm energy expenses higher. Additionally, the spike in global inflation in 2021 affected farm input prices. Higher crop prices increased feed costs for livestock sector as well.
Historic increases in expenses posed challenges for the sector, but strong commodity prices, particularly in the grains and oilseeds sector, led to a small overall increase in Net Cash Income with further growth expected in 2023.
Following the run-up in 2021, global crop and input prices continued to rise in 2022 and, despite some seasonal weakness, have remained historically high, in large part due to additional supply shocks and disruptions generated by the Russian invasion of Ukraine. As a result, both receipts and expenses are forecast to have increased in 2022, with receipts slightly outpacing expenses, this is expected to have led to a small growth in 2022 Net Cash Income.
Farm expenses, which saw strong growth in 2021, are forecast to have grown even more significantly due to continued rising costs for key inputs including fertilizers, fuel, and feed, fueled by the Russian invasion of Ukraine:
- Upward price pressures on fertilizers were exacerbated by the war, and are forecast to have climbed sharply from 2021.
- Historically high grain prices due to global supply pressures from the war and adverse weather conditions in some key regions, as well as continued strong demand for grains, are expected to have led to higher feed costs in 2022.
- Crude oil prices surged in 2022 on fears of Russian oil export disruptions in a tight supply-demand balance situation.
- Successive interest rate hikes by the Bank of Canada to tame inflation in 2022 are also forecast to have significantly increased interest expenses on Canadian farms.
Significantly higher prices for most crops have more-than offset the reduction in 2022 marketings (quantities sold), which were due to low inventories of crops at the beginning of 2022 following the 2021 drought, and are forecast to have driven grain receipts higher in 2022. Higher cattle prices on robust global demand, as well as cost-driven increases in the prices of supply-managed commodities, are expected to have raised livestock receipts in 2022.
Looking out to 2023, continued growth in receipts, especially as grain marketings return to normal with the large 2022 harvest, as well as expenses stabilizing, is expected to push Net Cash Income to a substantial new record. However, significant uncertainty remains as the market continues to evolve and growing conditions for 2023 are still uncertain.
Following two consecutive years of strong growth, Net Cash Income is forecast to have risen marginally 1.2% to $23.2 billion in 2022, before seeing more meaningful growth in 2023.
Net Cash Income, Canada and the United States, 2002 to 2023 (forecast)

Source: Statistics Canada, USDA-ERS, December 2022 and AAFC forecasts for 2022–2023. Five-year average refers to 2017–2021
Description of the above image
Net Cash Income, Canada and the United States, 2002 to 2023 (forecast)
This chart indicates a general upward trend that begins at $7.5 billion in 2002 up to $22.9 billion in 2021, with Net Cash Income expected to have reached $23.2 billion in 2022 and to increase further to $25.9 billion in 2023. This chart also compares net cash income in Canada to U.S. farm net cash income, shown in a red line and read from the right axis. Consistent with our results, according to the USDA forecast, the U.S. is also expected to have seen an increase in its NCI in 2022. U.S. farm expenses are expected to have grown substantially up 19 per cent in 2022, somewhat moderating income growth.
2022 Net Cash Income is expected to be the highest on record and well above the previous five-year average. By comparison, Net Cash Income in the United States is forecast to have increased significantly and also to a new record in 2022, 64% above the previous five-year average, mainly owing to larger increases in crop and livestock receipts, more than offsetting sharply reduced government payments and increased production expenses.
A small growth in 2022 Net Cash Income is forecast to have occurred as the gains in receipts only marginally outweigh the rise in expenses. Stronger receipt growth and lower expenses are forecast to lift Net Cash Income further up in 2023.
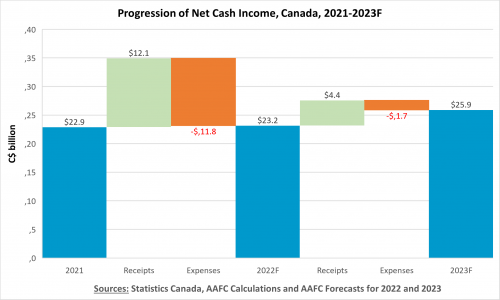
Progression of Net Cash Income, Canada, 2021 to 2023 (forecast)
Sources: Statistics Canada, AAFC calculations and AAFC forecasts for 2022 and 2023
Description of the above image
Progression of Net Cash Income, Canada, 2021 to 2023 (forecast)
Waterfall chart showing the evolution of Net Cash Income and the expected changes (in billion dollars) in its Farm Cash Receipts (Receipts) and Expenses components in 2022 and 2023, which result in the forecasted 2022 NCI and 2023 NCI.
Receipts are expected to increase by $12.1 billion in 2022 and expenses to rise by $11.8 billion, which are subtracted from receipts and result in an expected NCI of $23.2 billion in 2022. In 2023, Receipts are forecast to increase by $4.4 billion while expenses to grow by $1.7 billion, resulting in a 2023 Net Cash Income of $25.9 billion.
Following a strong increase in 2021, expenses are forecast to have continued rising even more significantly in 2022, well above the 2017-2021 average. However, slightly stronger growth in receipts is forecast to have outpaced the rise in expenses. Expenses in 2023 are forecast to grow at a slower rate while receipts are forecast to rise more proportionally.
Farm expenses are expected to have risen significantly by 19.5% in 2022 to a record $72.1 billion, largely from higher prices, before stabilizing in 2023.
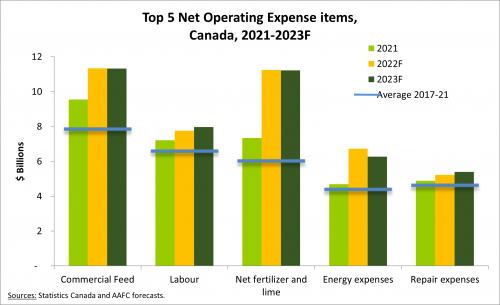
Top 5 Net Operating Expense items, Canada, 2021 to 2023 (forecast)
Description of the above image
This chart displays the forecast of the top 5 largest operating expense categories. Farm expenses are expected to have increased significantly by 19.5% to $72.1 billion in 2022, the largest increase since 1979, following a 10.5% increase in 2021. This increase was due to higher input prices, slightly offset by lower input quantities used, and was driven by changes in supply and demand fundamentals combined with soaring inflation. Feed, fertilizer, and fuel expenses which account for almost 40% of the total expenses in 2022 are forecast to have increased about 70% between 2020 and 2022 (2021: +26%; 2022: +43%). The expected lower fuel, fertilizer and feed prices are forecast to moderate farm expense increases in 2023.
| Average 2017 to 2021 | 2021 | 2022 (forecast) | 2023 (forecast) | |
|---|---|---|---|---|
| $ billions | ||||
| Commercial feed | 7.7 | 9.6 | 11.3 | 11.3 |
| Labour | 6.4 | 7.2 | 7.8 | 8.0 |
| Net fertilizer and lime | 5.9 | 7.3 | 11.3 | 11.2 |
| Energy expenses | 4.2 | 4.7 | 6.7 | 6.3 |
| Repair expenses | 4.5 | 4.9 | 5.2 | 5.4 |
Higher prices for fertilizers, fuel and commercial feed are behind the growth in 2022 farm expenses, which is expected to have exceeded the strong increase seen in 2021 (19.5% versus 10.5%) and be well above the average growth rate of the past five years (19.5% versus 5.6%). Expectedly lower costs for fertilizers and fuel are forecast to lead to a much smaller increase (2.3%) in farm expenses in 2023.
Crop and livestock receipts in 2022 are forecast to have grown 16.5% and 11.3%, respectively, primarily from higher prices.
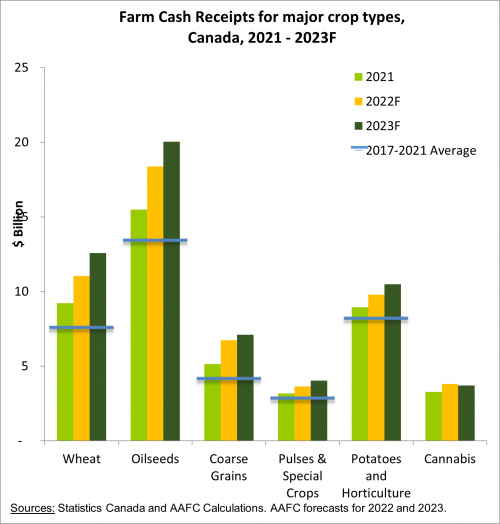
Farm Cash Receipts for major crop types and major commodities, Canada, $ billions, 2021 to 2023 (forecast)
Sources: Statistics Canada and AAFC calculations, AAFC forecasts for 2022 and 2023
Description of the above image
Farm Cash Receipts for major crop types and major commodities, Canada, $ billions, 2021 to 2023 (forecast)
| Wheat | Oilseeds | Coarse grains | Pulses and special crops | Potatoes and horticulture | Cannabis | |
|---|---|---|---|---|---|---|
| 2017-2021 average | 7.4 | 13.3 | 4.0 | 2.7 | 8.1 | 1.8 |
| 2021 | 9.2 | 15.5 | 5.1 | 3.2 | 8.9 | 3.3 |
| 2022 forecast | 11.0 | 18.4 | 6.7 | 3.6 | 9.8 | 3.8 |
| 2023 forecast | 12.6 | 20.0 | 7.1 | 4.0 | 10.5 | 3.7 |
Notes
Wheat includes durum and wheat, excluding durum.
Oilseeds include canola, soybeans and flaxseed.
Coarse grains include barley, corn, oats and rye.
Pulses and special crops include canary seeds, chickpeas, dry beans, dry peas, lentils, mustard seeds and sunflower seeds.

Sources: Statistics Canada and AAFC calculations, AAFC forecasts for 2022 and 2023
Description of the above image
Farm Cash Receipts for major crop types and major commodities, Canada, $ billions, 2021 to 2023 (forecast)
| Cattle and calves | Hogs | Dairy | Poultry and egg | |
|---|---|---|---|---|
| 2017-2021 average | 9.4 | 4.8 | 6.9 | 4.5 |
| 2021 | 10.2 | 6.3 | 7.4 | 5.1 |
| 2022 forecast | 11.8 | 6.5 | 8.1 | 5.9 |
| 2023 forecast | 12.5 | 6.4 | 8.5 | 6.1 |
All major crop commodity groups are forecast to have seen receipt growth in 2022, led by oilseeds (canola and soybeans), wheat (excluding durum), and corn. While higher prices were the main driver in 2022 (except for the boosting impacts of the large 2021 corn and soybean crops on their receipts), stronger marketings are behind the forecast receipt increase in 2023. Livestock receipts in 2022 are forecast to have grown mostly from notable increases in the cattle and supply-managed sectors, underpinned by higher prices on robust global demand and increased costs for dairy and poultry production.
On a cash basis, program payments are forecast to have increased 14.5 per cent to $6.8 billion in 2022, the largest amount on record and the result of higher AgriInsurance indemnities.
Evolution of program payments by major category, Canada, 2002 to 2023 (forecast)

Sources: Statistics Canada and AAFC forecasts for 2022-2023. Data are reported by calendar year. ‘BRM programs excluding AgriInsurance’ include NISA; CAIS beginning in 2004; AgriStability, AgriInvest and AgriRecovery beginning in 2008.
Description of the above image
Evolution of program payments by major category, Canada, 2002 to 2023 (forecast)
BRM excluding AgriInsurance include AgriStability, AgriInvest and AgriRecovery.
In general, the share of program payments out of total farm cash receipts has been declining since 2003. It increased in 2021 due to significantly higher AgriInsurance payments in response to the drought in Western Canada and is forecast to continue increasing in 2022 as producers continue to receive indemnities following the 2021 drought.
Rising AgriInsurance indemnities in 2022 reflect the continued severe impacts of the 2021 drought on Western producers, which, along with higher “other payments," are expected to have offset lower payments from other BRM programs (AgriStability, AgriInvest and AgriRecovery) in 2022. In 2023, a decline in program payments resulting from a sharp reduction in AgriInsurance indemnities is forecast.
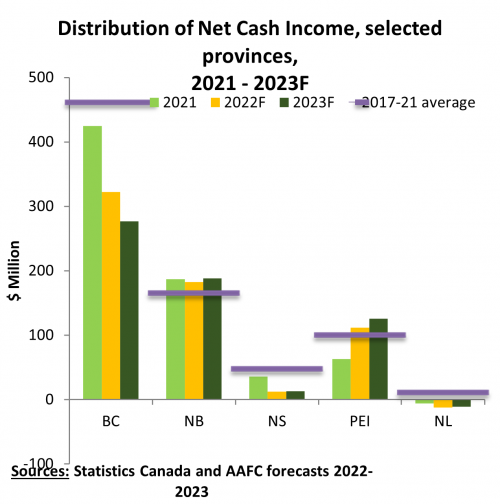
Larger provinces (except for Saskatchewan), as well as Prince Edward Island, are forecast to have seen growth in their 2022 Net Cash Income.
Distribution of Net Cash Income, selected provinces, 2021 – 2023 (forecast)

Sources: Statistics Canada and AAFC forecasts 2022-2023
Description of the above image
Distribution of Net Cash Income, selected provinces, $ billions, 2021 – 2023 (forecast)
Larger provinces (except for Saskatchewan), as well as Prince Edward Island, are forecast to have seen growth in their 2022 Net Cash Income.
| Alberta | Saskatchewan | Manitoba | Ontario | Quebec | |
|---|---|---|---|---|---|
| 2017 | 3.5 | 4.4 | 1.8 | 2.4 | 2.0 |
| 2018 | 2.4 | 4.0 | 1.5 | 2.5 | 1.6 |
| 2019 | 2.9 | 3.6 | 1.3 | 2.5 | 1.9 |
| 2020 | 3.4 | 6.0 | 1.7 | 3.6 | 2.2 |
| 2021 | 5.3 | 7.7 | 2.5 | 4.3 | 2.4 |
| 2022 (forecast) | 5.8 | 6.9 | 3.0 | 4.5 | 2.4 |
| 2023 (forecast) | 6.0 | 9.1 | 3.1 | 4.7 | 2.3 |
Distribution of Net Cash Income, selected provinces, $ millions, 2021 to 2023 (forecast)
Sources: Statistics Canada and AAFC forecasts 2022-2023
Description of the above image
Distribution of Net Cash Income, selected provinces, $ millions, 2021 to 2023 (forecast)
| British Columbia | New Brunswick | Nova Scotia | Prince Edward Island | Newfoundland and Labrador | |
|---|---|---|---|---|---|
| 2017 | 405.2 | 135.0 | 49.5 | 101.3 | 15.6 |
| 2018 | 409.5 | 142.9 | 1.1 | 93.8 | 10.7 |
| 2019 | 521.3 | 199.9 | 62.3 | 108.2 | 12.4 |
| 2020 | 517.2 | 134.1 | 11.0 | 108.3 | -5.8 |
| 2021 | 424.8 | 186.9 | 35.8 | 63.2 | -5.6 |
| 2022 (forecast) | 322.1 | 182.6 | 12.6 | 111.9 | -12.3 |
| 2023 (forecast) | 277.0 | 188.4 | 13.1 | 125.8 | -11.0 |
The largest absolute NCI increase in 2022 is forecast to have occurred for Alberta, driven by strong growth in both crop and livestock receipts. 2022 program payments in Saskatchewan are expected to have fallen from the record payments in 2021, moderating the increase in commodity receipts, resulting in a decline in the province’s 2022 NCI. In 2023, NCI for most provinces is forecast to rise, as receipt growth is expected to continue to outpace a much smaller increase in expenses, except for Quebec and British Columbia where expense growth is expected to be slightly larger than that of receipts
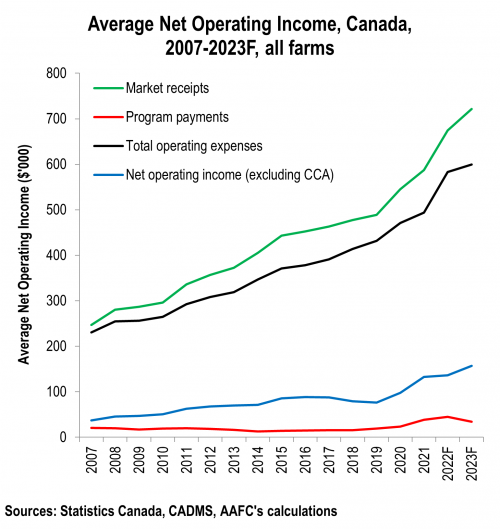
At the national level, despite a forecast jump in average expenses in 2022, average NOI is forecast to have hit consecutive grains and oilseeds-led records.
Average Net Operating Income, Canada, thousands of dollars, 2007-2023 (forecast), all farms
Sources: Statistics Canada, CADMS, AAFC's calculations
Description of the above image
Average Net Operating Income, Canada, thousands of dollars, 2007-2023 (forecast), all farms
This chart presents average Net Operating Income, and its constituent parts from 2007 to 2023. The years 2022 and 2023 are forecasted values, while 2007 to 2021 are actual values given by Statistics Canada. Average market receipts and operating expenses at the national level for all farms have grown continuously since 2007. With the exception of a dip caused by higher growth in expenses between 2017 and 2019, average Net Operating Income has also grown consistently, reaching back to back records in 2020 and 2021, with forecast records for 2022 and 2023. Average program payments have grown steadily since 2020, and are forecast to decrease in 2023.
Net Operating Income distribution, Canada, thousands of dollars and percentage of farms, 2021 to 2023 (forecast), all farms

Sources: Statistics Canada, CADMS, AAFC's calculations
Description of the above image
Net Operating Income distribution, Canada, thousands of dollars and percentage of farms, 2021 to 2023 (forecast), all farms
This chart presents the distribution of Net Operating Income for the years 2021, 2022 and 2023. Each curved line represents a different year as noted in the legend. The straight blue line is the 2021 average Net Operating Income. For farms in the top income percentiles, Net Operating Income is forecast to grow in 2022 and 2023, while decreases followed by growth are forecast for farms in the lower income percentiles in 2022 and 2023, respectively.
The following example illustrates approach to reading the chart: in 2021 80 per cent of farms (x-axis) had a Net Operating Income of 192.3 thousand dollars or less (y-axis), while in 2023 80 per cent of farms are forecast to have a Net Operating Income of 228.9 thousand dollars or less.
In line with industry level trends and led by the Grains and Oilseeds sector, average Net Operating Income is forecast to have continued a pattern of yearly records which began in 2020, though a sharp increase in forecasted operating expenditures blunts the Net Operating Income increase in 2022. This jump in expenditures primarily comes from fertilizer, feed, and fuel, as well as the notable additions of livestock purchases and interest, as high feed prices begin to affect livestock input costs, and interest rate increases take hold.
Average Net Operating Income for almost all farm types increased in 2021. However, growth in input costs is forecast to have led to declining average NOI for most sectors in 2022, which reverses in 2023. The livestock sectors, and particularly cattle, are especially hard-hit.
Percentage change in average Net Operating Income by farm type, Canada
| 2020/2019 | 2021/2020 | 2022 (forecast)/2021 | 2023 (forecast)/2022 (forecast) | |
|---|---|---|---|---|
| Grains and oilseeds | 47.6 | 47.3 | 16.8 | 14.1 |
| Potato | 5.3 | 10.1 | 8.5 | 24.1 |
| Vegetable | 27.2 | -1.3 | -27.7 | 27.9 |
| Fruit | 48.9 | 19.3 | -33.1 | 21.5 |
| Greenhouse, nursery | 70.4 | 13.8 | -0.4 | 4.3 |
| Other crops | 10.7 | 18.6 | -21.2 | -1.5 |
| Cattle | -14.0 | 27.0 | -118.3* | N/A* |
| Dairy | 10.5 | 24.4 | 14.1 | -2.9 |
| Hogs | -26.7 | 129.1 | -7.5 | 19.4 |
| Poultry and eggs | 0.2 | 11.3 | -9.1 | 4.6 |
| Other livestock | 20.6 | 38.3 | -2.3 | 15.7 |
Note
* Among the livestock sectors, the cattle sector has some of the tightest average margins, both as a percentage and dollar amount, which makes for higher year-over-year per cent fluctuations in Net Operating Income. In 2022 cattle Net Operating Income was -$4,600, increasing to +$13,700 in 2023. A 2023/2022 forecast percentage change is not mathematically possible. The 2017-2021 average is $25,000.
Other farm-level financial measures are generally forecast to have followed an upward trajectory, but sector-level variation exists, and higher interest rates along with lower growth in Net Operating Income have blunted growth in net worth.
Average total income per farm family, 2016 to 2023 (forecast)

Sources: Statistics Canada, AAFC forecast and CADMS
Description of the above image
Average total income per farm family, 2016 to 2023 (forecast)
This chart presents average total farm-family income from 2016 to 2023, broken out into the family’s share of net operating income, or on-farm income, and family income from sources not associated with the production and sale of agricultural commodities, or off farm income. Values from 2016 to 2021 are from Statistics Canada, while values in 2022 and 2023 are forecast. Average total family income remains fairly steady around 160 thousand dollars from 2016 until 2020, and begins a steady ascent in 2021, up to a forecast 255.4 thousand dollars in 2023. Both on- and off-farm income grow throughout this period.
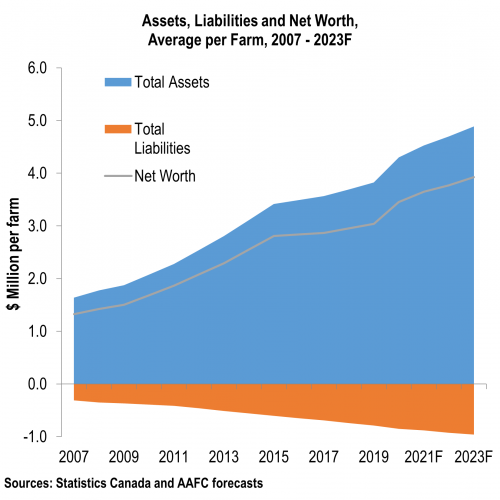
Assets, liabilities and net worth, average per farm, 2007 to 2023 (forecast)
Sources: Statistics Canada and AAFC forecast
Description of the above image
Assets, liabilities and net worth, average per farm, 2007 to 2023 (forecast)
This chart presents average farm net worth, along with average total assets and liabilities, from 2007 to 2023. Values from 2020 to 2023 are forecast. Throughout the entire period covered by the chart, average asset growth outpaces growth in average liabilities, creating steady growth in average net worth from roughly 1.3 million dollars in 2007 to 3.9 million dollars in 2023.
Average farm family income is forecast to follow trends in Net Operating Income during 2022/23, with other income helping to limit the impacts of Net Operating Income declines in sectors where market prices have not increased to the same degree as that of grains and oilseeds.
Average net worth is forecast to grow for each year of the forecast period, however with the introduction of higher interest rates in 2022, growth is expected to slow, as liabilities increase at a higher rate than assets.
Key takeaways
Following strong growth in 2020 and 2021, sector-wide Net Cash Income is forecast to have increased marginally in 2022. Net Cash Income is forecast to increase more significantly in 2023.
Overall farm-level Net Operating Income is expected to follow the same trends, with variation by farm type.
Alongside increasing Net Cash Income and Net Operating Income, net worth is expected to continue growing, and the sector is expected to maintain high levels of financial well-being.
The Russian invasion of Ukraine is expected to continue impacting the world and Canadian agriculture sectors this year and beyond and, along with other sources of uncertainty, including persistent inflation and weakened global economic prospects, may result in significant shifts in the sector outlook between now and the end of the year.
Annex: Comparability with current data from Statistics Canada and information on future data releases
This forecast relies heavily on data from Statistics Canada on the farm financial situation, and where possible aligns with existing concepts and methodologies.
- Aggregate estimates of farm income align to historical Net Farm Income statistics (released November 28, 2022) and farm-level measures are based on data from the Agriculture Taxation Data Program (released December 2, 2022).
In the coming months Statistics Canada will be releasing regular updates to its data, some of which will update and replace the data presented in this forecast
- Farm Cash Receipts will be updated on February 28, 2023, providing data on the fourth quarter receipts for 2022.
- Net Farm Income data will be updated on May 25, 2023, with data on farm income, farm cash receipts and operating expenses for 2022, as well as first quarter farm cash receipts for 2023.
- Farm operating expenses and revenues from the Agriculture Taxation Data Program will be released on March 31, 2023, updating the data released in early December which was used to support estimates of farm-level income.
Once released, data from Statistics Canada should be considered the most current data available for a given time period.
Overview of the sector

Description of the above image
Agriculture and agri-food is a major contributor to the Canadian economy.
Agriculture and Agri-Food Canada (AAFC) is mandated to support primary agriculture and food and beverage processing, but the sector reaches into the broader agri-food system, which influences other service sectors across the food supply-chain.
The agriculture and agri-food system
Primary agriculture
- GDP: $31.9B (1.6%)
- Employment: 241,500
Food Retail and Wholesale
- GDP: 32.9B (1.7%)
- Employment: 664,000
Foodservice
- GDP: $24.2B (1.2%)
- Employment: 829,700
Food and beverage processing
- GDP: $33.2B (1.7%)
- Employment: 303,100
In 2021, the primary agriculture and food and beverage processing sectors
- Employed 544,600 people
- accounted for 3.3% of Canada’s GDP
- provided 1 in 30 jobs in Canada
Primary agriculture
An economic driver highly diversified across the country
- 189,874 farms
- Farms cover 62.2M hectares or 6.3% of Canada’s land area
- Concentrated across the Prairies,
- Quebec and Southern Ontario
- Average farm size doubled over the last 50 years due to increased consolidation and technological advances
Farm market receipts (billion $)
- A record high of $76.9B
- 4.7% average annual growth
- Largest 10% of farms generate 2/3 of all revenues
Food and beverage processing
Largest manufacturing industry in Canada
- 17.8% of all manufacturing GDP
- 17.5% of manufacturing employment (agri-food)
Facilities across the country, but most are in Ontario and Quebec
Food and Beverage Processing Sales totaled $141.3 billion in 2021
Main industries
- Meat
(25.2%) $ 35.6 billion - Dairy
(11.4%) $ 16.1 billion - Beverage
(10.3%) $ 14.6 billion - Bakeries and tortilla processing
(9.8%) $ 13.8 billion
Sector commodity breakdown

Description of the above image
Crop production
2021 GDP: $26.3B | Employment: 115,500
Principal field crops
- Farm Market Receipts
$32.7B - Number of Reporting Farms
65,135note 1 - Export
$24.5B - Top Export Markets
China (20.4%), Japan (10.8%), U.S. (9.6%)
Key stakeholders
- Canada Grains Council
- Cereals Canada
- Grain Growers of Canada
Horticulture
- Farm Market Receipts
$7.5B - Export
$3.8B - Number of Reporting Farms
17,433note 1 - Top Export Markets U.S.
(96.6%),
Netherlands (0.7%),
China (0.5%)
Key stakeholders
- Canadian Horticulture Council
- Canadian Produc
- Marketing Association
- Canadian Horticulture Alliance
Animal production
2021 GDP: $5.6B | Employment: 111,700
Animal production
- Farm Market Receipts
$29.9B - Export
$2.2B - Number of Reporting Farms
76,796note 1 - Top Export Markets U.S.
(95.3%), Japan (1.1%), Russia (1%)
Key stakeholders
- Supply-managed farmers associations (e.g., dairy and chicken)
- Canadian Pork Council
- Canadian Cattle Association
Food and beverage
2021 GDP: $33.2B | Employment: 303,100
Processing
- Sales
$141.3B - Export
$47.5B - Establishments with Employees
8,093 - Top Export Markets
U.S. (73.6%),
Japan (4.9%),
China (8%)
Key stakeholders
- Food and Health Consumer Products of Canada
- Food and Beverage Canada
- Wine Growers of Canada
- Canadian Meat Council
Top three crop and livestock commodities by average 2017-2021 farm cash receipts
- BC
Dairy $673M
Vegetables $618M
Nursery Plants $512M - AB
Cattle and Calves $5.2B
Canola $2.9B
Wheat $2.1B - SK
Canola $5.6B
Wheat $3.5B
Cattle and Calves $1.5B - MB
Canola $1.5B
Wheat $1.2B
Hogs $1.1B - ON
Dairy $2.2B
Vegetables $2B
Soybeans $1.7B - QC
Dairy $2.5B
Hogs $1.5B
Poultry $819M - NB
Potatoes $164M
Dairy $118M
Floriculture, Nursery and Sod $49M - NL
Dairy $47M - Eggs $19M
Floriculture, Nursery and Sod $10M - PEI
Potatoes $239M
Dairy $90M
Cattle and Calves $32M - NS
Dairy $149M
Fruit $66M
Eggs $43M