
Market overview
Online grocery value sales grew by 105% from 2019-20, but less than 3% of total packaged food and beverage sales came from online channels.
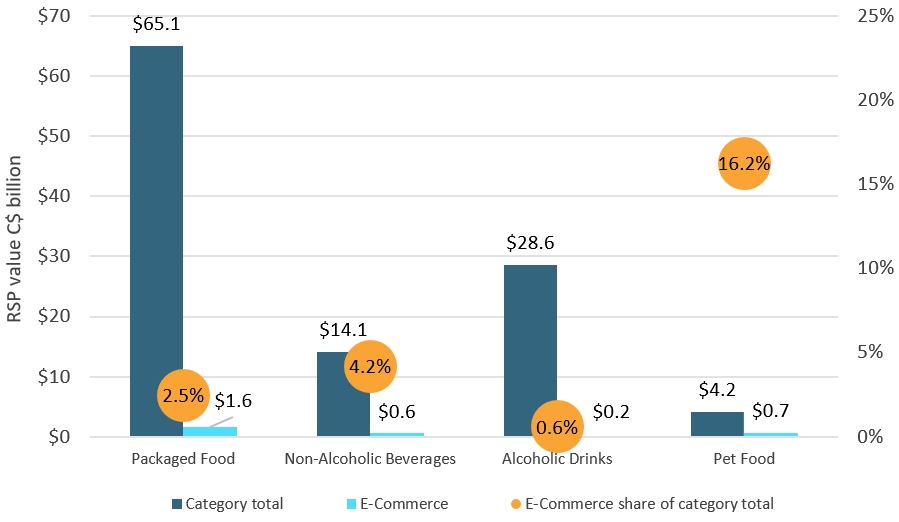
Canada's e-commerce penetration is highest in Pet Food.
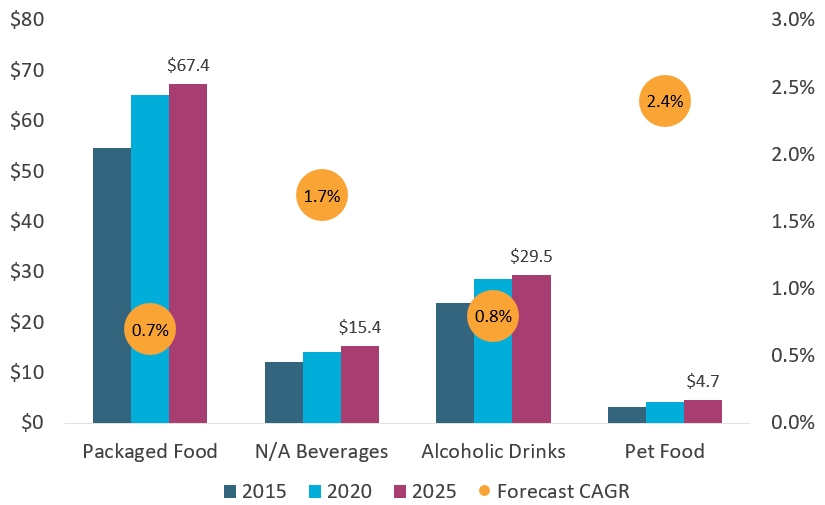
Canadian packaged food and beverage market is projected to grow by more than Can$5 billion by 2025, with much of this growth expected to come from e-commerce.
Amazon and the larger grocery retailers are main websites for online groceries in Canada.
| Metric | Value | Rank (of 10) |
|---|---|---|
| Total Packaged Food and Beverage Market in 2020 | Can$112.0 bn | 9th |
| E-commerce Channel Size of Total Packaged Food and Beverage in 2020 | Can$3.0 bn | 8th |
| E-commerce Channel Share of Total Packaged Food and Beverage in 2020 | 2.7% | 7th |
Description of above image
| Category | Category total | E-commerce | E-commerce share of category total |
|---|---|---|---|
| Packaged Food | $65.1 | $1.6 | 2.5% |
| Non-Alcoholic Beverages | $14.1 | $0.6 | 4.2% |
| Alcoholic Drinks | $28.6 | $0.2 | 0.6% |
| Pet Food | $4.2 | $0.7 | 16.2% |
Source: Euromonitor International
Forecast industry performance
Food and beverage e-commerce outlook in Canada
Investments from key players in digital transformation such as Walmart and Loblaw's and other retailers have worked out the kinks for selling groceries online.
Demand for packaged food and beverages e-commerce will increase and expand at an expected Compound Annual Growth Rate (CAGR) of 23% through 2025, well outpacing the overall category growth.
Description of above image
| Category | 2015 | 2020 | 2025 | Forecast CAGR* |
|---|---|---|---|---|
| Packaged Food | $54.7 | $65.1 | $67.4 | 0.7% |
| Non-Alcoholic Beverages | $12.1 | $14.1 | $15.4 | 1.7% |
| Alcoholic Drinks | $23.9 | $28.6 | $29.5 | 0.8% |
| Pet Food | $3.3 | $4.2 | $4.7 | 2.4% |
| *CAGR: Compound Annual Growth Rate | ||||
Source: Euromonitor International
Note: This is not e-commerce specific
| Category | Value - Rank (of 10) |
|---|---|
| Packaged Food | $2,275 million (5th of 10) |
| Non-Alcoholic Beverages | $1,275 million (8th) |
| Alcoholic Drinks | $903 million (5th) |
| Pet Food | $527 million (4th) |
Sector snapshot
Packaged food
Online grocery sales value grew 105% in 2020 with many grocery retailers partnering with delivery platforms (that is, Instacart), offering click-and-collect or curbside pickup.
While e-commerce has traditionally been offered by larger stores, smaller players are adapting their online offerings to respond to new demands from consumers.
Rice, pasta and noodles, ready meals, cooking sauces, frozen produce, snacks and dairy products all witnessed rising overall demand, especially via sales through e-commerce platforms.
Non-alcoholic beverages
The share of e-commerce in soft drinks is fairly small, and in 2020, despite the growth, will continue to only comprise a small portion of soft drink distribution share.
Hot drinks e-commerce has seen the strongest increase in sales in 2020, as it was viewed as both safe and economical. Looking ahead, fortified and functional hot drinks could reach levels of mainstream popularity that have thus far not been observed. Health-conscious consumers will favor fruit/herbal teas and functional variants that offer either a stimulating or calming effect, or claim to boost immunity.
Alcoholic drinks
All alcoholic drink categories saw off-trade volume growth in 2020. Moving forward, beer is expected to be the only category to see a decline in total volume growth through 2024, while Ready-to-Drink (RTD)s is expected to see a dynamic double-digit increase.
Sales of alcoholic drinks via e-commerce were very low prior to 2020; however this channel's share rose strongly during the pandemic. Consumer interest in e-commerce prompted more players to launch or improve their e-commerce sites, with Liquor Control Board of Ontario (LCBO), The Beer Store (TBS) and Société des Alcools du Québec (SAQ) offering online sales, and Uber Eats even joining the fray.
Pet food
The growth of e-commerce is expected to continue in pet care, changing the competitive environment. Consumers value this channel due to convenience, a wide product range and the benefit of having these often heavy goods such as pet food delivered to the door.
In addition to e-commerce-only players, brick-and-mortar stores are revamping their sales strategies and putting greater emphasis on e-commerce, which is expected to drive strong growth in this channel.
Industry dynamics and opportunities
E-commerce size and growth
Description of above image
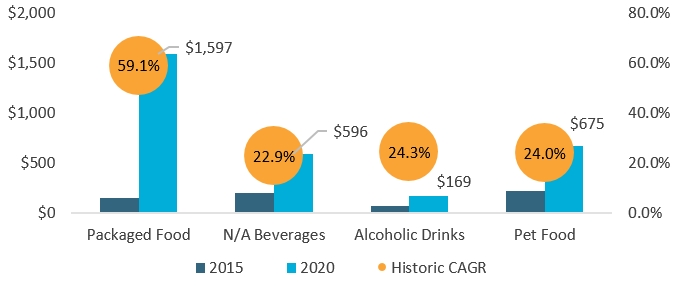
| Market | 2015 | 2020 | Historic CAGR* |
|---|---|---|---|
| Packaged Food | $149 | $1,597 | 59.1% |
| Non-Alcoholic Beverages | $203 | $596 | 22.9% |
| Alcoholic Drinks | $68 | $169 | 24.3% |
| Pet Food | $219 | $675 | 24.0% |
| *CAGR: Compound Annual Growth Rate | |||
Source: Euromonitor International
Competitive environment
Description of above image
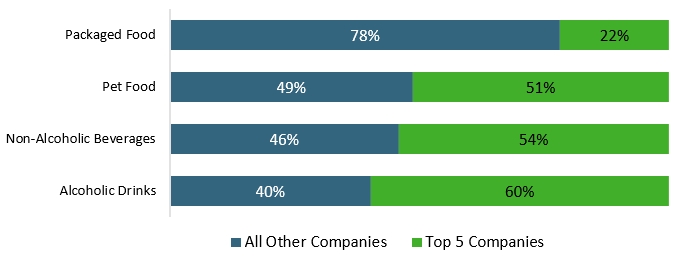
| Category | All Other Companies | Top 5 Companies |
|---|---|---|
| Packaged Food | 78% | 22% |
| Pet Food | 49% | 51% |
| Non-Alcoholic Beverages | 46% | 54% |
| Alcoholic Drinks | 40% | 60% |
Source: Euromonitor International
Key e-commerce websites
| Rank (SKUs[1] on Via) | Packaged Food | Non-Alcoholic Beverages | Alcoholic Drinks | Pet Food |
|---|---|---|---|---|
| 1 | Amazon (60.2 thousand SKUs) | Amazon (17.8 thousand) | IGA (419) | Amazon (8.7 thousand) |
| 2 | Loblaws (7.9 thousand) | Loblaws (1.6 thousand) | Grocery Gateway (261) | Miscota (8.2 thousand) |
| 3 | Real Canadian (7.0 thousand) | Real Canadian (1.3 thousand) | Amazon (51) | Walmart (0.5 thousand) |
| 4 | IGA (4.8 thousand) | IGA (1.1 thousand) | Loblaws (19) | Real Canadian (0.4 thousand) |
| 5 | Grocery Gateway (4.8 thousand) | London Drugs (1.0 thousand) | Real Canadian (11) | Loblaws (0.3 thousand) |
| 1: SKU data comes from Euromonitor International's proprietary Via data extraction tool, and was extracted in March 2021 | ||||
Key highlights for Canadian producers
Packaged food
Ready meals accounted for 60% of the packaged food e-commerce channel sales in 2020 in Canada as at-home meal consumption spiked during periods of restricted mobility.
Non-alcoholic beverages
RTD coffee and RTD tea are expected to post the highest growth across beverages over the forecast period, with an 11.5% and 6.8% value CAGR through 2025.
Alcoholic drinks
Cannabis-infused non-alcoholic beer is a new product development opportunity with potential, and a chance for Canada to potentially take a global lead in this emerging product category.
Pet food
E-commerce will also benefit from the advance of subscription-based shopping for dog food, such as from online pet specialist retailer Fetch & Stay.