

Note: This report includes forecasting data that is based on baseline historical data.
Executive summary
In 2022, the top five global importers of fish and seafood products at a total market value share of 49.3% were the United States, China, Japan, Spain, and France. Last year, Germany was the 8th largest importer for fish and seafood in the world, representing a market share of 3.2% and a value of US$5.8 billion (1,034.1 thousand tonnes).
With total global imports declining in Germany by a compound annual growth rate (CAGR) of 0.5% (2018-2022), the country's top three suppliers of fish and seafood were Poland (US$1.2 billion), the Netherlands (US$638 million) and Norway (US$563.4 million). Canada was Germany's 38th largest supplier of fish and seafood products, representing a 0.3% market value share at US$18.7 million (1.3 thousand tonnes) in 2022.
Top imported fish and seafood products to Germany were frozen fillets of Alaska Pollack, followed by both smoked and fresh/chilled types of Pacific, Atlantic and Danube salmon in 2022. Canada's top products supplied to Germany were frozen, live, fresh or chilled lobsters, frozen scallops and other molluscs, frozen fish fillets; and processed shrimps and prawns, in airtight containers.
In 2022, retail sales of fresh fish and seafood registered a total value of US$4.7 billion (193.7 thousand tonnes) with fish being the most popular choice (68%) in Germany, followed by crustaceans (19%), and molluscs and cephalopods (13%). Meanwhile, sales of processed seafood totaled US$4.1 billion (380.5 thousand tonnes) with shelf stable seafood accounting for 48%, followed close behind by frozen (36%), and chilled seafood types (16%) over the year.
Euromonitor International, states that salmon is mostly perceived for its healthy image, especially as an alternative to pork or beef. The fish and fish ingredient products that have been launched the most in Germany's retail grocery stores include salmon, prawns, tuna, fish fats, Pacific Pollack, and Herring (Mintel, 2023). Furthermore, new meat and fish alternatives (still a niche market) in Germany continues to gain in popularity, where despite the fact that Germans are known to not be particularly changeable in terms of consumption patterns, they are showing a greater willingness to try new products beyond traditional ones.
Trade overview
In 2022, Germany was the 8th largest importer (3.2% market value share) of fish and seafood in the world. Germany's imports have been declining at a CAGR of 0.5%, decreasing from US$6.2 billion (1,203.8 thousand tonnes) in 2018 to US$5.8 billion (1,034.1 thousand tonnes) in 2022. Canada was the 13th largest market in fish and seafood, accounting for 2.2% of the total world market share at US$4.0 billion (597.3 thousand tonnes) over the year.
| Country | 2018 | 2019 | 2020 | 2021 | 2022 | CAGR* % 2018-2022 | Market share % in 2022 |
|---|---|---|---|---|---|---|---|
| Total - world | 164,035.3 | 161,622.6 | 149,806.3 | 172,715.4 | 179,400.7 | 2.3 | 100.0 |
| 1. United States | 23,988.6 | 23,520.8 | 22,976.5 | 30,179.3 | 32,392.9 | 7.8 | 18.1 |
| 2. China | 14,745.2 | 18,413.6 | 15,267.6 | 17,760.3 | 23,347.1 | 12.2 | 13.0 |
| 3. Japan | 15,782.5 | 15,564.6 | 13,577.9 | 14,375.7 | 15,387.4 | −0.6 | 8.6 |
| 4. Spain | 8,679.8 | 8,151.8 | 7,357.2 | 8,895.6 | 8,893.6 | 0.8 | 5.0 |
| 5. France | 7,154.9 | 6,817.1 | 6,502.5 | 7,895.2 | 8,243.5 | 3.6 | 4.6 |
| 6. Korea | 6,060.3 | 5,717.6 | 5,537.8 | 6,039.6 | 6,809.4 | 3.0 | 3.8 |
| 7. Italy | 7,113.8 | 6,731.0 | 6,151.6 | 7,541.9 | 6,500.8 | 2.0 | 3.6 |
| 8. Germany | 6,172.2 | 5,984.1 | 6,078.4 | 6,088.5 | 5,816.5 | −0.5 | 3.2 |
| 9. Sweden | 5,629.1 | 5,270.6 | 5,072.4 | 5,609.8 | 5,600.3 | −0.1 | 3.1 |
| 10. Netherlands | 4,540.5 | 4,521.2 | 4,610.6 | 5,155.7 | 4,953.0 | 4.3 | 2.8 |
| Subtotal - top 10 | 99,867.0 | 100,692.3 | 93,132.5 | 109,541.7 | 117,944.5 | 4.2 | 65.7 |
| Canada (13) | 3,085.1 | 3,256.5 | 2,978.9 | 3,698.2 | 3,976.4 | 6.6 | 2.2 |
|
Source: Global Trade Tracker, 2023 *CAGR: Compound Annual Growth Rate |
|||||||
| Country | 2018 | 2019 | 2020 | 2021 | 2022 | CAGR* % 2018-2022 | Market share % in 2022 |
|---|---|---|---|---|---|---|---|
| Total - world | 311,386.4 | 40,664.8 | 41,132.8 | 39,834.3 | 37,209.2 | −41.2 | 100.0 |
| 1. China | 5,214.9 | 6,256.8 | 5,667.2 | 5,744.6 | 6,469.9 | 5.5 | 17.4 |
| 2. United States | 2,901.3 | 2,825.9 | 2,907.4 | 3,267.9 | 3,331.1 | 3.5 | 9.0 |
| 3. Japan | 2,380.8 | 2,464.4 | 2,251.3 | 2,199.6 | 2,219.7 | −1.7 | 6.0 |
| 4. Thailand | 2,126.5 | 2,047.6 | 2,149.3 | 2,114.7 | 2,157.3 | 0.4 | 5.8 |
| 5. Korea | 1,558.4 | 1,531.4 | 1,536.6 | 1,652.7 | 1,713.7 | 2.4 | 4.6 |
| 6. Spain | 1,768.4 | 1,820.8 | 1,713.7 | 1,815.1 | 1,710.9 | −0.8 | 4.6 |
| 7. France | 1,212.9 | 1,228.1 | 1,223.9 | 1,349.8 | 1,347.7 | 2.7 | 3.6 |
| 8. Denmark | 1,293.5 | 1,245.6 | 1,183.7 | 1,244.7 | 1,068.4 | −4.7 | 2.9 |
| 9. Germany | 1,203.8 | 1,172.9 | 1,216.1 | 1,153.7 | 1,034.1 | −3.7 | 2.8 |
| 10. Netherlands | 1,097.6 | 1,066.9 | 1,104.7 | 1,175.4 | 1,008.3 | −2.1 | 2.7 |
| Subtotal - top 10 | 20,758.2 | 21,660.3 | 20,954.0 | 21,718.4 | 22,060.9 | 1.5 | 59.3 |
| Italy (12) | 1,133.7 | 1,145.0 | 1,046.8 | 1,152.0 | 953.8 | −4.2 | 2.6 |
| Sweden (14) | 815.9 | 818.5 | 860.7 | 854.9 | 732.0 | −2.7 | 2.0 |
| Canada (18) | 523.0 | 544.3 | 520.3 | 582. | 597.3 | 3.4 | 1.6 |
|
Source: Global Trade Tracker, 2023 *CAGR: Compound Annual Growth Rate |
|||||||
In 2022, the top three suppliers of fish and seafood to Germany were Poland, representing a 19.9% market value share (US$1.2 billion, 171.1 thousand tonnes), the Netherlands at 11% share (US$638 million, 140 thousand tonnes) and Norway at a 9.7% share (US$563.4 million and 79 thousand tonnes). Canada was Germany's 38th largest supplier of fish and seafood products at a 0.3% market share in 2022.
| Country | 2018 | 2019 | 2020 | 2021 | 2022 | CAGR* % 2018-2022 | Market share % in 2022 |
|---|---|---|---|---|---|---|---|
| Total - world | 6,172.2 | 5,984.1 | 6,078.4 | 6,088.5 | 5,816.5 | −0.5 | 100.0 |
| 1. Poland | 1,146.5 | 1,120.5 | 1,327.8 | 1,244.9 | 1,159.7 | 2.8 | 19.9 |
| 2. Netherlands | 731.5 | 656.5 | 721.1 | 759.2 | 638.0 | 1.3 | 11.0 |
| 3. Norway | 636.0 | 570.8 | 474.3 | 527.4 | 563.4 | −6.1 | 9.7 |
| 4. Denmark | 549.5 | 559.8 | 520.2 | 526.0 | 449.7 | −1.5 | 7.7 |
| 5. China | 431.2 | 532.3 | 437.4 | 402.3 | 444.6 | −2.3 | 7.6 |
| 6. Vietnam | 210.4 | 200.0 | 194.0 | 208.6 | 250.3 | −0.3 | 4.3 |
| 7. Russia | 122.6 | 100.0 | 107.1 | 149.8 | 178.6 | 6.9 | 3.1 |
| 8. United States | 211.2 | 245.3 | 235.6 | 242.7 | 158.6 |
4.8 |
2.7 |
| 9. Spain | 175.1 | 142.7 | 139.6 | 165.4 | 151.7 | −1.9 | 2.6 |
| 10. Lithuania | 201.7 | 219.0 | 209.8 | 173.6 | 133.2 | −4.9 | 2.3 |
| Subtotal - top 10 | 4,415.8 | 4,346.8 | 4,367.1 | 4,399.8 | 4,127.8 | −1.7 | 71.0 |
| Canada (38) | 25.0 | 22.0 | 20.7 | 24.6 | 18.7 | −0.6 | 0.3 |
|
Source: Global Trade Tracker, 2023 *CAGR: Compound Annual Growth Rate |
|||||||
| Country | 2018 | 2019 | 2020 | 2021 | 2022 | CAGR* % 2018-2022 | Market share % in 2022 |
|---|---|---|---|---|---|---|---|
| Total - world | 1,203.8 | 1,172.9 | 1,216.1 | 1,153.7 | 1,034.1 | −3.7 | 100.0 |
| 1. Poland | 159.2 | 161.6 | 193.7 | 179.9 | 171.1 | 1.8 | 16.5 |
| 2. Netherlands | 151.1 | 148.1 | 155.6 | 162.7 | 140.0 | −1.9 | 13.5 |
| 3. China | 116.3 | 130.3 | 109.1 | 100.9 | 99.0 | −4.0 | 9.6 |
| 4. Norway | 101.2 | 84.6 | 92.5 | 87.5 | 79.0 | −6.0 | 7.6 |
| 5. Denmark | 136.8 | 133.3 | 126.8 | 114.4 | 78.6 | −12.9 | 7.6 |
| 6. Russia | 36.2 | 24.4 | 27.5 | 37.1 | 41.2 | 3.3 | 4.0 |
| 7. Iceland | 39.7 | 35.3 | 32.5 | 38.2 | 32.1 | −5.2 | 3.1 |
| 8. Vietnam | 30.5 | 29.7 | 29.2 | 27.1 | 30.8 | 0.2 | 3.0 |
| 9. Peru | 29.1 | 30.4 | 35.0 | 25.6 | 28.5 | −0.5 | 2.8 |
| 10. United States | 58.9 | 58.5 | 57.6 | 51.1 | 27.8 | −17.1 | 2.7 |
| Subtotal - top 10 | 2,062.8 | 2,009.1 | 2,075.6 | 1,978.2 | 1,762.1 | −3.9 | 170.4 |
| Spain (13) | 26.7 | 22.7 | 22.3 | 23.5 | 20.7 | −6.2 | 2.0 |
| Lithuania (16) | 21.9 | 23.2 | 23.7 | 21.5 | 15.4 | −8.4 | 1.5 |
| Canada (52) | 2.1 | 1.8 | 2.0 | 2.9 | 1.3 | −11.4 | 0.1 |
|
Source: Global Trade Tracker, 2023 *CAGR: Compound Annual Growth Rate |
|||||||
Top imported fish and seafood products to Germany in terms of value were frozen fillets of Alaska Pollack at US$534.4 million (137.0 thousand tonnes), followed by smoked Pacific and Danube salmon, including fillets (excluding offal) valued at US$503.6 million (31 thousand tonnes), and fresh/chilled Atlantic and Danube salmon valued at US$478.5 million (56 thousand tonnes) in 2022.
| HS Code | Description | 2018 | 2019 | 2020 | 2021 | 2022 | CAGR* % 2018-2022 |
|---|---|---|---|---|---|---|---|
| Total - fish and seafood | 6,172.2 | 5,984.1 | 6,078.4 | 6,088.5 | 6,490.7 | 1.3 | |
| 030475 | Frozen fillets of Alaska Pollack | 391.5 | 439.0 | 475.5 | 475.2 | 534.4 | 8.1 |
| 030541 | Smoked Pacific and Danube salmon, including fillets (excluding offal) | 647.3 | 549.0 | 538.4 | 479.1 | 503.6 | −6.1 |
| 030214 | Fresh or chilled Atlantic and Danube salmon | 475.3 | 446.6 | 361.4 | 407.5 | 478.5 | 0.2 |
| 160414 | Prepared or preserved tunas, skipjack and Atlantic bonito, whole or in pieces (excluding minced) | 462.2 | 359.5 | 472.6 | 367.8 | 460.5 | −0.1 |
| 030617 | Frozen shrimps and prawns, even smoked, whether in shell or not (excluding cold-water shrimps and prawns) | 369. | 328.6 | 368.6 | 384.5 | 437.9 | 4.4 |
| 030481 | Frozen fillets of Pacific and Danube salmon | 329.3 | 357.1 | 318.3 | 307.2 | 352.4 | 1.7 |
| 030441 | Fresh or chilled fillets of Pacific and Danube salmon | 230.2 | 200.9 | 249.3 | 253.8 | 344.2 | 10.6 |
| 160411 | Prepared or preserved salmon, whole or in pieces (excluding minced) | 124.1 | 177.1 | 242.8 | 261.1 | 239.7 | 17.9 |
| 030543 | Smoked trout, including fillets (excluding offal) | 226.8 | 266.6 | 295.2 | 251.3 | 234.4 | 0.8 |
| 160419 | Prepared or preserved fish, whole or in pieces (excluding minced, merely smoked, and salmon, herrings, sardines, sardinella, brisling or sprats, tunas, skipjack, bonito, mackerel, anchovies, eels and shark fins) | 225.2 | 227.6 | 212.8 | 222.5 | 222.1 | −0.3 |
|
Source: Global Trade Tracker, 2023 *CAGR: Compound Annual Growth Rate |
|||||||
| HS Code | Description | 2018 | 2019 | 2020 | 2021 | 2022 | CAGR* % 2018-2022 |
|---|---|---|---|---|---|---|---|
| Total - fish and seafood | 1,203.7 | 1,172.8 | 1,216.1 | 1,153.7 | 1,145.5 | 1.3 | |
| 030475 | Frozen fillets of Alaskan Pollack | 145.4 | 139.0 | 139.0 | 140.7 | 137.0 | 8.1 |
| 051191 | Products of fish or crustaceans, molluscs or other aquatic invertebrates; dead fish, crustaceans, molluscs or other aquatic invertebrates, unfit for human consumption | 86.3 | 99.4 | 110.4 | 119.3 | 120.2 | 8.4 |
| 160414 | Prepared or preserved tunas, skipjack and Atlantic bonito, whole or in pieces (excluding minced) | 92.2 | 79.6 | 105.4 | 78.2 | 94.4 | −0.1 |
| 230120 | Flours, meals and pellets of fish or crustaceans, molluscs or other aquatic invertebrates, unfit for human consumption | 100.1 | 93.6 | 96.6 | 78.2 | 87.1 | 1.6 |
| 030214 | Fresh or chilled Atlantic and Danube salmon | 59.0 | 60.8 | 53.9 | 55.2 | 56.0 | 0.2 |
| 160419 | Prepared or preserved fish, whole or in pieces (excluding minced, merely smoked, and salmon, herrings, sardines, sardinella, brisling or sprats, tunas, skipjack, bonito, mackerel, anchovies, eels and shark fins) | 50.4 | 49.6 | 44.5 | 46.2 | 45.5 | −0.3 |
| 160412 | Prepared/preserved herrings, whole or in pieces (excluding minced) | 45.8 | 43.8 | 48.2 | 44.6 | 45.5 | 2.4 |
| 030617 | Frozen shrimps and prawns, even smoked, whether in shell or not (excluding cold-water shrimps and prawns) | 34.2 | 34.1 | 37.9 | 35.8 | 39.9 | 4.4 |
| 030541 | Smoked Pacific and Danube salmon, including fillets (excluding offal) | 38.2 | 34.3 | 34.9 | 31.7 | 31.0 | −6.1 |
| 030481 | Frozen fillets of Pacific and Danube salmon | 31.9 | 33.9 | 31.5 | 30.5 | 30.5 | 1.7 |
|
Source: Global Trade Tracker, 2023 *CAGR: Compound Annual Growth Rate |
|||||||
| HS Code | Description | 2018 | 2019 | 2020 | 2021 | 2022 | CAGR* % 2018-2022 |
|---|---|---|---|---|---|---|---|
| Total - fish and seafood imports | 1,146.5 | 1,120.5 | 1,327.8 | 1,244.9 | 1,330.5 | 3.8 | |
| 030541 | Smoked Pacific and Danube salmon, including fillets (excluding offal) | 381.2 | 300.0 | 348.4 | 315.7 | 332.6 | −3.4 |
| 160411 | Prepared/preserved salmon (excluding minced) | 103.6 | 150.4 | 217.1 | 229.9 | 210.5 | 19.4 |
| 030441 | Fresh or chilled fillets of Pacific salmon | 92.3 | 99.4 | 160.0 | 137.6 | 182.6 | 18.6 |
|
Source: Global Trade Tracker, 2023 *CAGR: Compound Annual Growth Rate |
|||||||
| HS Code | Description | 2018 | 2019 | 2020 | 2021 | 2022 | CAGR* % 2018-2022 |
|---|---|---|---|---|---|---|---|
| Total - fish and seafood imports | 731.5 | 656.5 | 721.1 | 759.2 | 715.3 | −0.6 | |
| 160529 | Prepared/preserved shrimps and prawns, in airtight containers (excluding smoked) | 73.5 | 78.3 | 94.4 | 110.0 | 98.5 | 7.6 |
| 160414 | Prepared/preserved tunas, skipjack and Atlantic bonito, whole or in pieces (excluding minced) | 57.4 | 50.3 | 77.0 | 65.6 | 70.5 | 5.3 |
| 030617 | Frozen shrimps and prawns, even smoked, whether in shell or not (excluding cold-water shrimps and prawns) | 46.6 | 64.5 | 78.3 | 75.8 | 66.7 | 9.4 |
|
Source: Global Trade Tracker, 2023 *CAGR: Compound Annual Growth Rate |
|||||||
| HS Code | Description | 2018 | 2019 | 2020 | 2021 | 2022 | CAGR* % 2018-2022 |
|---|---|---|---|---|---|---|---|
| Total - fish and seafood imports | 636.0 | 570.8 | 474.3 | 527.4 | 638.4 | 0.1 | |
| 030214 | Fresh or chilled Atlantic and Danube salmon | 295.1 | 275.0 | 193.7 | 207.0 | 244.6 | −4.6 |
| 030441 | Fresh or chilled fillets of Pacific and Danube salmon | 36.3 | 41.5 | 38.7 | 40.7 | 90.6 | 25.7 |
| 030551 | Dried cod, even salted, not smoked (excluding fillets and offal) | 78.2 | 73.4 | 59.1 | 72.1 | 77.4 | −0.2 |
|
Source: Global Trade Tracker, 2023 *CAGR: Compound Annual Growth Rate |
|||||||
| HS Code | Description | 2018 | 2019 | 2020 | 2021 | 2022 | CAGR* % 2018-2022 |
|---|---|---|---|---|---|---|---|
| Total - fish and seafood imports | 549.5 | 559.8 | 520.2 | 526.0 | 512.9 | −1.7 | |
| 030214 | Fresh or chilled Atlantic and Danube salmon | 137.9 | 114.1 | 112.4 | 138.0 | 171.5 | 5.6 |
| 030481 | Frozen fillets of Pacific and Danube salmon | 23.4 | 68.5 | 81.1 | 570.0 | 68.3 | 30.7 |
| 030541 | Smoked Pacific and Danube salmon, including fillets (excluding offal) | 32.0 | 31.8 | 20.5 | 21.4 | 28.2 | −3.1 |
|
Source: Global Trade Tracker, 2023 *CAGR: Compound Annual Growth Rate |
|||||||
| HS Code | Description | 2018 | 2019 | 2020 | 2021 | 2022 | CAGR* % 2018-2022 |
|---|---|---|---|---|---|---|---|
| Total - fish and seafood imports | 431.2 | 532.3 | 437.4 | 402.3 | 500.5 | 3.8 | |
| 030475 | Frozen fillets of Alaskan Pollack | 180.8 | 240.5 | 231.5 | 216.5 | 287.5 | 12.3 |
| 030471 | Frozen fillets of cod | 90.3 | 113.5 | 70.5 | 56.3 | 64.9 | −7.9 |
| 030481 | Frozen fillets of Pacific and Danube salmon | 75.5 | 79.1 | 54.9 | 48.7 | 55.4 | −7.5 |
|
Source: Global Trade Tracker, 2023 *CAGR: Compound Annual Growth Rate |
|||||||
Canada's performance
In 2022, Canada was Germany's 38th largest supplier of fish and seafood. Germany's imports of fish and seafood products from Canada, registered a declined CAGR of 3.6% moving from US$25.0 million in 2018 to US$21.6 million in 2022. In volume terms, Germany's imports of fish and seafood from Canada decreased by a larger CAGR of 9.0% from 2,141.8 thousand tonnes in 2018 to 1,469.4 thousand tonnes in 2022.
Top fish and seafood imports from Canada in 2022, were both (whether in shell or not) frozen lobsters (even smoked) at US$6.8 million and live, fresh or chilled lobsters also, at US$6.8 million; frozen scallops and other molluscs of the family Pectinidae (even in shell) at US$1.2 million; other frozen fish fillets, n.e.s. at US$904.9 thousand; and prepared or preserved shrimps and prawns, in airtight containers (excluding smoked) at US$724.0 thousand.
| HS code | Description | 2018 | 2019 | 2020 | 2021 | 2022 | CAGR* % 2018-2022 |
|---|---|---|---|---|---|---|---|
| Total - fish and seafood imports | 25.0 | 22.0 | 20.7 | 24.6 | 21.6 | −3.6 | |
| 030612 | Frozen lobsters, even smoked, whether in shell or not | 5.3 | 4.5 | 4.4 | 5.2 | 6.8 | 6.5 |
| 030632 | Live, fresh or chilled lobsters, whether in shell or not | 8.6 | 8.0 | 3.7 | 8.0 | 6.8 | −5.8 |
| 030722 | Frozen scallops and other molluscs of the family Pectinidae, even in shell | 1.6 | 2.7 | 1.5 | 1.2 | 1.2 | −6.8 |
| 030489 | Frozen fish fillets, nowhere else specified | 0.704 | 0.655 | 0.579 | 0.634 | 0.905 | 6.5 |
| 160529 | Prepared or preserved shrimps and prawns, in airtight containers (excluding smoked) | 0.035 | 0.443 | 6.2 | 3.6 | 0.724 | 112.7 |
|
Source: Global Trade Tracker, 2023 *CAGR: Compound Annual Growth Rate |
|||||||
| HS code | Description | 2018 | 2019 | 2020 | 2021 | 2022 | CAGR* % 2018-2022 |
|---|---|---|---|---|---|---|---|
| Total - fish and seafood imports | 2,141.8 | 1,802.1 | 2,032.9 | 2,915.0 | 1,469.4 | −9.0 | |
| 030632 | Live, fresh or chilled lobsters, whether in shell or not | 433.5 | 407.9 | 187.7 | 316.2 | 290.6 | −9.5 |
| 030612 | Frozen lobsters, even smoked, whether in shell or not | 287.9 | 237.2 | 250.6 | 229.9 | 269.3 | −1.7 |
| 121229 | Fresh, chilled, frozen, grounded or dried seaweeds and other algae, unfit for human consumption | 163.2 | 232.5 | 226.1 | 196.7 | 146.5 | −2.7 |
| 030495 | Frozen meat of fish of the families bregmacerotidae, euclichthyidae, gadidae, macrouridae, melanonidae, merlucciidae, moridae and muraenolepididae, whether or not minced (excluding fillets and Alaska Pollack) | 179.4 | 342.6 | 130.4 | −14.7 | ||
| 030312 | Frozen Pacific salmon (excluding red sockeye salmon) | 21.9 | 33.0 | 3.1 | 21.9 | 110.9 | 50.0 |
|
Source: Global Trade Tracker, 2023 *CAGR: Compound Annual Growth Rate |
|||||||
Retail sales by category and distribution
Fish consumption trends vary widely across Germany's geographical locations, where there exist a strong north-south divide with cultural differences dependent upon the region. Germans from the north along the coastal regions (close to the North Sea and Baltic Sea) eat greater quantities of fish and prepare fish in specific ways not familiar to Germans in other areas of the country (that is, crab puffing, Bismarck rolls etc.). Meanwhile, in regions located further from the coast (ie; in Franconia, state of Bavaria) Germans have found specific ways of preparing carp, which is extremely popular and forms part of several other traditional dishes in the area.Footnote 1
In Germany, fish and seafood is widely regarded as healthy and consumers are willing to pay the price for higher quality meat. Although, fish and seafood consumption levels in Germany have remained stable over the years, Germany's overall per-capita consumption of fish/seafood is relatively small compared to other European (EU) countries: less than 13 kg per head/year (2021). Manufacturers often focus on the importance of having sustainability seals on German retail packaging such as MSC-certified (about 50% of all wild-caught fish sold in Germany contain this label) and ASC certification for aquaculture products. Other sustainability labels for wild fish include "Naturland Wildfish" and "Friends of the Sea"; as well as, the EU organic logo and GNN by Globalgap: "Dolphin save" and WWF logos.Footnote 2
In 2022, 97.3% of fresh fish and seafood products were non-organic over organic (2.7%) and 25.9% were supplied in unpackaged over packaged (74.1%) products. The most popular fish product types consumed in Germany in 2021 were preserves and marinades (28%: consisting of canned herring and marinades, tuna, sardines and mackerel), frozen fish (24%), crustaceans and molluscs (15%), fresh fish (13%), smoked fish (10%), fish salads (2%), and other fish products (9%).
| Categorization type | 2017 | 2018 | 2019 | 2020 | 2021 | 2022 |
|---|---|---|---|---|---|---|
| Packaged vs unpackaged | ||||||
| Packaged | 73.6 | 73.6 | 73.7 | 73.9 | 74.0 | 74.1 |
| Unpackaged | 26.5 | 26.4 | 26.3 | 26.0 | 26.0 | 25.9 |
| Organic vs non-organic | ||||||
| Organic | 2.3 | 2.4 | 2.5 | 2.6 | 2.6 | 2.7 |
| Non-organic | 97.7 | 97.6 | 97.5 | 97.4 | 97.4 | 97.3 |
| Source: Euromonitor International, 2023 | ||||||
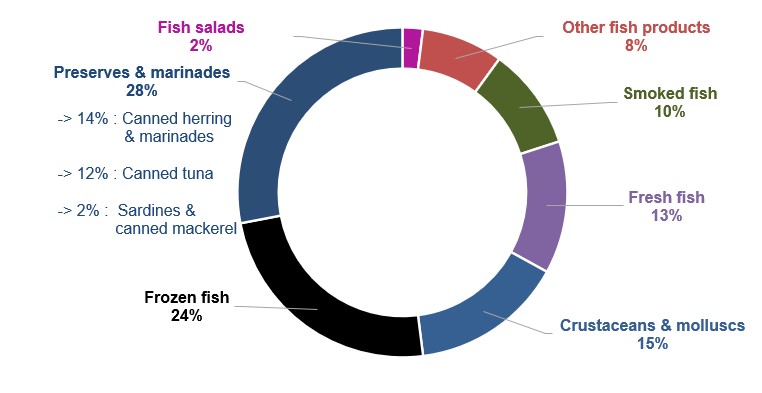
Description of above image
- Fish salads: 2%
- Other fish products: 8%
- Smoked fish: 10%
- Fresh fish: 13%
- Crustaceans and molluscs: 15%
- Frozen fish: 24%
- Preserves and marinades: 28%
- Canned herring and marinades: 14%
- Canned tuna: 12%
- Sardines and canned mackerel: 2%
Source: FIZ, Stand 2021
In 2022, retail sales of fresh fish and seafood registered a total value of US$4.7 billion (193.7 thousand tonnes). In value terms, in the fresh fish and seafood category, fish accounted for 68% of sales (US$3.2 billion), followed by 19.2% of crustaceans (US$904.2 million), and 12.8% of molluscs & cephalopods (US$603.4 million) in 2022. Although, volume sales in all fresh fish and seafood categories declined by a total of 1.9% in the 2021/ 2020 period, molluscs and cephalopods (−1.5%) and crustaceans (−0.7%) suffered the most due to COVID-19 in value terms - while fish increased in value by 1.6% over the same year. During the forecast period (2022-2027), however, fresh fish and seafood product value sales are expected to increase by a CAGR of 2.1%.
Meanwhile, retail sales of processed seafood totaled US$4.1 billion (380.5 thousand tonnes) in 2022. During this year, shelf stable processed seafood accounted for 47.9% of sales (US$2.0 billion), 35.7% of frozen seafood (US$1.5 billion), and 16.4% of chilled seafood products (US$680.9 million). With all processed seafood losing sales in volume terms (between −1.2% to −5.1%), the frozen seafood (−3.5%) and shelf stable (−0.2%) categories suffered the most over the 2021/2020 period - chilled seafood increased in value by 1.2% over the same year. During the forecast period, however, total processed seafood product sales are expected to increase by a CAGR of 3.5% (2022-2027).
| Category | 2017 | 2022 | CAGR* % 2017-2022 | 2023 | 2027 | CAGR* % 2022-2027 |
|---|---|---|---|---|---|---|
| Total - fresh fish and seafood | 201.5 | 193.7 | −0.8 | 193.0 | 189.2 | −0.5 |
| Crustaceans | 19.8 | 21.3 | 1.5 | 21.3 | 21.2 | −0.1 |
| Fish | 165.7 | 158.1 | −0.9 | 157.8 | 155.8 | −0.3 |
| Molluscs and cephalopods | 16.0 | 14.3 | −2.2 | 13.8 | 12.1 | −3.3 |
| Total - processed seafood[1] | 381.7 | 380.5 | −0.1 | 378.5 | 388.1 | 0.4 |
| Shelf stable seafood | 185.9 | 177.9 | −0.9 | 179.6 | 189.6 | 1.3 |
| Chilled seafood | 44.2 | 44.9 | 0.3 | 44.3 | 43.3 | −0.7 |
| Frozen seafood | 151.6 | 157.7 | 0.8 | 154.7 | 155.2 | −0.3 |
|
Source: Euromonitor, 2023 *CAGR: Compound Annual Growth Rate 1: Processed meat and seafood (as defined by Euromonitor International) - processed meat, processed seafood and meat substitutes (includes all types of chilled, frozen and shelf stable meat and fish substitutes such as vegetarian sausages, vegetarian burgers, bean burgers, vegetarian fish filets etc. typically made of quorn mycoprotein, tofu, soy or texturized vegetable protein). |
||||||
| Category | 2017 | 2018 | 2019 | 2020 | 2021 | 2022 |
|---|---|---|---|---|---|---|
| Total - fresh fish and seafood | 3,874.2 | 3,838.5 | 3,977.0 | 4,546.1 | 4,579.0 | 4,704.2 |
| Crustaceans | 735.6 | 738.8 | 793.2 | 928.0 | 921.7 | 904.2 |
| Fish | 2,553.9 | 2,510.8 | 2,674.8 | 3,022.6 | 3,070.8 | 3,196.7 |
| Molluscs and cephalopods | 584.7 | 588.9 | 509.0 | 595.5 | 586.6 | 603.4 |
| Total - processed seafood | 3,571.3 | 3,600.2 | 3,693.6 | 4,049.1 | 4,001.8 | 4,141.2 |
| Shelf stable seafood | 1,778.8 | 1,794.8 | 1,828.7 | 1,914.7 | 1,910.0 | 1,982.5 |
| Chilled seafood | 579.5 | 595.1 | 623.6 | 664.8 | 673.1 | 680.9 |
| Frozen seafood | 1,212.9 | 1,210.3 | 1,241.3 | 1,469.6 | 1,418.7 | 1,477.8 |
| Source: Euromonitor International, 2023 | ||||||
| Category | Annual growth % 2022/2021 | CAGR* % 2017-2022 | Total growth % 2017-2022 |
|---|---|---|---|
| Total - fish and seafood | 2.7 | 4.0 | 21.4 |
| Crustaceans | −1.9 | 4.2 | 22.9 |
| Fish | 4.1 | 4.6 | 25.2 |
| Molluscs and cephalopods | 2.9 | 0.6 | 3.2 |
| Total - processed seafood | 3.5 | 3.0 | 16.0 |
| Shelf stable seafood | 3.8 | 2.2 | 11.5 |
| Chilled seafood | 1.2 | 3.3 | 17.5 |
| Frozen seafood | 4.2 | 4.0 | 21.8 |
|
Source: Euromonitor International, 2023 *CAGR: Compound Annual Growth Rate |
|||
| Category | 2022 | 2023 | 2024 | 2025 | 2026 | 2027 |
|---|---|---|---|---|---|---|
| Total - fish and seafood | 4,704.2 | 4,766.5 | 4,915.1 | 5,025.0 | 5,120.8 | 5,212.3 |
| Crustaceans | 904.2 | 938.7 | 968.3 | 991.7 | 1,012.8 | 1,033.8 |
| Fish | 3,196.7 | 3,213.2 | 3,329.7 | 3,418.8 | 3,497.7 | 3,573.2 |
| Molluscs and cephalopods | 603.4 | 614.6 | 617.1 | 614.6 | 610.3 | 605.4 |
| Total - processed seafood | 4,141.2 | 4,342.7 | 4,518.8 | 4,662.5 | 4,787.8 | 4,910.0 |
| Shelf stable seafood | 1,982.5 | 2,100.3 | 2,206.0 | 2,289.8 | 2,359.7 | 2,422.0 |
| Chilled seafood | 680.9 | 715.9 | 731.0 | 743.9 | 756.6 | 770.6 |
| Frozen seafood | 1,477.8 | 1,526.5 | 1,581.8 | 1,628.7 | 1,671.4 | 1,717.4 |
| Source: Euromonitor International, 2023 | ||||||
| Category | Annual growth % 2023/2022 | CAGR* % 2022-2027 | Total growth % 2022-2027 |
|---|---|---|---|
| Total - fish and seafood | 1.3 | 2.1 | 10.8 |
| Crustaceans | 3.8 | 2.7 | 14.3 |
| Fish | 0.5 | 2.3 | 11.8 |
| Molluscs and cephalopods | 1.9 | 0.1 | 0.3 |
| Total - processed seafood | 4.9 | 3.5 | 18.6 |
| Shelf stable seafood | 5.9 | 4.1 | 22.2 |
| Chilled seafood | 5.1 | 2.5 | 13.2 |
| Frozen seafood | 3.3 | 3.1 | 16.2 |
|
Source: Euromonitor International, 2023 *CAGR: Compound Annual Growth Rate |
|||
In the frozen processed fish and seafood segment in 2022, fish fingers (29.8%) were the most popular categorization food type amongst German consumers, which registered the highest retail value in terms of retailer selling price (RSP). Following close behind, distributed quite evenly across the processed fish and seafood segment, also included coated fish fillets (24.4%), other processed fish fillets (23.5%), and seafood (19.8%) product types.
| Category | 2017 | 2018 | 2019 | 2020 | 2021 | 2022 |
|---|---|---|---|---|---|---|
| Coated fish fillets | 24.4 | 24.4 | 24.5 | 24.5 | 24.5 | 24.4 |
| Fish fingers | 30.1 | 29.9 | 29.8 | 29.9 | 29.7 | 29.8 |
| Other fish processed fillets | 23.1 | 23.2 | 23.3 | 23.4 | 23.4 | 23.5 |
| Seafood | 19.6 | 19.7 | 19.8 | 19.8 | 19.9 | 19.8 |
| Others | 2.8 | 2.8 | 2.8 | 2.5 | 2.5 | 2.5 |
| Total | 100.0 | 100.0 | 100.0 | 100.0 | 100.0 | 100.0 |
|
Source: Euromonitor International, 2023 |
||||||
As a result of the pandemic and the impact of subsequent restrictions on the daily lives of many Germans, fish sales in restaurants suffered immensely. Alternatively, take-away services such as snack bars that are particularly widespread in the northern regions in Germany were not as badly affected. Furthermore, with greater time spent in the home due to remote working, many Germans discovered their passion for cooking, especially during restaurant closure periods.Footnote 1
In 2022, retail sales of "processed meat, seafood, and alternative" meat products across various distribution channels in Germany were valued at US$17.4 billion, representing an increase in total growth of 18.8% from US$14.7 billion in 2017. Store-based retailing (grocery and non-grocery retailers) was the primary retail channel valued at US$17.0 billion through which processed meat, seafood and alternatives were distributed (97.6% market share) with grocery retailers, specifically discounters (US$9.0 billion), supermarkets (US$3.6 billion), hypermarkets (US$2.5 billion) and small local grocers (US$1.1 billion) being the largest outlet channels in 2022.
Non-store retailing (e-commerce) almost doubled since 2017 with a total growth of 47.8%, attaining retail sales of US$420.3 million in 2022 from US$284.3 million in 2017.
| Outlet Type | 2017 | 2022 | ||
|---|---|---|---|---|
| Value (US$M) | Share % | Value (US$M) | Share % | |
| Total - retail channels | 14,678.1 | 100.0 | 17,439.5 | 100.0 |
| Store-based retailing | 14,393.8 | 98.1 | 17,019.3 | 97.6 |
| Total - grocery retailers | 14,283.7 | 97.3 | 16,895.2 | 96.9 |
| Convenience stores | 5.9 | 0.0 | 11.2 | 0.1 |
| Discounters | 7,562.0 | 51.5 | 9,017.9 | 51.7 |
| Forecourt retailers | 505.3 | 3.4 | 586.2 | 3.4 |
| Hypermarkets | 2,235.8 | 15.2 | 2,514.1 | 14.4 |
| Supermarkets | 2,957.4 | 20.1 | 3,572.8 | 20.5 |
| Food/drink/tobacco specialists | 60.2 | 0.4 | 75.1 | 0.4 |
| Small local grocers | 957.1 | 6.5 | 1,117.8 | 6.4 |
| Total - non-grocery specialists (general merchandise stores) | 110.1 | 0.8 | 124.0 | 0.7 |
| Non-store retailing (e-commerce) | 284.3 | 1.9 | 420.3 | 2.4 |
| Source: Euromonitor International, 2023 | ||||
Competitive landscape
Major processors of both fresh and processed fish and seafood in Germany in 2021, were Deutsche See GmbH, Frosta AG, and Iglo GmbH.
In 2022, the processed seafood retail market in Germany was dominated by private labels at a sales value of US$2.1 billion (50.3%). Leading companies (brands) were Thai Union Frozen Products PCL (Hawesta, Rügen Fisch - Fish, John West) at sales of US$369.1 million (8.9%), followed by Nomad Foods Ltd. (Iglo) at US$350.7 million (8.5%), and Heristo AG (Appel) at US$273.2 million (6.6%) in 2022.
The Thai Union Frozen Products PCL company was the largest supplier for shelf stable seafood at a sales value of US$369.1 million (18.6% in the category) in 2022. Nomad Foods Ltd. (brand: Iglo) represented the highest sales in the frozen processed food category at sales of US$350.7 million (23.7%), while the Unternehmensgruppe (Group) Theo Müller Secs company (brands: Homann, Nadler) had the largest sales in the chilled processed seafood category at US$136.1 million (20.0%) over the same year.
| Category | Company | Top brand(s) | Retail sales (US$M) | Market share % in 2022 |
|---|---|---|---|---|
| Processed seafood | Thai Union Frozen Products PCL | Hawesta, Rügen Fisch (Fish), John West | 369.1 | 8.9 |
| Nomad Foods Ltd. | Iglo | 350.7 | 8.5 | |
| Heristo AG | Appel | 273.2 | 6.6 | |
| The Bolton Group | Saupiquet | 190.3 | 4.6 | |
| Bofrost Dienstleistungs GmbH & Co KG | Bofrost | 177.9 | 4.3 | |
| Private Label | Private Label | 2,082.4 | 50.3 | |
| Others | Others | 383.2 | 9.3 | |
| Total - processed seafood | 4,141.2 | 100.0 | ||
| Shelf stable seafood | Thai Union Frozen Products PCL | Hawesta, Rügen Fisch (Fish), John West | 369.1 | 18.6 |
| Heristo AG | Appel | 273.2 | 13.8 | |
| The Bolton Group | Saupiquet | 190.3 | 9.6 | |
| Private Label | Private Label | 915.3 | 46.2 | |
| Others | Others | 234.6 | 11.8 | |
| Total - shelf stable seafood | 1,982.5 | 100.0 | ||
| Chilled processed seafood | Unternehmensgruppe Theo Müller Secs | Homann, Nadler | 136.1 | 20.0 |
| Laschinger GmbH | Laschinger | 27.6 | 4.0 | |
| Gottfried Friedrichs KG | Friedrichs | 21.1 | 3.1 | |
| Private Label | Private Label | 402.9 | 59.2 | |
| Others | Others | 93.2 | 13.7 | |
| Total - chilled processed seafood | 680.9 | 100.0 | ||
| Frozen processed seafood | Nomad Foods Ltd. | Iglo | 350.7 | 23.7 |
| Bofrost Dienstleistungs GmbH & Co KG | Bofrost | 177.9 | 12.0 | |
| Frosta AG | Frosta | 45.7 | 3.1 | |
| Followfood GmbH | Followfish | 31.3 | 2.1 | |
| Apetito Convenience GmbH & Co KG | Costa | 29.3 | 2.0 | |
| Eismann Tiefkühl-Heimservice GmbH | Eismann | 23.4 | 1.6 | |
| Private | Private Label | 764.1 | 51.7 | |
| Others | Others | 55.4 | 3.7 | |
| Total - frozen processed seafood | 1,477.8 | 100.0 | ||
| Source: Euromonitor International, 2023 | ||||
New product launch and trend analysis
According to Mintel's Global New Products Database (GNPD), there were 3,115 new fish and fish products as an ingredient launched in Germany between January 2018 and February 22, 2023 (including new variety/range extension, packaging, formulation or relaunched). Of those fish products released, 2,543 were food products, 562 were pet products and 10 were released as a drink including beauty shots (hair, skin & nails), nutritional & meal replacement products that contain protein hydrolysate, hydrolysed marine collagen, fish oil and/or glucosamine sulphate (seafish, crustacean shellfish) as an ingredient.
Euromonitor - states that like most fish, salmon is mostly perceived and valued for its healthy image in Germany, especially as an alternative to pork or beef. Its high content of omega-3 fatty acids is widely known, especially amongst athletes or those who regularly participate in sports, and who often have special dietary requirements. Other popular types of fish in Germany include herring, tuna and trout, which are prepared in a wide variety of ways, such as boiled, smoked or fried.Footnote 1
In Mintel's database, salmon (total of 706) is the most popular ingredient found in these 3,115 new fish and fish products launched in the German market. Other popular fish or fish products as an ingredient over the five-year period, included prawns (311), tuna (281), fish fats (206), Pacific Pollack (192), and Herring (170).
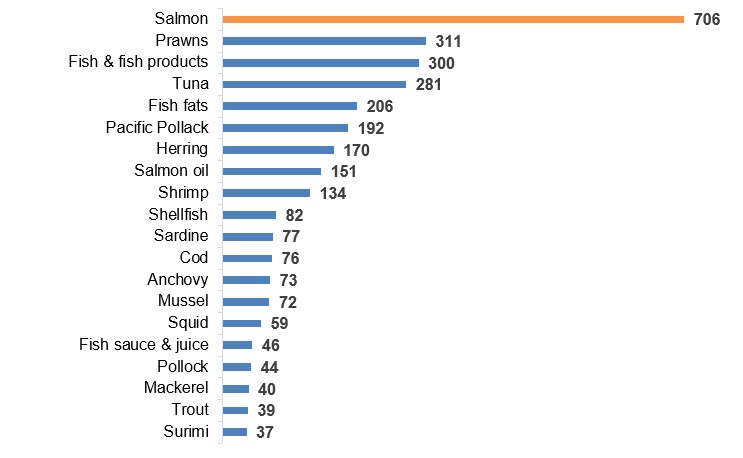
Description of above image
- Salmon: 706
- Prawns: 311
- Fish and fish products: 300
- Tuna: 281
- Fish fats: 206
- Pacific Pollack: 192
- Herring: 170
- Salmon oil: 151
- Shrimp: 134
- Shellfish: 82
- Sardine: 77
- Cod: 76
- Anchovy: 73
- Mussel: 72
- Squid: 59
- Fish sauce and juice: 46
- Pollock: 44
- Mackerel: 40
- Trout: 39
- Surimi: 37
Total item count: 3,115
Source: Mintel, 2023
Top parent companies who have recently launched new products in Germany over the last year (Q1-2022 to Q1-2023) were Lidl (99), REWE Group (51), Edeka Zentrale (50), Aldi Group (30), and Kaufland (22) for a variety of pet food, fish and fish products; along with Nestlé specifically for its tuna pizza, pet food, salmon cream sauce and infant milk products (28).
Top fish and fish product food brands over the five-year period included Deluxe (62), Ocean Sea (60), Fischerstolz (55), Bofrost (52), Costa (51), Eat Happy (45), Edeka Gut & Günstig (43), Grillmeister (42), Almare Seafood (41), and Deutsche See (36). Top pet food brands include ZooRoyal (11), DM Dein Bestes (10), K Classic/Favourites (5), Ja! (2), and Edeka (2).
The fastest growing ingredient flavours combined in these fish and fish products in Germany were duck (+100%), smoked - Beechwood (+100%), poultry (+100%), ginger (+100%), tomato (+66.7%), and lamb (+50%) between Q1-2021 and Q1-2023. New ingredients appearing in the market for the first time within the last twelve months included natmycin, raclette cheese, apple paste, croaker, ginger oil, ajvar, and ammonium sulfite. While top fish and seafood brands launched in the German market appearing for the first time within the last six months include Fishes Dathaco (Pangasius fillets), Thempa (tuna fillet snack for adult cats), Flying Goose Brand (original Sriracha prawn crackers), and Calvi (spicy tuna).
Popular claims and claim combinations used most often in the last 3 months included on packaging were ethical - sustainable (habitat/resources) at 60% of total products, environmentally friendly product (54.7%), environmentally friendly packaging (30.7%), ethical - recycling (14%) or ethical - animal (8.7%); no additives/preservatives (18.7%); premium (18%); economy (16%); pet - adult (12.7%); free from added/artificial colorings (12%) / flavorings (10%); ease of use (12%); organic (4.7%), high/added protein (3.3%), and all natural product (2.7%). Top growing claims (Q4-2021/Q4-2022) are prebiotic (+300%), functional pet - urinary (+100%), sugar free (+75%), economy (+37.5%), and time/speed (+33.3%). While declining claims over the same period by −100% included high/added fibre, children (5-12), low/no/reduced glycemic, added calcium, and GMO free.
In Germany, top growing categories amongst these fish and fish products included pet food (+15.4%) and processed fish, meat & egg products (+8.9%); while declining categories included side dishes (−100%), savory spreads (−87.5%), sauces & seasonings (−80%), snacks (−66.7%), and meals and meal centers (−20.8%) between Q4-2021 and Q4-2022.
| Product attributes | Yearly launch counts | Total | |||||
|---|---|---|---|---|---|---|---|
| 2018 | 2019 | 2020 | 2021 | 2022 | 2023 (January-February) | ||
| Yearly product launches | 547 | 608 | 645 | 525 | 692 | 98 | 3,115 |
| Top five sub-categories | |||||||
| Processed fish, meat and egg products | 309 | 334 | 357 | 274 | 379 | 55 | 1,708 |
| Pet food | 86 | 112 | 118 | 106 | 121 | 19 | 562 |
| Meals & meal centers | 66 | 74 | 80 | 63 | 93 | 10 | 386 |
| Baby food | 18 | 24 | 23 | 31 | 32 | 1 | 129 |
| Snacks | 22 | 29 | 16 | 17 | 32 | 4 | 120 |
| Top five claims | |||||||
| Ethical - Sustainable (Habitat/Resources) | 245 | 312 | 334 | 252 | 333 | 65 | 1,541 |
| Ethical - Environmentally Friendly Product | 240 | 299 | 317 | 243 | 315 | 59 | 1,473 |
| No Additives/Preservatives | 92 | 115 | 132 | 104 | 121 | 17 | 581 |
| Ethical - Environmentally Friendly Package | 45 | 71 | 116 | 114 | 192 | 30 | 568 |
| Premium | 77 | 92 | 99 | 71 | 104 | 13 | 456 |
| Imported status | |||||||
| Not imported | 115 | 90 | 89 | 73 | 71 | 10 | 448 |
| Imported | 48 | 65 | 61 | 55 | 50 | 6 | 285 |
| Top packaged types | |||||||
| Flexible/stand-up pouch or sachet | 168 | 185 | 226 | 169 | 271 | 35 | 1,054 |
| Tray | 152 | 180 | 139 | 113 | 147 | 13 | 744 |
| Can | 76 | 72 | 74 | 66 | 70 | 16 | 374 |
| Skinpack | 26 | 51 | 39 | 40 | 73 | 11 | 240 |
| Carton | 35 | 39 | 62 | 51 | 39 | 10 | 236 |
| Top launch types | |||||||
| New variety/range extension | 266 | 267 | 292 | 175 | 263 | 38 | 1,301 |
| New packaging | 131 | 134 | 171 | 179 | 252 | 37 | 904 |
| New product | 119 | 144 | 122 | 118 | 125 | 15 | 643 |
| Relaunch | 29 | 60 | 57 | 52 | 52 | 8 | 258 |
| New formulation | 2 | 3 | 3 | 1 | 0 | 0 | 9 |
| Top five flavours (including blend) | |||||||
| Unflavoured/plain | 169 | 160 | 175 | 160 | 237 | 23 | 924 |
| Smoke | 28 | 45 | 38 | 29 | 36 | 6 | 182 |
| Salmon | 25 | 26 | 27 | 37 | 50 | 7 | 172 |
| Tuna | 12 | 12 | 20 | 14 | 22 | 8 | 88 |
| Chicken | 9 | 8 | 13 | 18 | 18 | 3 | 69 |
| Top five ingredients | |||||||
| Salmon | 124 | 158 | 148 | 107 | 148 | 21 | 706 |
| Prawn | 58 | 72 | 76 | 34 | 65 | 6 | 311 |
| Fish and fish products | 60 | 56 | 60 | 56 | 55 | 13 | 300 |
| Tuna | 45 | 54 | 71 | 44 | 57 | 10 | 281 |
| Fish fats | 30 | 32 | 51 | 44 | 46 | 3 | 206 |
| Source: Mintel, 2023 | |||||||
Examples of new product launches
Filled Puff Pastry Canapés
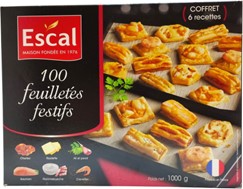
Source: Mintel, 2023
| Company | Escal |
|---|---|
| Brand | Escal |
| Category | Snacks, hors d'oeuvres / canapés |
| Market | Germany, imported from France |
| Store name | Kaufland, Bochum 44809 |
| Store type | Mass merchandise / hypermarket |
| Claims | Ease of use |
| Date published | February 2023 |
| Launch type | New variety / range extension |
| Price in US dollars | 9.76 |
This oven-ready, fine, yet crispy product retails in a 1,000 gram pack containing about 100 units of six varieties, including:
- chorizo
- raclette
- fine herbs with garlic and parsley
- salmon
- Flammkuchen
- and prawns/shrimp
Smoked Salmon
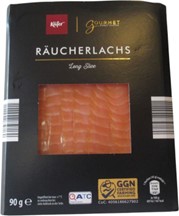
Source: Mintel, 2023
| Company | Aldi Süd |
|---|---|
| Manufacturer | Arctic Seafood |
| Brand | Käfer Gourmet Finest Cuisine |
| Category | Processed fish products |
| Market | Germany, imported from Poland |
| Store name | Aldi Sud, Stuttgart 70197 |
| Store type | Supermarket |
| Claims | Premium, ethical – environmentally friendly, sustainable |
| Date published | January 2023 |
| Launch type | Relaunch |
| Price in US dollars | 3.18 |
This product has been relaunched under a new brand name, having been previously known under the Käfer Feinkost, and retails in a newly designed 90 gram pack. Long sliced, cold smoked salmon and dry salted. GGN Certified Farming.
Tuna Fillets in Sunflower Oil
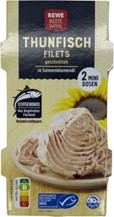
Source: Mintel, 2023
| Company | REWE Markt |
|---|---|
| Manufacturer | World Wise Foods |
| Brand | Rewe Beste Wahl |
| Category | Processed fish product |
| Market | Germany, imported from Thailand |
| Store name | REWE, Oldenburg 26123 |
| Store type | Supermarket |
| Claims | Ethical – environmentally friendly, animal, sustainable |
| Date published | January 2023 |
| Launch type | New packaging |
| Price in US dollars | 2.45 |
This product has been repackaged, and retails in a 160 gram pack containing two 80 gram mini units. Contains real bonito sliced tuna fillets in sunflower oil. Scores a B on the Nutri-Score and is a Bonito tuna (Katsuwonus Pelamis) caught in the west Indian ocean. This tuna was caught with hand-held rods according to centuries of old traditional craftsmanship. This fishing method is extremely selective and avoids by-catch, so it is gentle and conserves stocks. Logos and certifications: MSC (Marine Stewardship Council) - Certified Sustainable Seafood, Dolphin Safe.
Original Sriracha Prawn Crackers
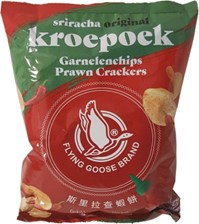
Source: Mintel, 2023
| Company | Heuschen & Schrouff |
|---|---|
| Distributor | Heuschen & Schrouff |
| Brand | Flying Goose Brand |
| Category | Snacks, cassava and other root-based |
| Market | Germany, imported from Netherlands |
| Store name | REWE, Hamberg 20095 |
| Store type | Supermarket |
| Date published | February 2023 |
| Launch type | New product |
| Price in US dollars | 2.16 |
This product retails in an 80 gram pack. These prawn crackers with chilli are fried in sunflower oil.
Whole Cooked Lobster
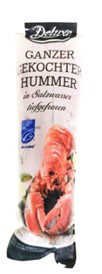
Source: Mintel, 2023
| Company | Lidl |
|---|---|
| Brand | Deluxe |
| Category | Processed fish products |
| Market | Germany, imported from Canada |
| Store name | Lidl, Dresden 01109 |
| Store type | Supermarket |
| Claims | Premium, ethical – environmentally friendly, sustainable |
| Date published | February 2021 |
| Launch type | New packaging |
| Price in US dollars | 9.37 |
This product has been repackaged. It has been frozen in salt water, and retails in a newly designed 325 gram pack bearing the MSC (Marine Stewardship Council) - Certified Sustainable Seafood logo.
Opportunities for Canada
In 2022, Germany was the 8th largest import market (3.2% market value share) for fish and seafood in the world at a value of US$5.8 billion (1,034.1 thousand tonnes). Canada was Germany's 38th largest supplier of fish and seafood products, representing a 0.3% market value share at US$18.7 million (1.3 thousand tonnes) over the same period. Top fish and seafood imports from Canada were frozen, live, fresh or chilled lobsters, even smoked (whether in shell or not); frozen scallops and other molluscs of the family Pectinidae (even in shell); frozen fish fillets; and prepared or preserved shrimps and prawns, in airtight containers (excluding smoked).
There remains substantial opportunity for Canada to increase its presence in the German market as suppliers of safe and high-quality, value-added processed fish and seafood products. Fish and seafood in Germany offers a plethora of options. Much the same over the last decade, the most popular fish species consumed in Germany in 2021 included salmon (18%), Alaska Pollack (17.4%), tuna (13.3%), herring (11.1%), and prawns (8.7%).Footnote 3
New meat and fish alternatives in Germany continues to gain in popularity. Although, the fish alternative segment still remains a niche category in contrast to new meat products, this new market has potential to gain share of consumers away from fresh traditional fish in the future and Canadian manufacturers could therefore consider how to address this competition. Furthermore, even though Germans are traditionally not particularly changeable in terms of consumption patterns, they are showing a greater willingness to try new products. It is also conceivable that critical arguments and topics around the sustainability of fishing and fish farming, including issues that address conservation, environmental protection and the climate crisis will intensify over the forecast period and are likely to become increasingly important in the coming years.Footnote 1
About CETA, The Comprehensive Economic and Trade Agreement (CETA).
With CETA, 98% of EU tariff lines are now duty-free for Canadian goods, and an additional 1% will be eliminated over seven years. Tariff elimination provides enhanced export opportunities into the EU market for Canadian producers, processors, and manufacturers, as well as for agricultural and agri-food products, fish and seafood, forestry goods, and the full range of industrial goods.
How does CETA benefit Canadian fish and seafood exporters? (Global Affairs Canada, 2021)
- Under CETA, almost 96% of EU tariff lines for fish and seafood products have become duty-free. 100% of these tariff lines will be duty-free after seven years.
- Before the CETA, EU tariffs for fish and seafood averaged 11% and could be as high as 25%.
For more information, please visit Opportunities and Benefits of CETA for Canada's Fish and Seafood Exporters.
In addition, please consult the Canada Tariff Finder to explore tariff information for the CETA market, and other countries with which Canada has a free trade agreement.
For more information
The Canadian Trade Commissioner Service:
International Trade Commissioners can provide Canadian industry with on-the-ground expertise regarding market potential, current conditions and local business contacts, and are an excellent point of contact for export advice.
More agri-food market intelligence:
International agri-food market intelligence
Discover global agriculture and food opportunities, the complete library of Global Analysis reports, market trends and forecasts, and information on Canada's free trade agreements.
Agri-food market intelligence service
Canadian agri-food and seafood businesses can take advantage of a customized service of reports and analysis, and join our email subscription service to have the latest reports delivered directly to their inbox.
More on Canada's agriculture and agri-food sectors:
Canada's agriculture sectors
Information on the agriculture industry by sector. Data on international markets. Initiatives to support awareness of the industry in Canada. How the department engages with the industry.
For additional information on the Seafood Expo Global 2023 in Barcelona, Spain (April 25 to 27) contact:
Ben Berry, Deputy Director
Trade Show Strategy and Delivery
Agriculture and agri-food Canada
ben.berry@agr.gc.ca
Resources
- Euromonitor International | January 2022. Country Report: Fish and seafood in Germany
- FIZ, Stand. Infographics: Fish Market Favorites, 2021 (in German only)
- FIZ, Stand. Infographics: The most popular fish products, 2021
- Global Affairs Canada, Opportunities and Benefits of CETA for Canada's Fish and Seafood Exporters
- Global Affairs Canada, About CETA
- Global Trade Tracker, 2023
- Mintel Global New Products Database, 2023
- Trade Commissioners Service: Germany | March 2023
- Trade Commissioner Service. Brexit: Information for Canadian companies
Sector Trend Analysis – Fish and seafood in Germany
Global Analysis Report
Prepared by: Erin-Ann Chauvin, Senior Market Analyst
© His Majesty the King in Right of Canada, represented by the Minister of Agriculture and Agri-Food (2023).
Photo credits
All photographs reproduced in this publication are used by permission of the rights holders.
All images, unless otherwise noted, are copyright His Majesty the King in Right of Canada.
To join our distribution list or to suggest additional report topics or markets, please contact:
Agriculture and Agri-Food Canada, Global Analysis1341 Baseline Rd, Tower 5, 3rd floor
Ottawa ON K1A 0C5
Canada
Email: aafc.mas-sam.aac@agr.gc.ca
The Government of Canada has prepared this report based on primary and secondary sources of information. Although every effort has been made to ensure that the information is accurate, Agriculture and Agri-Food Canada (AAFC) assumes no liability for any actions taken based on the information contained herein.
Reproduction or redistribution of this document, in whole or in part, must include acknowledgement of agriculture and agri-food Canada as the owner of the copyright in the document, through a reference citing AAFC, the title of the document and the year. Where the reproduction or redistribution includes data from this document, it must also include an acknowledgement of the specific data source(s), as noted in this document.
Agriculture and Agri-Food Canada provides this document and other report services to agriculture and food industry clients free of charge.