
The Canadian grain and oilseed milling industry, North American Industry Classification System (NAICS) 3112, comprises establishments that are primarily engaged in milling grains and oilseeds, refining and blending fats and oils, and making breakfast cereal products.
Significance
The grain and oilseed milling industry is a critical element of the food supply chain. Milling and crushing companies convert grain into food ingredients that often go to secondary processors, such as bakery or snack food manufacturers that produce finished goods to be sold through retail or delivered to consumers through other channels. Canada’s canola crushing sector has experienced prominent growth, with capacity doubling in the last decade.
Structure
In 2012, 204 establishments were operating in Canada with the majority in Ontario (61), Quebec (48), and Alberta (24). In the same year, the industry generated revenues of $9.8 billion and employed over 8,900 people. Canada is a net exporter of milled grain and oilseed products, exporting $5.9 billion and importing $3.5 billion in 2014. The United States accounts for 79% of exports and the majority of imports come from the United States (74%), followed by Italy, Malaysia, Thailand, and India.
Description of the above image
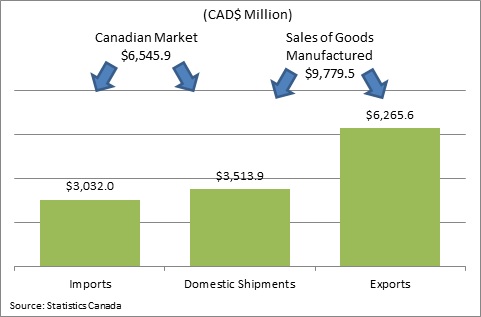
The following figures are in millions of Canadian dollars.
| Imports | 3,032.00 |
|---|---|
| Exports | 6,265.60 |
| Domestic shipments | 3,513.90 |
| Canadian market (imports and domestic shipments) | 6,545.90 |
| Sales of goods manufactured (exports and domestic shipments) | 9,779.50 |
Source: Statistics Canada
Performance
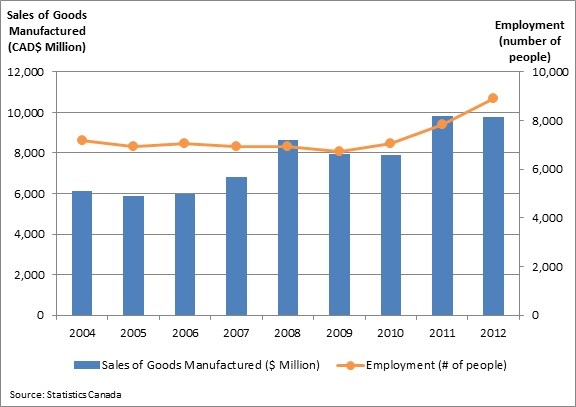
Between 2004 and 2012, sales of goods manufactured by the Canadian grain and oilseed milling industry increased 59.8% from $6.1 billion to $9.8 billion. Over the same period, exports of grain and oilseed milling products grew at an average annual rate of 12.4% and imports experienced an average annual growth rate of 5.6%. Imports as a percentage of the domestic market increased steadily from 34.9% in 2004 to 46.3% in 2012, while direct employment grew from 7,182 employees to 8,924 employees.
Description of the above image
| 2004 | 2005 | 2006 | 2007 | 2008 | 2009 | 2010 | 2011 | 2012 | |
|---|---|---|---|---|---|---|---|---|---|
| Sales of goods manufactured (in millions of Canadian dollars) | 6,118.27 | 5,875.19 | 5,974.64 | 6,815.86 | 8,661.67 | 7,971.26 | 7,878.20 | 9,842.62 | 9,779.52 |
| Employment (number of people) | 7,182 | 6,933 | 7,058 | 6,941 | 6,951 | 6,714 | 7,042 | 7,849 | 8,924 |
Source: Statistics Canada
Note: The manufacturing statistics cited in this profile are taken from Statistics Canada’s Annual Survey of Manufactures and Logging, which lags behind the current date by at least 2 years.
Grain and oilseed milling, 2004-2013
| Principal statistics [a] | 2004 | 2005 | 2006 | 2007 | 2008 | 2009 | 2010 | 2011 | 2012 | 2012/11 | AAG [b]
2007-12 |
|---|---|---|---|---|---|---|---|---|---|---|---|
| Employment total (number of employees) | 7,182 | 6,933 | 7,058 | 6,941 | 6,951 | 6,714 | 7,042 | 7,849 | 8,924 | 13.7% | 5.2% |
| Employment – production (number of employees) | 5,622 | 5,405 | 5,541 | 5,598 | 5,483 | 5,282 | 5,549 | 6,156 | 6,966 | 13.2% | 4.5% |
| Employment - administration (number of employees) | 1,560 | 1,528 | 1,517 | 1,343 | 1,468 | 1,432 | 1,493 | 1,693 | 1,958 | 15.7% | 7.8% |
| Total revenue (millions $) | 6,668 | 6,441 | 6,471 | 7,340 | 9,320 | 8,795 | 8,530 | 10,557 | 10,548 | −0.1% | 7.5% |
| Revenue from goods manufactured (millions $) | 6,118 | 5,875 | 5,975 | 6,816 | 8,662 | 7,971 | 7,878 | 9,843 | 9,780 | −0.6% | 7.5% |
| Value-added, goods manufactured (millions $) | 1,588 | 1,704 | 1,890 | 2,043 | 2,233 | 2,021 | 2,059 | 2,228 | 2,474 | 11.0% | 3.9% |
| Value-added/worker, goods manufactured (millions $) | 0.28 | 0.32 | 0.34 | 0.36 | 0.41 | 0.38 | 0.37 | 0.36 | 0.36 | −1.9% | |
| Value-added as % of revenue from goods manufactured | 26.0% | 29.0% | 31.6% | 30.0% | 25.8% | 25.4% | 26.1% | 22.6% | 25.3% | ||
| Domestic market (millions $) | 5,615 | 5,691 | 5,665 | 6,332 | 7,324 | 7,301 | 6,346 | 6,976 | 6,546 | −6.2% | 0.7% |
| Domestic penetration | 65.1% | 66.8% | 65.6% | 64.4% | 62.9% | 60.1% | 58.0% | 61.4% | 53.7% | ||
|
Note:
|
|||||||||||
| Global trade statistics [a] | 2004 | 2005 | 2006 | 2007 | 2008 | 2009 | 2010 | 2011 | 2012 | 2013 | 2013/12 | AAG [b]
2008-13 |
|---|---|---|---|---|---|---|---|---|---|---|---|---|
| Exports (millions $) | 2,465.0 | 2,072.1 | 2,261.0 | 2,736.3 | 4,057.3 | 3,585.6 | 4,200.2 | 5,560.1 | 6,265.6 | 5,965.0 | −4.8% | 8.0% |
| Exports as % of revenue from goods manufactured | 40.3% | 35.3% | 37.8% | 40.1% | 46.8% | 45.0% | 53.3% | 56.5% | 64.1% | |||
| Imports (millions $) | 1,961.3 | 1,888.0 | 1,951.0 | 2,252.7 | 2,719.7 | 2,915.3 | 2,668.5 | 2,693.5 | 3,032.0 | 3,156.0 | 4.1% | 3.0% |
| Imports as % of domestic market | 34.9% | 33.2% | 34.4% | 35.6% | 37.1% | 39.9% | 42.0% | 38.6% | 46.3% | |||
| Balance of trade (millions $) | 503.7 | 184.1 | 310.0 | 483.5 | 1,337.6 | 670.2 | 1,531.7 | 2,866.5 | 3,233.6 | 2,809.0 | −13.1% | 16.0% |
|
Note:
|
||||||||||||
| Trade statistics with the United States [a] | 2004 | 2005 | 2006 | 2007 | 2008 | 2009 | 2010 | 2011 | 2012 | 2013 | 2013/12 | AAG [b]
2008-13 |
|---|---|---|---|---|---|---|---|---|---|---|---|---|
| Exports (millions $) | 1,715.8 | 1,508.4 | 1,644.8 | 1,982.2 | 3,197.7 | 2,665.2 | 2,561.7 | 3,842.2 | 4,172.9 | 4,304.6 | 3.2% | 6.1% |
| Imports (millions $) | 1,600.3 | 1,478.7 | 1,503.9 | 1,742.2 | 2,059.4 | 2,282.9 | 2,034.8 | 2,018.2 | 2,343.1 | 2,402.0 | 2.5% | 3.1% |
| Balance of trade (millions $) | 115.5 | 29.7 | 140.9 | 240.1 | 1,138.2 | 382.3 | 526.8 | 1,824.0 | 1,829.8 | 1,902.6 | 4.0% | 10.8% |
|
Note:
|
||||||||||||
Contact us
For more information about Canada's food industry, read Significance of the Food and Beverage Processing Industry in Canada or contact the Sector Development and Analysis Directorate at aafc.sdad-ddas.aac@agr.gc.ca.