
Statement outlining results, risks and significant changes in operations, personnel and programs
Introduction
Agriculture and Agri-Food Canada’s Quarterly Financial Report should be read in conjunction with the Main Estimates. This report has been prepared as required by section 65.1 of the Financial Administration Act and in the form and manner prescribed by the Treasury Board. As such, it has not been subject to an external audit or review.
Detailed information on Agriculture and Agri-Food Canada’s program activities can be found in the Departmental Plan.
Basis of Presentation
This quarterly report has been prepared using an expenditure basis of accounting. The accompanying Statement of Authorities includes the Department's spending authorities granted by Parliament and those used by the Department consistent with the Main Estimates for the 2018-2019 fiscal year. This quarterly report has been prepared using a special purpose financial reporting framework designed to meet financial information needs with respect to the use of spending authorities.
The authority of Parliament is required before monies can be spent by the Government. Approvals are given in the form of annually approved limits through appropriation acts or through legislation in the form of statutory spending authority for specific purposes.
The Department uses the full accrual method of accounting to prepare and present its annual departmental financial statements that are part of the departmental performance reporting process. However, the spending authorities voted by Parliament remain on an expenditure basis.
Highlights of fiscal quarter and fiscal year-to-date (YTD) results
Authorities
Agriculture and Agri-Food Canada’s Quarterly Financial Report reflects the results of the 2018-2019 fiscal period ending December 31, 2018, for which full supply of Main Estimates was released on June 22, 2018 and Supplementary Estimates (A) was released on December 13, 2018.
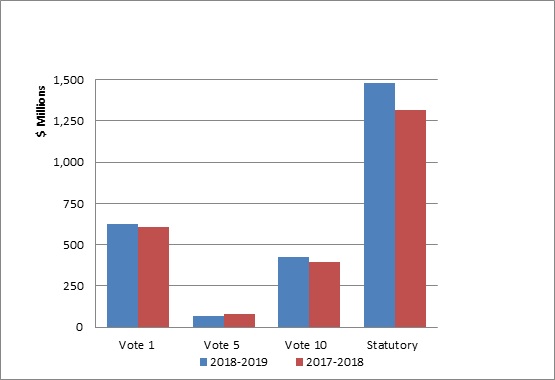
At the end of the third quarter of 2018-2019, Agriculture and Agri-Food Canada had total funding available for use of $2,597.9 million as detailed in Table 1. This amount includes the 2018-2019 Main Estimates of $2,516.0 million, the 2018-2019 Supplementary Estimates (A) of $30.3 million, $28.1 million of Operating Budget Carry Forward from 2017-2018, $11.9 million related to proceeds collected from the sale of Crown assets, $9.6 million of Capital Budget Carry Forward from 2017-2018, and $2.0 million for compensation adjustments. The net increase of $201.2 million compared to total authorities at the same time in fiscal year 2017-2018 is due to increases in Budgetary Statutory authorities, Vote 10 Grants and Contributions and Vote 1 Net Operating authorities, partially offset by decreases in Vote 5 Capital authorities.
Vote 1 Net Operating authorities as of December 31, 2018 totalled $622.4 million, an increase of $15.8 million from the December 31, 2017 amount of $606.7 million. This increase is mainly due to a $10.0 million increase in funding for the transfer of Federal Canal Infrastructure to the Government of Saskatchewan, and a $5.1 million increase in funding for the Advancing Agricultural Discovery Science and Innovation Program.
Vote 5 Capital authorities at the end of the third quarter of 2018-2019 totalled $68.9 million, a decrease of $8.9 million from the December 31, 2017 amount of $77.8 million. This decrease is primarily due to a reduction of $16.4 million with the winding down of the Budget 2016 Federal Infrastructure Initiatives and a decrease of $2.5 million in reinvestment of revenues from the sales or transfers of real properties, partially offset by an increase of $9.6 million for the 2017-2018 Capital Budget Carry Forward.
Vote 10 Grants and Contributions authority of $426.6 million as of December 31, 2018 reflects an increase of $31.9 million from $394.8 million at the same time in 2017-2018. This is primarily due to new funding of $51.0 million to implement the Dairy Farm Investment Program and the Dairy Processing Investment Fund, increased funding of $4.5 million for the Agricultural Clean Technology Program and $4.5 million for the Canadian Agricultural Adaptation Program. This is partially offset by a decrease of $28.2 million in the Canadian Agricultural Partnership compared to Growing Forward 2 in 2017-2018 which included unspent funding that had been carried forward from 2016-2017, as well as less funding in the AgriRisk program.
Budgetary Statutory authorities available as of December 31, 2018 were $1,479.9 million, an increase of $162.4 million from the December 31, 2017 amount of $1,317.5 million. This is mainly due to a $163.9 million forecast increase in AgriStability spending based on market conditions.
| Authorities | 2018-2019 | 2017-2018 | Variances | Percent |
|---|---|---|---|---|
| Vote 1 - Net Operating expenditures | 622,433 | 606,655 | 15,778 | 3% |
| Vote 5 - Capital expenditures | 68,942 | 77,817 | (8,875) | (11%) |
| Vote 10 - Grants and Contributions | 426,625 | 394,758 | 31,867 | 8% |
| Budgetary statutory authorities | 1,479,857 | 1,317,462 | 162,395 | 12% |
| Total Authorities | 2,597,857 | 2,396,692 | 201,165 | 8% |
| [1] Totals may not add due to rounding. | ||||
Expenditures
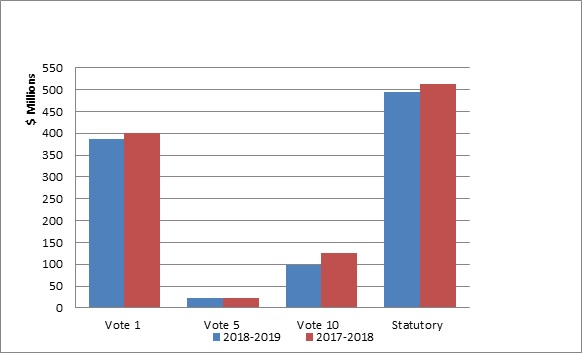
As detailed in Table 2, at the end of the third quarter of 2018-2019, the Department had spent $1,001.2 million, compared to $1,061.8 million in the same period in fiscal year 2017-2018, a decrease of $60.6 million, in Voted and Statutory Grants and Contributions, and Vote 1 Operating.
Vote 1 Net Operating expenditures at the end of the third quarter were $386.0 million, 62% of the total available for use of $622.4 million, which is less than expenditures of $400.4 million or 66% of the total available for the same period last fiscal year. The overall decrease of $14.4 million is due to decreased retroactive salary payments of $23.4 million, partially offset by a $9.5 million increase in salary expenditure due to an increase in Full Time Equivalents (FTEs) and higher salary rates as a result of the collective bargaining agreements.
Vote 5 Capital expenditures at the end of the third quarter were $22.9 million or 33% of the total available for use of $68.9 million. For the same period in 2017-2018, expenditures were $22.7 million or 29% of the budget of $77.8 million.
Vote 10 Grants and Contributions expenditures at the end of the third quarter of 2018-2019 were $98.5 million or 23% of the total available for use of $426.6 million, compared to $126.6 million, or 32% of the total available for use for the same period last fiscal year. The decrease of $28.1 million is mainly attributed to a $61.6 million decrease in program spending due to the first year implementation of the Canadian Agricultural Partnership. This decrease is partially offset by a $32.7 million increase in spending in support of the implementation of the Dairy Farm Investment Program and the Dairy Processing Investment Fund.
Budgetary Statutory Authorities expenditures at the end of the third quarter of 2018-2019 were $493.8 million compared to $512.0 million for the same period of the previous year. The $18.2 million decrease is attributed to several offsetting factors: $18.4 million decrease in the AgriInsurance Program due to timing, frequency, and materiality of claims received, and $7.6 million increase in recoveries under the Assistance to the Pork Industry Initiative, partially offset by an increase of $2.7 million in spending of the AgriInvest program, $2.5 million increase in Payments in connection with the Agricultural Marketing Programs Act, and $2.1 million increase in contributions to Employee Benefit Plans.
| Expenditures | 2018-2019 | 2017-2018 | Variance | Percent |
|---|---|---|---|---|
| Vote 1 - Net Operating expenditures | 385,994 | 400,418 | (14,424) | (4%) |
| Vote 5 - Capital expenditures | 22,856 | 22,716 | 140 | 1% |
| Vote 10 - Grants and Contributions expenditures | 98,501 | 126,633 | (28,132) | (22%) |
| Budgetary statutory expenditures | 493,809 | 512,035 | (18,226) | (4%) |
| Total Net Budgetary Expenditures | 1,001,160 | 1,061,802 | (60,642) | (6%) |
| [1] Totals may not add due to rounding. | ||||
Expenditures in Comparison to Authorities
At the end of the third quarter of 2018-2019, the Department had spent $1,001,2 million (39% of the total funding available for use), compared to $1,061.8 million for the same period in fiscal year 2017-2018 (44% of the total funding available for use).
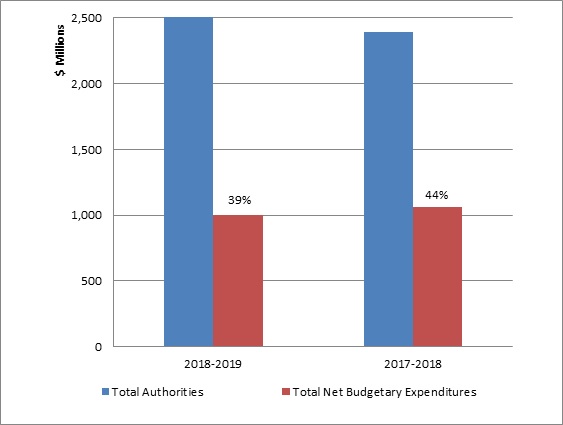
Table 3 presents budgetary expenditures by standard object. Total net budgetary expenditures by standard object have decreased by $60.6 million in the first three quarters of 2018-2019 compared to the same period last year. The decrease of $49.7 million or 8% in Transfer payments is mainly caused by a $61.6 million decrease in program spending due to the first year of Canadian Agricultural Partnership implementation, a decrease of $18.4 million in the AgriInsurance Program due to timing, frequency, and materiality of claims received, and an increase in recoveries of $7.6 million under the Assistance to the Pork Industry Initiative. These decreases are partially offset by a $32.7 million increase in spending in support of the implementation of the Dairy Farm Investment Program and the Dairy Processing Investment Fund, a $2.7 million increase in AgriInvest Program, and a $2.5 million increase in spending in connection with the Agricultural Marketing Programs Act.
The decrease of $12.9 million or 3% in Personnel is primarily attributed to the $23.4 million decrease in salary retroactive payments for employees, and partially offset by $9.5 million increase in salary expenditure due to an increase in Full Time Equivalents (FTEs) and higher salary rates as a result of the collective bargaining agreements.
The decrease of $4.4 million or 7% in Professional and Special Services is mainly attributed to a decrease of $3.3 million in Information technology service expenditures, and a decrease of $2.0 million due to the Natural Sciences and Engineering Research Council Visiting Fellows Program which is phasing out, as well as decreased expenditures from various professional services, partially offset by an increase of $2.1 million in the Information Technology consulting services.
Agriculture and Agri-Food Canada has total Revenue Spending authority of up to $57.1 million for 2018-2019. The revenue is generated from collaborative research agreements between Agriculture and Agri-Food Canada and third parties, recoveries for costs related to Internal Support Services provided to other departments and the administration of the AgriStability Program. The Department has generated $40.3 million in revenues up to the third quarter of 2018-2019 compared to $46.3 million for the same period last year. The $6.0 million revenue decrease is primarily attributed to a $6.1 million decrease in revenue for the Community Pastures Program which is being wound down, a $3.1 million decrease due to the timing of invoicing and collections from other Government Departments related to Human Resources, Information Management, and Information Technology services, and a $1.0 million decrease associated with Industry led projects due to timing differences associated with signing new collaborative research agreements for the new Canadian Agricultural Partnership. These decreases are partially offset by a $3.5 million increase in recoveries for Financial Management IT services provided to Canadian Nuclear Safety Commission, who have joined Agriculture and Agri-Food Canada’s financial system (SAP) cluster. Currently there is over $3.0 million in other Government Departments’ cost recoveries in progress.
| Expenditures | 2018-2019 | 2017-2018 | Variances | Percent |
|---|---|---|---|---|
| Personnel | 364,693 | 377,548 | (12,855) | (3%) |
| Transportation and communications | 9,725 | 9,965 | (240) | (2%) |
| Information | 3,888 | 3,315 | 573 | 17% |
| Professional and special services | 54,906 | 59,333 | (4,427) | (7%) |
| Rentals | 4,624 | 5,265 | (641) | (12%) |
| Repairs and maintenance | 9,143 | 8,618 | 525 | 6% |
| Utilities, materials and supplies | 18,368 | 20,216 | (1,848) | (9%) |
| Acquisition of land, buildings and works | 9,945 | 11,579 | (1,634) | (14%) |
| Acquisition of machinery and equipment | 13,788 | 12,982 | 806 | 6% |
| Transfer payments | 539,334 | 589,037 | (49,703) | (8%) |
| Other subsidies and payments | 13,001 | 10,221 | 2,780 | 27% |
| Total Gross Budgetary Expenditures | 1,041,415 | 1,108,079 | (66,664) | (6%) |
| Less: Revenues netted against expenditures | 40,255 | 46,277 | (6,022) | (13%) |
| Total Net Budgetary Expenditures | 1,001,160 | 1,061,802 | (60,642) | (6%) |
| [1] Totals may not add due to rounding. | ||||
Risks and Uncertainties
Agriculture and Agri-Food Canada continues to exercise prudent management in delivering its policies and programs. The Department has established processes to identify, assess, monitor, and respond to a variety of corporate, operational, program and project-level internal and external risks. On an annual basis, the Department identifies risks in fulfilling its responsibilities, develops response strategies and monitors the effectiveness in managing those risks. These risk activities facilitate decision making and priority setting, and contribute to more effective service delivery and efficient use of resources as well as better project management.
In the current environment, supporting employees and managers dealing with pay issues is a top priority for Agriculture and Agri-Food Canada. The department created a Pay Liaison team to proactively mitigate risks and respond to pay issues through: escalation and pay advisory services; outreach and awareness training; communication support and the provision of emergency salary advances and priority payments in response to financial hardship situations. The department actively monitors the pay impacts and corresponding salary payment adjustments resulting from these issue resolution activities.
Significant changes in relation to operations, personnel and programs
Personnel
On October 29, 2018, Annette Gibbons was appointed to the position of Associate Deputy Minister, Agriculture and Agri-Food Canada.
Programs
April 1, 2018 marked the official launch of the Canadian Agricultural Partnership (CAP). The CAP is a five year, $3 billion commitment by federal, provincial, and territorial governments to strengthen the agriculture and agri-food sector. This includes $2 billion in cost-shared programs delivered by provinces and territories and $1 billion in federal activities and programs. The Partnership aims to continue to help the sector grow trade, advance innovation while maintaining and strengthening public confidence in the food system and increase its diversity. Under the Partnership, business risk management (BRM) programs will continue to help producers manage significant risks that threaten the viability of their farm and are beyond their capacity to manage.
Approval by Senior Officials
Approved by:
Original signed by
Chris Forbes, Deputy Head
Ottawa, Canada
Original signed by
Christine Walker, Chief Financial Officer
Ottawa, Canada
| Fiscal year 2018-2019 [1] | Fiscal year 2017-2018 [1] | |||||
|---|---|---|---|---|---|---|
| Total available for use for the year ending March 31, 2019 [2] | Used during the quarter ended December 31, 2018 | Year to date used at quarter-end | Total available for use for the year ending March 31, 2018 [2] | Used during the quarter ended December 31, 2017 | Year to date used at quarter-end | |
| Vote 1 - Net Operating expenditures | $622,433 | $128,127 | $385,994 | $606,655 | $135,424 | $400,418 |
| Vote 5 - Capital expenditures | 68,942 | 13,222 | 22,856 | 77,817 | 9,444 | 22,716 |
| Vote 10 - Grants and contributions | 426,625 | 56,930 | 98,501 | 394,758 | 64,549 | 126,633 |
| Budgetary statutory authorities (3) | 1,479,857 | 310,966 | 493,809 | 1,317,462 | 312,180 | 512,035 |
| Total Budgetary authorities | 2,597,857 | 509,245 | 1,001,160 | 2,396,692 | 521,598 | 1,061,802 |
| Total authorities | $2,597,857 | $509,245 | $1,001,160 | $2,396,692 | $521,598 | $1,061,802 |
Notes: [1] Totals may not add due to rounding. |
||||||
| Fiscal year 2018-2019 [1] | Fiscal year 2017-2018 [1] | |||||
|---|---|---|---|---|---|---|
| Planned expenditures for the year ending March 31, 2019 | Expended during the quarter ended December 31, 2018 | Year to date used at quarter-end | Planned expenditures for the year ending March 31, 2018 | Expended during the quarter ended December 31, 2017 | Year to date used at quarter-end | |
| Expenditures: | ||||||
| Personnel | $507,134 | $119,423 | $364,693 | $504,831 | $118,594 | $377,548 |
| Transportation and communications | 12,520 | 3,942 | 9,725 | 14,128 | 4,014 | 9,965 |
| Information | 6,615 | 1,778 | 3,888 | 7,498 | 1,557 | 3,315 |
| Professional and special services | 112,307 | 22,784 | 54,906 | 128,165 | 26,291 | 59,333 |
| Rentals | 6,267 | 942 | 4,624 | 3,223 | 1,314 | 5,265 |
| Repair and maintenance | 14,581 | 3,826 | 9,143 | 21,501 | 4,374 | 8,618 |
| Utilities, materials and supplies | 44,526 | 6,194 | 18,368 | 56,018 | 8,063 | 20,216 |
| Acquisition of land, buildings and works | 51,820 | 6,411 | 9,945 | 31,928 | 2,744 | 11,579 |
| Acquisition of machinery and equipment | 31,053 | 7,138 | 13,788 | 47,851 | 6,459 | 12,982 |
| Transfer payments | 1,828,149 | 349,675 | 539,334 | 1,637,182 | 359,692 | 589,037 |
| Other subsidies and payments | 39,953 | 3,215 | 13,001 | 10,501 | 4,290 | 10,221 |
| Total gross budgetary expenditures | 2,654,926 | 525,328 | 1,041,415 | 2,462,825 | 537,392 | 1,108,079 |
| Less Revenues netted against expenditures: | ||||||
| Vote-netted revenues | 57,069 | 16,083 | 40,255 | 66,133 | 15,793 | 46,277 |
| Total Revenues netted against expenditures | 57,069 | 16,083 | 40,255 | 66,133 | 15,793 | 46,277 |
| Total net budgetary expenditures | $2,597,857 | $509,245 | $1,001,160 | $2,396,692 | $521,599 | $1,061,802 |
Note: [1] Totals may not add due to rounding. |
||||||
Appendix A
| Fiscal year 2018-2019 [1] | Fiscal year 2017-2018 [1] | |||||
|---|---|---|---|---|---|---|
| Planned expenditures for the year ending March 31, 2019 | Expended during the quarter ended December 31, 2018 | Year to date used at quarter-end | Planned expenditures for the year ending March 31, 2018 | Expended during the quarter ended December 31, 2017 | Year to date used at quarter-end | |
| Contributions to employee benefit plans | $66,321 | $16,381 | $49,144 | $63,449 | $15,695 | $47,084 |
| Minister of Agriculture and Agri-Food - Salary and motor car allowance | 86 | 22 | 65 | 84 | 21 | 63 |
| Contribution payments for the AgriStability program | 384,830 | (7,393) | (18,351) | 219,300 | 1,135 | (15,033) |
| Contribution payments for the AgriInsurance program | 623,000 | 246,068 | 325,991 | 640,800 | 241,062 | 344,406 |
| Grant payments for the AgriInvest program | 138,148 | 43,206 | 132,196 | 126,200 | 42,748 | 124,239 |
| Payments in connection with the Agricultural Marketing Programs Act | 65,900 | 4,750 | 15,899 | 65,900 | 5,237 | 13,390 |
| Grant payments for the AgriStability program | 39,320 | (139) | (242) | 41,000 | -1,500 | (3,046) |
| Contribution payments for the AgriInvest program | 18,602 | 6,117 | 10,854 | 17,500 | 7,261 | 16,127 |
| Loan guarantees under the Canadian Agricultural Loans Act | 13,111 | (3) | (2) | 13,111 | 260 | 386 |
| Contributions in support of the Assistance to the Pork Industry Initiative | - | - | (25,289) | - | (978) | (17,722) |
| Grants to agencies established under the Farm Products Agencies Act | 100 | - | - | 100 | - | - |
| Contribution payments for the Agricultural Disaster Relief Program (ADRP)/AgriRecovery | 118,513 | - | - | 118,513 | - | - |
| Canadian Pari-Mutuel Agency Revolving Fund | - | 245 | (690) | - | 38 | (841) |
| Spending of Amounts Equivalent to Proceeds from Disposal of Surplus Moveable Crown Assets | 11,926 | 1,623 | 4,456 | 11,505 | 1,284 | 3,324 |
| Contributions for agricultural risk management - Enhanced Spring Credit Advance program Business Risk Management | - | 121 | - | - | (69) | (297) |
| Class grant payments for the Transitional Industry Support program | - | - | (2) | - | - | - |
| Class grant payments for the Farm Income program | - | 5 | 7 | - | - | 3 |
| Grant payments for the Canadian Agricultural Income Stabilization program Inventory Transition Initiative | - | (7) | (22) | - | (10) | (25) |
| Contribution payments for the Canadian Agricultural Income Stabilization program Inventory Transition Initiative | - | (21) | (200) | - | - | (20) |
| Grants in support of the Grain and Oilseed Payment program | - | (5) | (6) | - | (5) | (5) |
| Budgetary statutory authorities | $1,479,857 | $310,968 | $493,809 | $1,317,462 | $312,180 | $512,035 |
Note: [1] Totals may not add due to rounding. |
||||||