
What is CIPRA?
The CIPRA is a user-friendly software tool that can predict the development of pests (insects and diseases), crops (phenology) and some postharvest disorders based on hourly weather data. This software therefore enables users to determine, in real-time, the best time to apply plant protection measures.
The software is based not only on weather observations from a number of automatic stations across Quebec, but also on weather forecasts. The establishment of a central computer network provides access to real-time weather data. The probabilities of pest development are then calculated using scientifically developed bioclimatic models.
The CIPRA includes, within a common computer infrastructure, more than 130 forecasting models for insect pests, diseases, crop phenology and postharvest physiological disorders for more than 25 different crops. Every year, new bioclimatic models or indices are added to CIPRA, making it a constantly evolving tool.
The CIPRA is now the largest collection of real-time bioclimatic forecasting models operational in Canada and is an excellent decision support tool for crop protection and production in Canada. This approach contributes significantly to reducing pesticides in the environment while promoting sustainable crop production systems for Canadian farmers.
Implementation
The CIPRA approach was initiated in 1995, through a dynamic collaboration with partners in plant protection, plant physiology and meteorology. It was developed by Agriculture and Agri-Food Canada's bioclimatology and modelling research team in Saint-Jean-sur-Richelieu, Quebec.
Based on a modular design (by crop), CIPRA's bioclimatic models can be easily and quickly transferred to other national and international stakeholders in order to ensure better spatio-temporal distribution of bioclimatic forecasts. The "AgWeather Quebec" and "AgWeather Atlantic" web platforms now also incorporate several of the CIPRA bioclimatic models with input of weather data from more than 300 sites in eastern Canada (Atlantic, Quebec and Ontario).
Today, the CIPRA is used directly by approximately 250 users, but the information is redistributed by them to hundreds of farmers. Although these data are primarily distributed in Quebec, the CIPRA is also used in several other Canadian provinces.
Screenshots from the CIPRA software
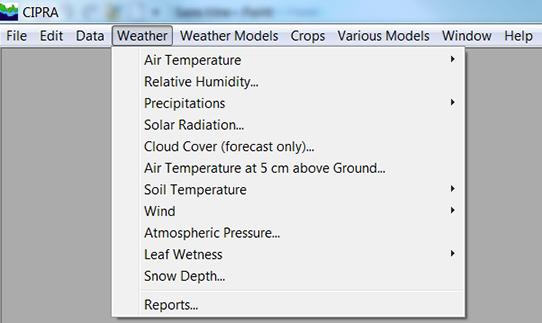
Weather parameters can be viewed as graphs or as reports.
Description of the above image
The "Weather" menu of the Computer Centre for Agricultural Pest Forecasting (CIPRA) software contains the different weather parameters, which can be viewed as graphs or as reports. These parameters are as follows: the air temperature, the relative humidity, the precipitations, the solar radiation, the cloud cover (forecast only), the air temperature at 5 centimetres (cm) above ground, the soil temperature, the wind, the atmospheric pressure, the leaf wetness and the snow depth.
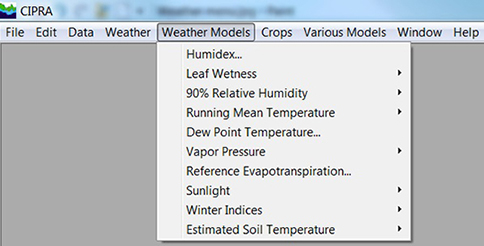
Weather models calculated using real-time data.
Description of the above image
The "Weather Models" menu of the Computer Centre for Agricultural Pest Forecasting (CIPRA) software contains the weather models calculated using real-time data: the humidex, the leaf wetness, the 90% relative humidity, the running mean temperature, the dew point temperature, the vapor pressure, the reference evapotranspiration, the sunlight, the winter indices and the estimated soil temperature. Certain models offer data based on a timeframe, for example, 24, 36 or 48 hours.
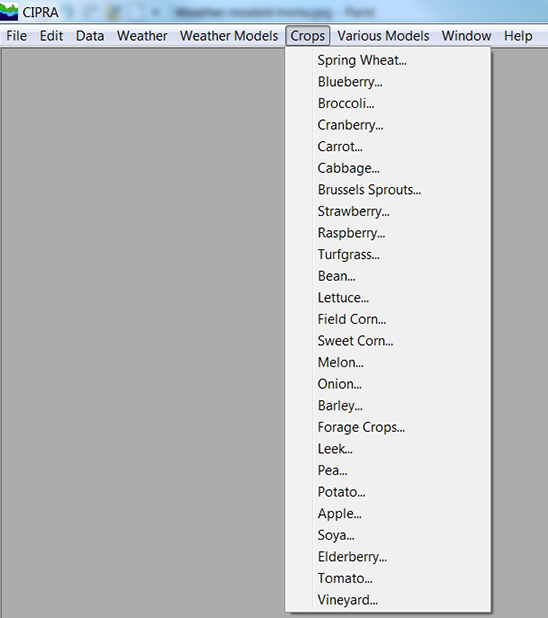
The crops with several forecasting models in CIPRA.
Description of the above image
The "Crops" menu lists all of the crops included in the Computer Centre for Agricultural Pest Forecasting (CIPRA) software. These crops are as follows: spring wheat, blueberry, broccoli, cranberry, carrot, cabbage, Brussels sprouts, strawberry, raspberry, turfgrass, bean, lettuce, field corn, sweet corn, melon, onion, barley, forage crops, leek, pea, potato, apple, soya, elderberry, tomato and vineyard.
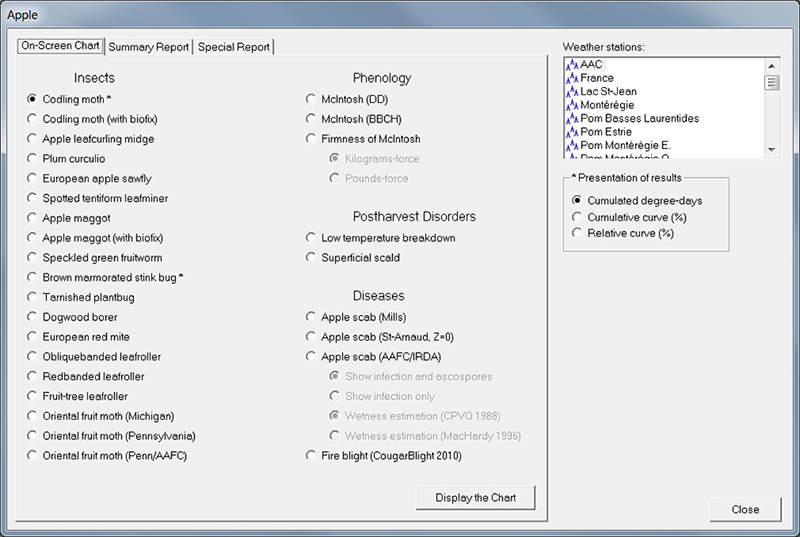
An example of a window regulating the forecasting models for a given crop, in this case, for apple.
Description of the above image
Example of a window from the Computer Centre for Agricultural Pest Forecasting (CIPRA) software that regulates the forecasting models for a given crop, in this case, for apple. The insect models are listed on the left, while the phenology, postharvest disorders and disease models are listed to the right. To the far right, the desired weather stations and presentation of results can be selected.
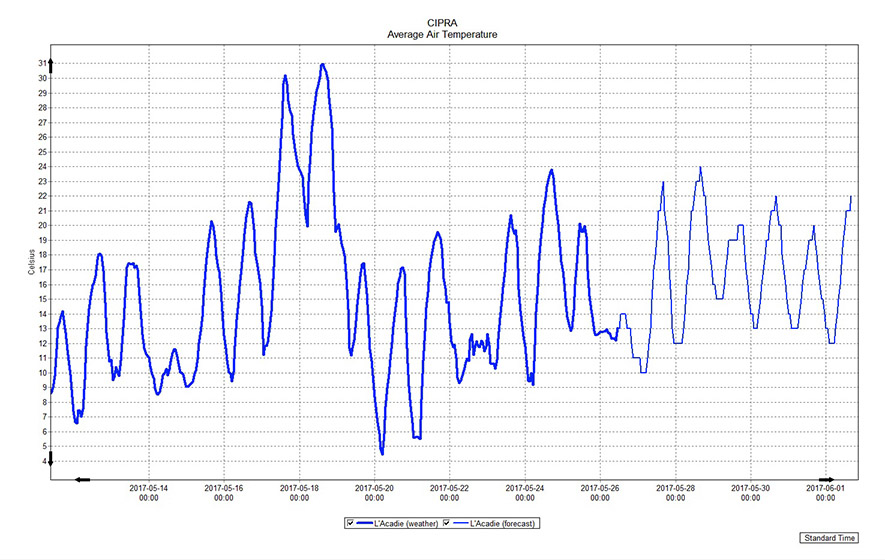
An example of a graph from the CIPRA software representing the average air temperatures measured and forecasted for a period of 7 days.
Description of the above image
Example of a graph from the Computer Centre for Agricultural Pest Forecasting (CIPRA) software presenting data on the average temperatures measured and forecasted for a period of seven days. The horizontal axis indicates the standard time (date and time). The vertical axis represents the temperature and is graduated in degrees Celsius. A blue line in the diagram represents the data for the weather in a chosen area. The line is thicker for the observed data and thinner for the forecast.
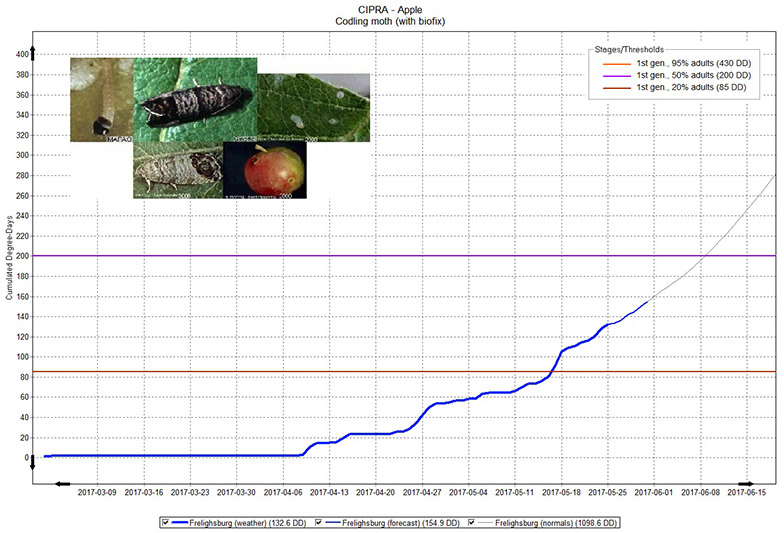
An example of a graph in CIPRA depicting the forecasting model for a given organism, in this case the codling moth.
Description of the above image
Example of a graph in the Computer Centre for Agricultural Pest Forecasting (CIPRA) software depicting the forecasting model for a given organism, in this case the codling moth. The horizontal axis indicates the date and the vertical axis indicates the number of cumulated degree days. Lines of different colours cross the graph horizontally, representing the different stages and thresholds of the organism. A blue line in the graph indicates the weather of the chosen area. In the top left corner of the graph is an image of the organism.
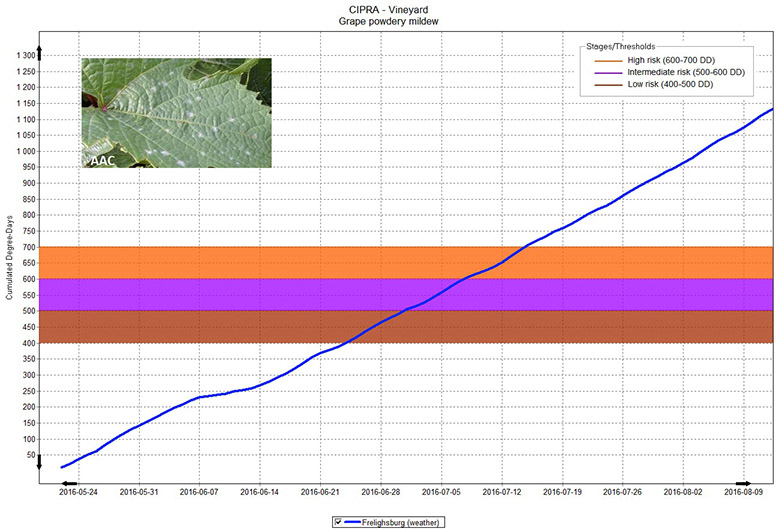
An example of a graph from the CIPRA software representing the forecasting model of a disease, in this case the grape powdery mildew.
Description of the above image
Example of a graph from the Computer Centre for Agricultural Pest Forecasting (CIPRA) software depicting the forecasting model of a disease, in this case the grape powdery mildew. The horizontal axis indicates the date, while the vertical axis indicates the number of cumulated degree days. Coloured strips cross the graph horizontally, indicating the level of the stages and thresholds of the organism, as well as their risk level. A blue line crosses the graph, representing the weather of the chosen area. In the top left corner of the graph is an image of the organism.
To access CIPRA
To obtain a copy of the CIPRA software, please contact Bioclimatology and Modelling (aafc.bioclimatologieetmodelisation-bioclimatologyandmodelling.aac@canada.ca).
CIPRA Crop Guide
The CIPRA Crop Guide is a publication generated by CIPRA which contains a compilation of all the information found in the "Help" menu. The Guide is a work in progress and will be regularly updated with the latest models added to CIPRA.