
This report is a scenario analysis done in 2018 on the financial impact of carbon pricing on the agriculture sector based on the latest information available at the time of writing. This information included 2016 tax data from farms and 2017 provincial policies.
It is an analysis of the potential impacts of carbon pricing prior to policy implementation. The actual policy was updated based on lessons learned from this analysis. For example, rebates for greenhouses were included based on this analysis.
This report has been publicly available since July 2018. After having received multiple requests for the document it was posted on the site for greater ease of reference.
Background
- In December, 2016, federal-provincial-territorial First Ministers announced the Pan-Canadian Framework on Clean Growth and Climate Change (PCF). In the PCF, the federal government announced that by 2018 all provinces and territories will be required to implement a system that either prices carbon at $10 per-tonne, rising to $50 pertonne by 2022, or that meets, under a cap-and-trade system, an emission reduction equivalent to the one achieved with the set carbon price.
- Shortly after the PCF was adopted in January 2017, AAFC conducted a preliminary analysis of financial impacts of carbon pricing on the primary agriculture sector, which presented a worst-case scenario as details of provincial carbon price programs were yet unknown and no cost relief measures were included in the analysis.
- In May 2017, Environment and Climate Change Canada (ECCC) released a Technical Paper on the Federal Carbon Price Backstop providing details on the federal carbon pricing system. Subsequently, on January 2018, the federal government released for public comment draft legislative proposals relating to the proposed federal carbon pricing system, and a regulatory framework describing the proposed federal approach to carbon pricing for large industrial facilities.
- AAFC’s analysis has been updated to reflect provincial systems currently in place and the details provided in the Technical Paper (provincial systems under development and details contained in the new federal draft legislation or regulatory framework are not reflected in the analysis). The impacts of carbon pricing on net operating costs and net operating income are estimated by province and by farm-type, accounting for cost relief measures where applicable.
- AAFC’s results reflect an illustrative scenario and constitute a partial and static analysis that did not consider emission reduction strategies and revenue recycling of funds collected through carbon pricing policy.
Description of above image
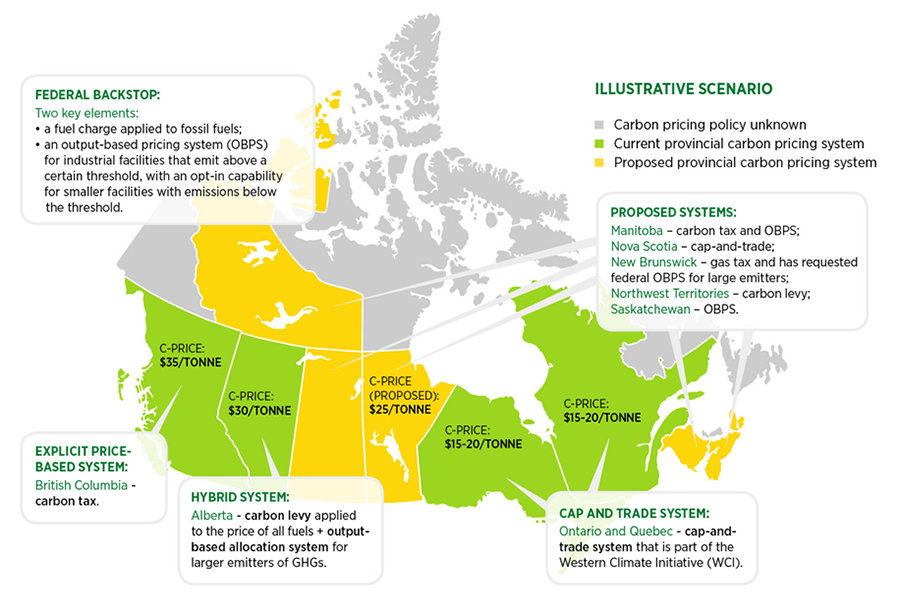
Federal backstop:
Two key elements:
- a fuel charge applied to fossil fuels;
- an output-based pricing system (OBPS) for industrial facilities that emit above a certain threshold, with an opt-in capability for smaller facilities with emission below the threshold.
Carbon pricing system unknown:
Yukon;
Nunavut;
Newfoundland and Labrador.
Current provincial carbon pricing systems:
Explicit-priced based system:
British Columbia – carbon tax.
Hybrid system:
Alberta – carbon levy applied to the price of fuels and output-based allocation system of larger emitters of GHGs.
Cap-and-trade system:
Ontario and Quebec – cap-and-trade system that is part of the Western Climate Initiative (WCI).
Proposed carbon pricing systems:
Proposed systems:
Manitoba – carbon tax and OBPS;
Nova Scotia – cap-and-trade;
New Brunswick – gas tax and has requested federal OBPS for large emitters;
Northwest Territories – carbon levy;
Saskatchewan – OPBS.
Canadian farmers have reduced GHG emissions while producing more
- Adopted technologies and management practices that have contributed to reducing GHG emissions per unit of production.
- Crops: Adoption of field management practices such as precision agriculture and more frequent soil nutrient testing.
- Livestock: Improved feed composition, manure management, and efficient livestock management practices.
- Energy management: Use of agricultural feedstocks for the generation of biogas and replacement of fossil fuels with renewables such as solar and wind energy.
- Soil carbon sequestration: Changes in agricultural land management practices, such as the adoption of conservation tillage and no-till, and the reduced use of summerfallow.
- Earning carbon offset credits in certain provincial carbon pricing systems.
Description of above image
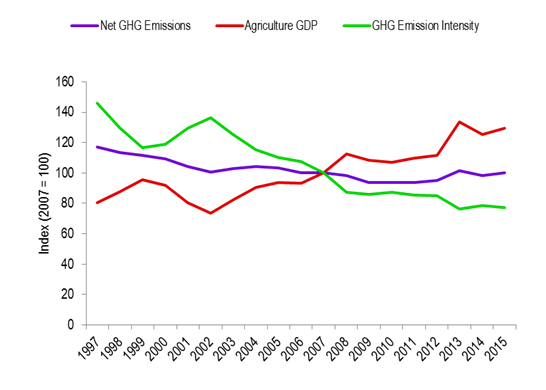
Net GHG Emissions decrease slightly over the time period.
Agricultural GDP increases over the time period.
GHG emission intensity (Net GHG Emissions per Agricultural GDP) decreases over the time period.
Source: Environment and Climate Change Canada, National Inventory Report 2017; Statistics Canada, CANSIM 379-0030
Only a small portion of total agricultural-based emissions will be directly affected by carbon pricing
Description of above image
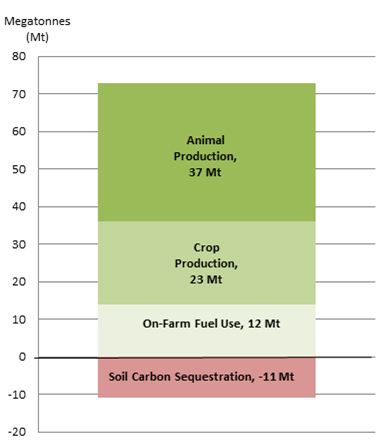
Animal Production, 37 Mt
Crop Production, 23 Mt
On-Farm Fuel Use, 12 Mt
Soil Carbon Sequestration, -11 Mt
Source: National Inventory Report 2018, Environment and Climate Change Canada.
- Agricultural activities produce GHG emissions largely from biological processes inherent in animal and crop production, in contrast with most other sectors in which emissions are largely energy related. Biological emissions are exempt from carbon pricing.
- On-farm fuel use may be subject to proposed carbon pricing policies.
- Exemptions and rebates are available in certain jurisdictions (for example, BC and AB do not price diesel and gasoline for on-farm purposes).
- Proposed federal system exempts diesel and gasoline used for on-farm purposes.
- Land-use change represents a net carbon sink from cropland (that is, carbon sequestration). This is the result of changes in agricultural land management practices, including the adoption of conservation tillage and reduction in summerfallow. These practices offer potential opportunities for generating emission offset credits.
The updated analysis evaluates the direct financial impacts of a carbon price; it does not include revenue recycling, behavioural changes nor other benefits of carbon pricing
- Level of carbon pricing used in quantitative analysis:
- $50 per-tonne by 2022, based on federal benchmark, except for Ontario (ON) and Quebec (QC).
- ON and QC: $20 per tonne, based on Western Climate Initiative (cap and trade) price projections for 2022Footnote 1.
- The analysis includes:
- Exemptions from carbon pricing for gasoline and diesel fuel used in farming activities (federal backstop, current systems in British Columbia (BC) and Alberta (AB)). ON and QC do not provide equivalent exemptions.
- Other cost relief measures, including carbon tax rebates provided by BC and AB to greenhouses.
- Output-based pricing systems for large emitters, such as electricity generators where applicable.
- Limitations of the analysis:
- The potential indirect impacts of carbon pricing through inputs and services such as transportation, fertilizer, and commercial feed;
- The potential indirect financial benefits from provincial fee reductions or program expenditures related to the use of carbon pricing revenues (that is, revenue recycling);
- Behavioural changes by primary producers in response to carbon pricing, such as the adoption of more energy efficient technologies or farm management practices;
- Any potential for revenue generation by the agriculture sector from emission offsets credits.
Carbon pricing is expected to directly impact a relatively small subset of farm operating expenses
Description of above image
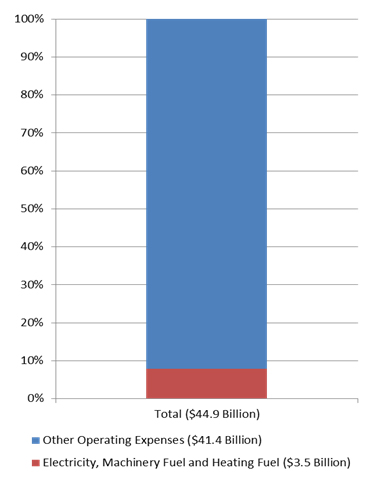
Electricity, machinery, and heating fuel account for $3.5 billion (7.8% of total operating expenses) which are the farm operation activities which carbon pricing currently applies
Other operating expenses account for $41.4 billion (92.2% of total operating expenses)
Source: Statistis Canada, CANSIM 002-0005, and AAFC calculations
- The analysis takes into account energy inputs that are relevant to the agriculture sector: machinery fuel (diesel and gasoline), electricity, and heating fuel (natural gas, light oil and propane).
- Fuel: The carbon content of each fuel (per unit of fuel) is multiplied by the carbon tax rate to calculate the additional fuel cost (per unit). Then, the percentage increase in price is calculated by considering the average fuel price in 2016 as the base.
- Electricity: The impact on electricity prices was based on the carbon content of all energy sources used in generating electricity and taking into account the share each source contributes to each province’s electricity grid, as well as on the specifics of outputbased pricing systems for large emitters within each provinceFootnote 2.
- In 2016, electricity, machinery fuel and heating fuel accounted for an average of 7.8% of operating expenses in Canadian farms.
Financial Impacts are expected to be modest for the average Canadian farm

Description of above image
Increase in net operating expenses at $20 per tonne nationally and all provinces except Ontario and Quebec
Increase in net operating expenses at $50 per tonne for Ontario and Quebec
Source: Agriculture and Agri-Food Canada estimates.
Net Operating Expenses: 0.1% (MB, SK, AB) to 0.45% (ON)
Description of above image
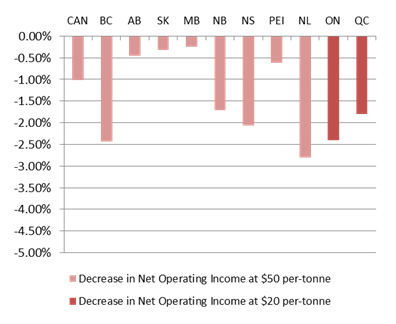
Decrease in net operating income at $20 per tonne nationally and all provinces except Ontario and Quebec
Decrease in net operating income at $50 per tonne for Ontario and Quebec
Source: Agriculture and Agri-Food Canada estimates.
Net Operating Income: -0.2% (MB) to -2.8% (NL)
- Farms in Canada would see an average increase of $718, or 0.2% to their net operating costs, and a decrease of 1.0% to their net operating income.
- Provincial level impacts will vary depending on a multiplicity of factors, including the mix of farm types in the province and the provincial carbon pricing system.
The magnitude of impacts of carbon pricing will vary by farm type
Description of above image
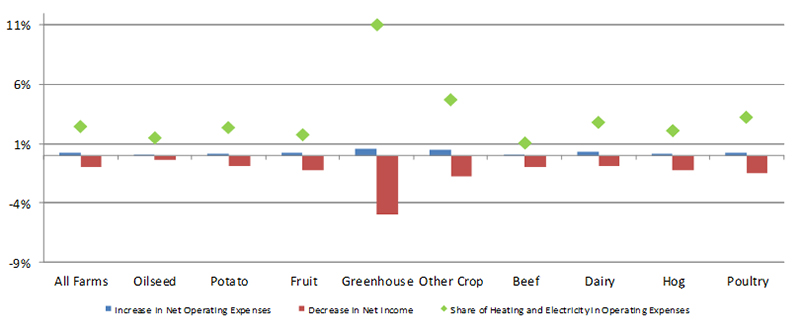
Increase in net operating expenses for all farm types except oilseed
Decrease in net income for all farm types
Share of heating and electricity in operating expenses for all farms, oilseed and grains, potato, fruit, greenhouse, other crops, beef, dairy, hop, poultry; the highest expenses being for greenhouse at 11%.
Source: Agriculture and Agri-Food Canada estimates
- Impacts will vary across farm types due to different input and cost structures.
- Increases in net operating expenses range from 0.08% for beef to 0.6% for greenhouses.
- Decreases in net operating income range from 0.3% for oilseed and dairy farms to 5.0% for greenhouses.
- Greenhouses require significant amounts of heating and electricity to operate and would therefore see disproportionate impacts when compared to other farm types.
- BC and AB provide cost relief to greenhouse operations in the form of an 80% rebate on the carbon tax or levy paid for natural gas and propane used for heating and carbon dioxide production.
Potential opportunities exist for farmers to benefit from climate change policies
- Revenues remain in the jurisdiction of origin:
- Revenue recycling: Each jurisdiction can use carbon pricing revenues according to their needs, including to address impacts on vulnerable populations and sectors and to support climate change and clean growth goals. For example, British Columbia has used carbon pricing revenues to lower corporate and personal income taxes, which will benefit the agriculture sector.
- Under carbon pricing policies, farmers could earn offset credits by taking on projects to reduce GHG emissions and then generate revenue by selling the offsets.
- Alberta currently has eight agriculture-related offset protocols in its output-based pricing system, and Quebec has one.
- In Alberta, farmers and intermediaries have earned up to an estimated $170 million from the sale of emission offset creditsFootnote 3.
- Through the Low Carbon Economy Leadership Fund, the Government of Canada is investing in the agricultural sector.
- Alberta: nearly $150 million to help Albertans, including farmers and ranchers, use less energy and save money.
- Ontario: almost $420 million to support Ontario’s Climate Change Action Plan, including to help farmers reduce emissions from their operations.
- Quebec: over $260 million to help expand actions under the province’s 2013-2020 Climate Change Action Plan, including new investments to allow farmers to adopt best practices.