

Note: This report includes forecasting data that is based on baseline historical data.
Executive summary
Honey production in Canada fell 15.4% from a year earlier to 80.4 million pounds in 2019 in the wake of a cold, wet spring and summer on the Prairies. This was its lowest level in seven years
From January 1, 2016 to October 31, 2020, there were 1,200 products launched in Canada that contained honey as in ingredient. Of these 1, 200 product releases, 1,108 were categorized as food products, 82 were categorized as drink products, while the remaining 10 were categorized as pet food products.
From the prescribed period (January 1, 2016 to October 31, 2020), snacks (323), breakfast cereals (153), bakery (147), sauces & seasonings (102) and processed fish, meat and egg products (89) were the top five categories launching products containing honey as an ingredient in the Canadian market.
Honey was the fourth largest segment of sweet spreads attaining Can$137.1 million in retail sales in 2019, declining in growth by 2.9% from Can$145.5 million in 2017. Honey, also declined in volume by 7.3% from 14.3 tonnes in 2017 to 12.3 tonnes in 2019.
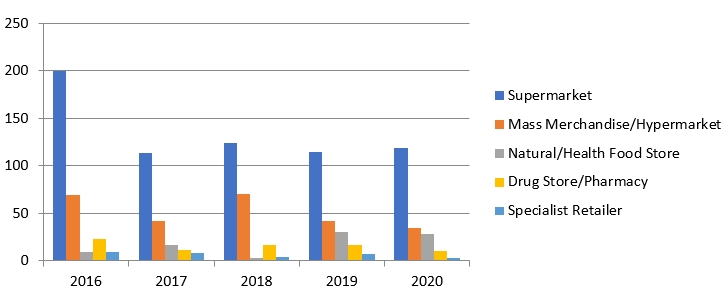
The top three distribution channels of new products launches with honey as an ingredient were through supermarkets (56.0%), followed by mass merchandise/hypermarket (21.5%) and natural/health food store (7.4%) from January 2016 to October 2020.
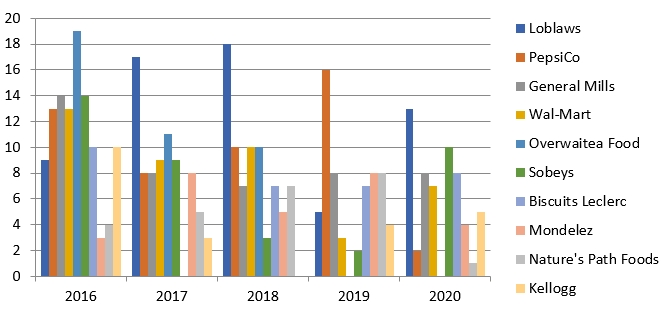
The top (five) companies who launched new products containing honey as an ingredient in Canada between January 1 2016 to October 31, 2020 were Loblaws who launched 62 products (5.2% market share), followed by PepsiCo who launched 49 products (4.1% market share), General Mills who launched 45 products (3.8% market share, Walmart who launched 42 products (3.5% market share) and Overwaitea Food who launched 40 products (3.2% market share).
Sector overview
Honey production in Canada fell 15.4% from a year earlier to 80.4 million pounds in 2019 in the wake of a cold, wet spring and summer on the Prairies. This was its lowest level in seven years.
In Alberta, the largest honey-producing province, production fell 35.0% to 25.1 million pounds, the lowest level in the province since 2000. Production was also down in Manitoba (−1.9%) and Saskatchewan (−1.4%). Since 2000, about four-fifths of the annual honey production in Canada has come from these three Prairie provinces.
Nationally, the total value of honey sold was down 13.8% year over year to $173.0 million in 2019, its lowest level in three years due to lower yields.
The number of beekeepers in Canada fell by 317 from a year earlier to 10,344 in 2019. Over half of the beekeepers in Canada were located in British Columbia (2,763) and Ontario (2,506).
Bees in British Columbia and Ontario are valued more for their pollination of fruits and vegetables than for their honey production. In fact, the 5,269 beekeepers in these two provinces combined produced less than half the amount of honey produced by the 1,474 beekeepers in Alberta in 2019.
The number of bee colonies in Canada was down 2.1% from a year earlier to 773,182 in 2019. (Statistics Canada, 2019
New products containing honey
From January 1, 2016 to October 31, 2020, there were 1,200 products launched in Canada that contained honey as in ingredientFootnote 1. Of these 1, 200 product releases, 1,108 were categorized as food products, 82 were categorized as drink products, while the remaining 10 were categorized as pet food products.
From the prescribed period (January 1, 2016 to October 31, 2020), snacks (323), breakfast cereals (153), bakery (147), sauces and seasonings (102) and processed fish, meat and egg products (89) were the top five categories launching products containing honey as an ingredient in the Canadian market. The top five categories were further sub-categorized as follows:
- Within the snacks category (323); 244 products were sub-categorized as snack/cereal/energy bars while 21 were sub-categorized as snack mixes, 20 were sub-categorized as nuts, 11 were sub-categorized as meat snacks, 7 were sub-categorized as potato snacks, 5 were sub-categorized as wheat and other grain-based snacks, 5 were sub-categorized as fruit snacks and 4 were sub-categorized as corn-based snacks.
- Within the breakfast cereals category (153); 150 products were sub-categorized as cold cereals, and 3 were sub-categorized as hot cereals.
- Within the bakery category (147); 55 products were sub-categorized as sweet biscuits/cookies, 29 were sub-categorized as bread and bread products, 24 were sub-categorized as cakes and pastries and sweet goods, 22 were sub-categorized as savoury biscuits/crackers, 17 as baking ingredients.
- Within the sauces and seasonings category (102); 52 products were sub-categorized as table sauces, 17 products were sub-categorized as cooking sauces, 13 were sub-categorized as dressings and vinegar, 8 were sub-categorized as mayonnaise, 6 products were sub-categorized as stocks and 4 were sub-categorized as seasonings.
- Within the processed fish, meat and egg products category (89); 48 products were sub-categorized as meat products, 30 were sub-categorized as poultry products and 10 were sub-categorized as fish products.
| Category | 2016 | 2017 | 2018 | 2019 | 2020 (January to October) | Total |
|---|---|---|---|---|---|---|
| Snacks | 94 | 38 | 83 | 60 | 48 | 323 |
| Breakfast cereals | 55 | 23 | 32 | 23 | 20 | 153 |
| Bakery | 44 | 22 | 31 | 24 | 26 | 147 |
| Sauces and seasonings | 29 | 22 | 12 | 8 | 31 | 102 |
| Processed fish, meat and egg products | 25 | 24 | 17 | 8 | 15 | 89 |
| Chocolate confectionery | 18 | 22 |
12 |
16 | 14 | 82 |
| Sweet spreads | 13 | 4 | 5 | 9 | 24 | 55 |
| Sugar and gum confectionery | 11 | 7 | 3 | 28 | 4 | 53 |
| Meals and meal centers | 6 | 9 | 10 | 6 | 6 | 37 |
| Dairy | 9 | 7 | 2 | 7 | 0 | 25 |
| RTDs | 1 | 1 | 5 | 11 | 4 | 22 |
| Desserts and ice cream | 6 | 4 | 5 | 1 | 4 | 20 |
| Alcoholic beverages | 4 | 4 | 3 | 4 | 1 | 16 |
| Juice drinks | 1 | 4 | 2 | 6 | 1 | 14 |
| Pet food | 2 | 3 | 1 | 1 | 3 | 10 |
| Total | 333 | 206 | 233 | 223 | 205 | 1,200 |
|
Source;Mintel, 2020 |
||||||
In Canada, new variety/range extension (421), new packaging (416) and new products (296) were leading launch types of honey as an ingredient in products from January 1 2016 to October 31, 2020.
Of the three leading launch types, new variety/range extension had the largest decline in compound annual growth rate (CAGR) of 15.1% as the amount of launch types decreased from 127 in 2016 to 66 as of October 31, 2020, followed by new packaging with a CAGR of 11.9% as amount of launch types decreased from 111 to 67, during the same period.

Description of above image
| Launch type | 2016 | 2017 | 2018 | 2019 | 2020 (January to October) | Total |
|---|---|---|---|---|---|---|
| New Variety/Range Extension | 127 | 81 | 84 | 63 | 66 | 421 |
| New Packaging | 111 | 68 | 92 | 78 | 67 | 416 |
| New Product | 83 | 50 | 39 | 66 | 58 | 296 |
| Relaunch | 10 | 7 | 17 | 15 | 13 | 62 |
| New Formulation | 2 | 0 | 1 | 1 | 1 | 5 |
| Total | 333 | 206 | 233 | 223 | 205 | 1,200 |
Source: Mintel, 2020
Market segmentation of honey in Canada
Retail sales of sweet spreads in Canada were valued at Can$896.2 million in 2019, representing a growth of 1.3% from Can$872.9 million in 2017. Honey was the fourth largest segment of sweet spreads attaining Can$137.1 million in retail sales in 2019, declining in growth by 2.9% from Can$145.5 million in 2017.
Retail volume of sweet spreads in Canada reached 123.1 tonnes in 2019, representing 1.4% decline from 126.7 tonnes in 2017. Honey, as the fourth largest sweet spread, also declined in volume by 7.3% from 14.3 tonnes in 2017 to 12.3 tonnes in 2019.
| Segment | 2017 | 2018 | 2019 |
|---|---|---|---|
| Total | 872.9 | 874.6 | 896.2 |
| Nut butter/spreads | 314.1 | 305.9 | 332.9 |
| Jam | 192.1 | 193.2 | 202.9 |
| Chocolate Spreads | 158.9 | 159.7 | 160.9 |
| Honey | 145.5 | 153.7 | 137.1 |
| Other sweet spreads | 62.3 | 62.1 | 62.4 |
| Source: Mintel market sizes, 2020, The Nielsen Company, Trade Interviews, Mintel | |||
| Segment | 2017 | 2018 | 2019 |
|---|---|---|---|
| Total | 126.7 | 122.8 | 123.1 |
| Nut butter/spreads | 68.2 | 64.9 | 66.7 |
| Jam | 22.1 | 22.1 | 22.7 |
| Chocolate Spreads | 17.4 | 17.2 | 16.9 |
| Honey | 14.3 | 14.1 | 12.3 |
| Other sweet spreads | 4.7 | 4.5 | 4.5 |
| Source: Mintel market sizes, 2020 (Statistics Canada, The Nielsen Company, Trade Interviews, Mintel) | |||
The top three distribution channels of new product launches with honey as an ingredient were through supermarkets (56.0%), followed by mass merchandise/hypermarket (21.5%) and natural/health food store (7.4%) from January 2016 to October 2020. The use of both supermarkets and mass merchandise/hypermarkets as primary and secondary distribution channels of these products however, have declined in growth by 12.2% and 15.6% respectively, while natural/health food stores have grown by 29.4% during this same period. Of note, specialist retailers have also declined in growth by 26.0% from January 2016 to October 2020.
Description of above image
| Distribution Channel | 2016 | 2017 | 2018 | 2019 | 2020 (January to October) | Total |
|---|---|---|---|---|---|---|
| Supermarket | 200 | 114 | 124 | 115 | 119 | 672 |
| Mass Merchandise/Hypermarket | 69 | 42 | 70 | 42 | 35 | 258 |
| Natural/Health Food Store | 10 | 17 | 3 | 31 | 28 | 89 |
| Drug Store/Pharmacy | 23 | 12 | 17 | 17 | 11 | 80 |
| Specialist Retailer | 10 | 8 | 4 | 7 | 3 | 32 |
| Total | 333 | 206 | 233 | 223 | 205 | 1,200 |
Source: Mintel, 2020
The top (five) companies who launched new products containing honey as an ingredient in Canada between January 1 2016 to October 31, 2020 were Loblaws who launched 62 products (5.2% market share), followed by PepsiCo who launched 49 products (4.1% market share), General Mills who launched 45 products (3.8% market share, Walmart who launched 42 products (3.5% market share) and Overwaitea Food who launched 40 products (3.2% market share). Of these top five companies, only Loblaws experienced a growth rate in new product launches of 9.6% as product launches increased from nine in 2016 to thirteen as of October 2020. Of the top ten companies, in addition to Loblaws, Mondelez also experienced a growth in product launches of 7.5% as new products launched increased from three products in 2016 to four products as of October 2020. Further, companies who have launched products with honey as an ingredient in Canada have declined in growth by 11.4% as total new product launches by companies have decreased from 333 products in 2016 to 205 products as of October 2020.
Description of above image
| Top 10 Companies | 2016 | 2017 | 2018 | 2019 | 2020 | Total |
|---|---|---|---|---|---|---|
| Loblaws | 9 | 17 | 18 | 5 | 13 | 62 |
| PepsiCo | 13 | 8 | 10 | 16 | 2 | 49 |
| General Mills | 14 | 8 | 7 | 8 | 8 | 45 |
| Wal-Mart | 13 | 9 | 10 | 3 | 7 | 42 |
| Overwaitea Food | 19 | 11 | 10 | 0 | 0 | 40 |
| Sobeys | 14 | 9 | 3 | 2 | 10 | 38 |
| Biscuits Leclerc | 10 | 0 | 7 | 7 | 8 | 32 |
| Mondelez | 3 | 8 | 5 | 8 | 4 | 28 |
| Nature's Path Foods | 4 | 5 | 7 | 8 | 1 | 25 |
| Kellogg | 10 | 3 | 0 | 4 | 5 | 22 |
| Total | 333 | 206 | 233 | 223 | 205 | 1,200 |
Source: Mintel, 2020
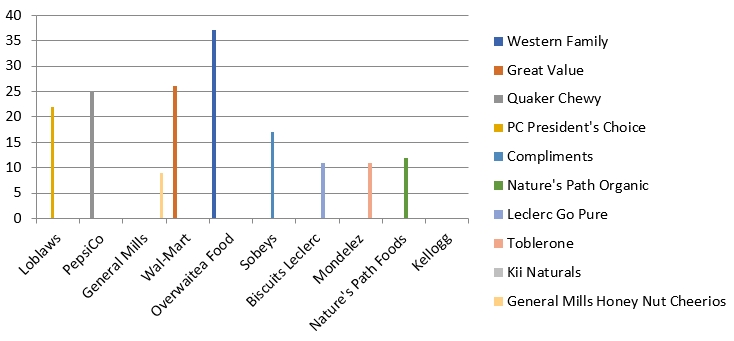
Of the top 10 brands, Western Family (Overwaitea Food) recorded the largest number of new product launches (37 of the 46 total) with honey as an ingredient in Canada from January 2016 to October 2020. Remaining brands such as Great Value (Walmart) released 26 of these products, followed by Quaker Chewy (PepsiCo) released 25 products, PC President's Choice (Loblaws) released 22 products and Compliments (Sobeys) released 17 products.
Description of above image
| Top 10 Brands | Loblaws | PepsiCo | General Mills | Wal-Mart | Overwaitea Food | Sobeys | Biscuits Leclerc | Mondelez | Nature's Path Foods | Kellogg | Total |
|---|---|---|---|---|---|---|---|---|---|---|---|
| Western Family | 0 | 0 | 0 | 0 | 37 | 0 | 0 | 0 | 0 | 0 | 46 |
| Great Value | 0 | 0 | 0 | 26 | 0 | 0 | 0 | 0 | 0 | 0 | 26 |
| Quaker Chewy | 0 | 25 | 0 | 0 | 0 | 0 | 0 | 0 | 0 | 0 | 25 |
| PC President's Choice | 22 | 0 | 0 | 0 | 0 | 0 | 0 | 0 | 0 | 0 | 22 |
| Compliments | 0 | 0 | 0 | 0 | 0 | 17 | 0 | 0 | 0 | 0 | 17 |
| Nature's Path Organic | 0 | 0 | 0 | 0 | 0 | 0 | 0 | 0 | 12 | 0 | 12 |
| Leclerc Go Pure | 0 | 0 | 0 | 0 | 0 | 0 | 11 | 0 | 0 | 0 | 11 |
| Toblerone | 0 | 0 | 0 | 0 | 0 | 0 | 0 | 11 | 0 | 0 | 11 |
| Kii Naturals | 0 | 0 | 0 | 0 | 0 | 0 | 0 | 0 | 0 | 0 | 10 |
| General Mills Honey Nut Cheerio | 0 | 0 | 9 | 0 | 0 | 0 | 0 | 0 | 0 | 0 | 9 |
| Total | 62 | 49 | 45 | 42 | 40 | 38 | 32 | 28 | 25 | 22 | 1,200 |
Source: Mintel, 2020
According to Mintel, there were 640 recorded flavours (including blends) of those new products launched with honey as an ingredient, in Canada from January 2016 to October 2020. Of those 640 flavours (including blends), the top 15 flavours (including blends) represented a 33.8% market share, with unflavoured/plain and honey as the top two flavours, 8.2% and 7.0% market shares respectively.
Honey flavour, despite being the second largest flavour released in Canada, has recently declined in growth by 13.3% from 23 products in 2016 to 13 products as of October 2020. Chocolate flavour (the third largest flavour) has also declined 12.6% from 12 products in 2016 to 7 products as of October 2020. Of note, Honey and mustard flavour (ninth largest flavour) released 12 new products during this same period and grew by 41.4% as product releases increased from one in 2016 to four by October 2020.
Honey as an ingredient and flavour,according to Mintel, is increasingly being incorporated by ready-to-drink (RTD) tea brands around the world as uniquely suited to deliver sweetness as a healthier form of indulgence and who prominently emphasis honey's role as a flavour element by using on-pack imagery such as bees, hives and honey comb to convey this message.

Description of above image
| Flavours (including blends) | 2016 | 2017 | 2018 | 2019 | 2020 | Total |
|---|---|---|---|---|---|---|
| Unflavoured/Plain | 30 | 9 | 14 | 14 | 31 | 98 |
| Honey | 23 | 17 | 20 | 11 | 13 | 84 |
| Chocolate | 12 | 5 | 12 | 9 | 7 | 45 |
| Honey and Garlic | 13 | 10 | 8 | 3 | 9 | 43 |
| S'mores | 5 | 4 | 5 | 1 | 3 | 18 |
Source: Mintel, 2020
| Flavours (including blends) | 2016 | 2017 | 2018 | 2019 | 2020 | Total |
|---|---|---|---|---|---|---|
| Unflavoured/Plain | 30 | 9 | 14 | 14 | 31 | 98 |
| Honey | 23 | 17 | 20 | 11 | 13 | 84 |
| Chocolate | 12 | 5 | 12 | 9 | 7 | 45 |
| Honey and Garlic | 13 | 10 | 8 | 3 | 9 | 43 |
| S'mores | 5 | 4 | 5 | 1 | 3 | 18 |
| Honey and Almond and Nougat/Turron | 4 | 4 | 1 | 2 | 4 | 15 |
| Almond | 4 | 0 | 3 | 6 | 2 | 15 |
| Honey and Nut | 3 | 2 | 4 | 1 | 2 | 12 |
| Honey and Mustard | 1 | 4 | 0 | 3 | 4 | 12 |
| Honey Roasted | 4 | 2 | 5 | 0 | 0 | 11 |
| Raspberry | 4 | 2 | 0 | 1 | 4 | 11 |
| Honey and Almond | 6 | 0 | 2 | 1 | 2 | 11 |
| Peanut Butter | 4 | 1 | 1 | 3 | 2 | 11 |
| Vanilla/Vanilla Bourbon/Vanilla Madagascar | 5 | 1 | 2 | 1 | 1 | 10 |
| Honey and Lemon | 2 | 2 | 1 | 3 | 1 | 9 |
| Total | 333 | 206 | 233 | 223 | 205 | 1,200 |
| Source: Mintel, 2020 | ||||||
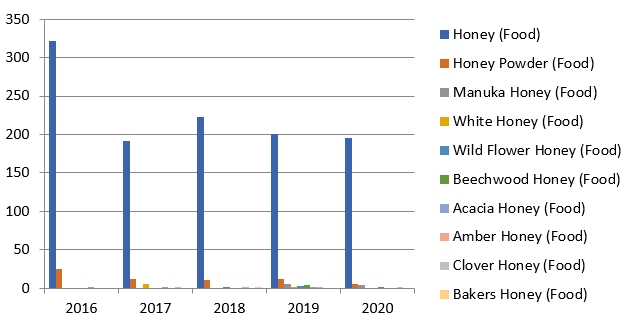
The top five ingredients of new product launches with honey as an ingredient in Canada during the prescribed period (January 1, 2016 to October 31, 2020) were as follows; honey (food) (94.3% market share), honey powder (food) (5.4% market share), Manuka honey (food) (0.8% market share), White honey (food) (0.7% market share) and Wild flower honey (food) (0.4% market share). Of the top five ingredients of new product launches with honey as an ingredient, honey powder had the largest decline in growth of 33.1% as new products released declined from twenty-five in 2016 to five as of October 2020. Honey (food) attained the second largest decline of 11.6% as new products released declined from 321 in 2016 to 196 in 2020.
Description of above image
| Top 10 ingredients | 2016 | 2017 | 2018 | 2019 | 2020 | Total |
|---|---|---|---|---|---|---|
| Honey (Food)[1] | 321 | 192 | 223 | 200 | 196 | 1,132 |
| Honey Powder (Food) | 25 | 12 | 11 | 12 | 5 | 65 |
| Manuka Honey (Food) | 0 | 0 | 0 | 6 | 4 | 10 |
| White Honey (Food) | 0 | 6 | 0 | 2 | 0 | 8 |
| Wild Flower Honey (Food) | 0 | 0 | 2 | 3 | 0 | 5 |
| Beechwood Honey (Food) | 0 | 0 | 0 | 4 | 1 | 5 |
| Acacia Honey (Food) | 2 | 1 | 0 | 1 | 0 | 4 |
| Amber Honey (Food) | 0 | 0 | 1 | 2 | 0 | 3 |
| Clover Honey (Food) | 0 | 1 | 0 | 0 | 1 | 2 |
| Bakers Honey (Food) | 0 | 0 | 1 | 0 | 0 | 1 |
| Total | 333 | 206 | 233 | 223 | 205 | 1,200 |
|
1: Honey (Food) according to Mintel's definition; Honey is the natural sweet substance produced by Apis mellifera bees from the nectar of plants or from secretions of living parts of plants or excretions of plant-sucking insects on the living parts of plants, which the bees collect, transform by combining with specific substances of their own, deposit, dehydrate, store and leave in honeycombs to ripen and mature. Honey consists essentially of different sugars, predominantly fructose and glucose as well as other substances such as organic acids, enzymes and solid particles derived from honey collection. The colour of honey varies from nearly colourless to dark brown. The consistency can be fluid, viscous or partly to entirely crystallized. The flavour and aroma vary, but are derived from the plant origin. (Council Directive 2001/110/EC of 20 December 2001 relating to honey). |
||||||
Source: Mintel, 2020
The number of product launches with honey as an ingredient in Canada has declined in growth by 11.4% from the highest of its launches (333) in 2016 to its lowest and most recent, (205) as of October 2020, peaking again to its second highest launch of (233) products in 2018.
Kosher, followed by no additives/preservatives and ethically-environmentally friendly packaging are top claims associated with new product launches released from January 2016 to October 2020. Notably, vegan claims in sweet and savoury spreads, according to Mintel, in new product development (NPD) has seen substantial growth in North America, with increases of seven percentage points in the five years to May 2019 to account for 15% of NPD in the 12 months to April 2019. Such an example of a vegan product claim is 'NutRaw Pistachio + Macadamia Butter', an organic real food spread with 5g of plant protein and 3g of fibre. The brand additionally claims the spread contains no preservatives, artificial flavours, added sugars, dairy or soy.
A flexible packaging type (599) with shelf-stable storage (989) are the more prevalent product attributes associated with new product launch releases during the prescribed period, while branded (943) versus private label (257), and available most commonly in 500 gram total pack sizes, represent other product attributes released during the same period.
Canada and the United States (U.S) are top manufacture locations, representing a 39.0% market share, for recent new product launches of honey as an ingredient within Canada, while blown glass and injection blown glass represent 15.4% of the top five productions methods used.
| Product attributes | Yearly launch counts | |||||
|---|---|---|---|---|---|---|
| 2016 | 2017 | 2018 | 2019 | 2020 (October 31) | Total | |
| Yearly product launches | 333 | 206 | 233 | 223 | 205 | 1,200 |
| Top five claims[1] | ||||||
| Kosher | 139 | 68 | 125 | 89 | 90 | 511 |
| No Additives/Preservatives | 80 | 59 | 73 | 74 | 72 | 358 |
| Ethical - Environmentally Friendly Package | 110 | 59 | 91 | 89 | 64 | 413 |
| Low/No/Reduced Allergen | 102 | 68 | 86 | 57 | 64 | 377 |
| Ethical - Recycling | 108 | 58 | 84 | 87 | 60 | 397 |
| Imported status | ||||||
| Imported | 81 | 40 | 58 | 79 | 64 | 322 |
| Not Imported | 79 | 45 | 58 | 37 | 49 | 268 |
| Top five packaged types | ||||||
| Flexible | 162 | 91 | 126 | 124 | 96 | 599 |
| Bottle | 28 | 26 | 18 | 30 | 31 | 133 |
| Jar | 14 | 6 | 11 | 7 | 27 | 65 |
| Flexible Stand-Up Pouch | 35 | 25 | 26 | 20 | 15 | 121 |
| Carton | 13 | 8 | 16 | 5 | 13 | 55 |
| Top five location of manufacture | ||||||
| Canada | 79 | 45 | 58 | 37 | 49 | 268 |
| United States | 57 | 27 | 45 | 41 | 30 | 200 |
| Switzerland | 5 | 4 | 2 | 3 | 7 | 21 |
| Taiwan, China | 1 | 3 | 2 | 5 | 7 | 18 |
| China | 1 | 0 | 0 | 2 | 3 | 6 |
| Private label | ||||||
| Branded | 263 | 149 | 172 | 200 | 159 | 943 |
| Private label | 70 | 57 | 61 | 23 | 46 | 257 |
| Top production methods | ||||||
| Blown glass | 18 | 21 | 12 | 21 | 36 | 108 |
| Injection blown plastic | 21 | 12 | 15 | 19 | 10 | 77 |
| Thermo-formed plastic | 29 | 13 | 12 | 9 | 5 | 68 |
| Extrusion blown plastic | 5 | 0 | 2 | 0 | 5 | 12 |
| 2-piece metal | 5 | 4 | 4 | 3 | 2 | 18 |
| Storage | ||||||
| Shelf stable | 268 | 153 | 195 | 194 | 179 | 989 |
| Frozen | 29 | 22 | 18 | 9 | 14 | 92 |
| Chilled | 36 | 31 | 20 | 20 | 12 | 119 |
| Top five total unit pack size (millilitres/gram) | ||||||
| 500 grams | 9 | 9 | 3 | 8 | 12 | 41 |
| 180 grams | 1 | 1 | 1 | 1 | 4 | 8 |
| 360 grams | 2 | 1 | 0 | 2 | 2 | 7 |
| 400 grams | 17 | 6 | 2 | 0 | 7 | 32 |
| 40 grams | 4 | 7 | 16 | 1 | 7 | 35 |
|
Source: Mintel, 2020 1: Products may have more than one claim associated with product. |
||||||
New product launches
Zero Calorie Green Tea with Ginseng
 Source: Mintel, 2020
| Company | Arizona Beverages |
|---|---|
| Brand | AriZona |
| Category | Ready-to-drinks |
| Sub-category | Ready-to-drink (Iced) Tea |
| Market | Canada |
| Store name | Provigo |
| Store type | Supermarket |
| Date published | October 2020 |
| Launch type | New packaging |
| Price in local currency | Can$0.99 |
| Price in US dollars | 0.75 |
AriZona Zero Calorie Green Tea with Ginseng has been repackaged in a newly designed 960 millilitre recyclable pack. The product is claimed to be great hot, and has been sweetened with sucralose and acesulfame-potassium.
Swiss Milk Chocolate with Honey and Almond Nougat
 Source: Mintel, 2020
| Company | Mondelez |
|---|---|
| Brand | Toblerone |
| Category | Chocolate confectionery |
| Sub-category | Seasonal chocolate |
| Market | Canada |
| Store name | Walmart |
| Store type | Mass merchandise/hypermarket |
| Date published | December 2019 |
| Launch type | New packaging |
| Price in local currency | Can$7.98 |
| Price in US dollars | 6.02 |
Toblerone Swiss Milk Chocolate with Honey and Almond Nougat has been repackaged for Christmas 2019. The seasonal and kosher certified product retails in a 360 gram pack, bearing a Facebook link.
Macadamia & Milk Chocolate Cookies
 Source: Mintel, 2020
| Company | Desserts On Us Baklava |
|---|---|
| Brand | Desserts On Us Laceys |
| Category | Bakery |
| Sub-category | Sweet biscuits/cookies |
| Market | Canada |
| Store name | Costco |
| Store type | Club store |
| Date published | December 2018 |
| Launch type | New packaging |
| Price in local currency | Can$13.99 |
| Price in US dollars | 10.45 |
Desserts On Us Laceys Macadamia & Milk Chocolate Cookies have been repackaged. The product is said to be deliciously irresistible, and retails in a 709 gram pack.
Okinawa Brown Sugar Grass Jelly Deluxe
 Source: Mintel, 2020
| Company | AGV |
|---|---|
| Brand | AGV |
| Category | Desserts and ice cream |
| Sub-category | Shelf-stable desserts |
| Market | Canada |
| Store name | Price Smart |
| Store type | Supermarket |
| Date published | June 2020 |
| Launch type | New product |
| Price in local currency | Can$9.99 |
| Price in US dollars | 7.09 |
AGV Okinawa Brown Sugar Grass Jelly Deluxe is described as a healthy and light dessert with red bean, mung bean and brown sugar flavoured jelly. It contains brown sugar molasses and honey to help maintain beauty. This ISO 22000 and HACCP certified product is said to be chewy and tender, is free from sodium bicarbonate, artificial colourings and preservatives, and retails in a pack containing six 340 gram units with disposable spoons.
For more information
The Canadian Trade Commissioner Service:
International Trade Commissioners can provide Canadian industry with on-the-ground expertise regarding market potential, current conditions and local business contacts, and are an excellent point of contact for export advice.
More agri-food market intelligence:
International agri-food market intelligence
Discover global agriculture and food opportunities, the complete library of Global Analysis reports, market trends and forecasts, and information on Canada's free trade agreements.
Agri-food market intelligence service
Canadian agri-food and seafood businesses can take advantage of a customized service of reports and analysis, and join our email subscription service to have the latest reports delivered directly to their inbox.
More on Canada's agriculture and agri-food sectors:
Canada's agriculture sectors
Information on the agriculture industry by sector. Data on international markets. Initiatives to support awareness of the industry in Canada. How the department engages with the industry.
Resources
- Mintel, A year of innovation in sweet & savoury spreads, 2019, Mikolaj Kaczorowski, June 4, 2019.
- Mintel's Blog, Covid-19 to accelerate ready to drink (RTD) tea flavour trends
- Mintel Market Sizes – Market segmentations
- Statistics Canada, Production and value of honey, 2019
Product Launch Analysis – Honey as an ingredient in Canada
Global Analysis Report
Prepared by: Laurie Bernardi, International Market Research Analyst
© Her Majesty the Queen in Right of Canada, represented by the Minister of Agriculture and Agri-Food (2021).
Photo credits
All photographs reproduced in this publication are used by permission of the rights holders.
All images, unless otherwise noted, are copyright Her Majesty the Queen in Right of Canada.
To join our distribution list or to suggest additional report topics or markets, please contact:
Agriculture and Agri-Food Canada, Global Analysis1341 Baseline Rd, Tower 5, 3rd floor
Ottawa ON K1A 0C5
Canada
Email: aafc.mas-sam.aac@agr.gc.ca
The Government of Canada has prepared this report based on primary and secondary sources of information. Although every effort has been made to ensure that the information is accurate, Agriculture and Agri-Food Canada (AAFC) assumes no liability for any actions taken based on the information contained herein.
Reproduction or redistribution of this document, in whole or in part, must include acknowledgement of agriculture and agri-food Canada as the owner of the copyright in the document, through a reference citing AAFC, the title of the document and the year. Where the reproduction or redistribution includes data from this document, it must also include an acknowledgement of the specific data source(s), as noted in this document.
Agriculture and Agri-Food Canada provides this document and other report services to agriculture and food industry clients free of charge.