
November 28, 2014
Report: Office of Audit and Evaluation
List of Acronyms
- AAFC
- Agriculture and Agri-Food Canada
- APP
- Advance Payments Program
- FGPD
- Financial Guarantee Programs Division
- CBSP
- Cull Breeding Swine Program
- COOL
- Country of Origin Labelling
- CPC
- Canadian Pork Council
- HILLRP
- Hog Industry Loan Loss Reserve Program
- HFTP
- Hog Farm Transition Program
- GDP
- Gross Domestic Product
- OAE
- Office of Audit and Evaluation
Executive Summary
Between early 2006 and 2009, the Canadian hog and pork sector experienced a period of rationalization and consolidation, losing 28 percent of its hog farms and 20 percent of its hog inventory. In 2009, to aid the hog and pork industry facing a revenue and income crisis, Agriculture and Agri-Food Canada (AAFC) announced the launch of the Hog Industry Loan Loss Reserve Program (HILLRP) and the Hog Farm Transition Program (HFTP) as complements to their Business Risk Management programs.
- The Hog Industry Loan Loss Reserve Program (HILLRP) was a $411.3 million (Vote 1 and Vote 10) five year (2009-2014) program of which $404 million loan reserve was allocated for producer loan support, intended to assist viable hog operations with their short term liquidity pressures by encouraging lenders to provide producers with long term loans Within AAFC, the HILLRP Program was managed by the Financial Guarantee Programs Division (FGPD) of the Finance and Renewal Programs Directorate.
- The Hog Farm Transition Program (HFTP) was a $82.5 million (Vote 1 and Vote 10) five year (2009-2014) program intended to assist hog producers to exit the industry for a minimum of three years of which $75 million was allocated for producer transition payments over 2 years 2009-11. The HFTP was administered and managed by the Canadian Pork Council (CPC) on behalf of the Program Design and Performance Division of the Business Development and Competitiveness Directorate of Agriculture and Agri-Food Canada. A tender process was implemented by an independent accounting firm, Welch LLC, on behalf of CPC.
Findings Related to Program Relevance
There was a need for the programs at the time they were launched. In the latter part of the 2000’s, the hog industry was facing a prolonged oversupply situation with low prices and high operating costs, and conditions were exacerbated by: the global 2008 economic crisis; the rapidly rising Canadian-United States (US) dollar exchange rate; the high price of hog feed; swine flu (H1N1); and, labor availability and wages. The HFTP and HILLRP were introduced as temporary programs in 2009-2010 as a supplement to the Cull Breeding Swine Program (CBSP), and were implemented in addition to AgriStability, AgriInvest and the Advance Payment Program (APP) with the aim of contributing to shorter-term viability of the industry that would allow for longer-term sustainability.
The objectives of HILLRP and HFTP were closely aligned with federal government priorities and AAFC strategic outcomes at the programs’ inception and throughout their duration.
The objectives of the HILLRP and HFTP were also closely aligned with federal roles and responsibilities. As stated in the 2013-14 AAFC Report on Plans and Priorities, the role of AAFC is to "help ensure that agriculture, agri-food and agri-based products industries can compete in domestic and international markets." AAFC had the legislative authority to create programs under the Farm Income Protection Act (FIPA) and took the responsibility of developing the HFTP and the HILLRP, in close consultation with the CPC and the financial institutions.
Findings Related to Program Effectiveness
Records of the HFTP and HILLRP participants were matched with AgriInvest and AgriStability program data to obtain more information about HFTP and HILLRP recipients’ financial situation from 2005 to 2012. Analysis showed HFTP participants’ median profit margin (that is the ratio of net operating income to total revenues) rose between 2009 and 2012 while their median net operating income almost doubled from 2009 to 2012. In 2012, not only did almost all HILLRP participants remain in the farming business, but they also saw their median profit margin increase and the median of their net operating income rise to a level close to what was reported for all Canadian hog operations in that year.
Findings Related to Design and Delivery
For the HFTP, AAFC built on the existing relationship between CPC and Welch LLP, their contracted agent, that resulted in a quick turnaround of 60 days between the announcement and the launch of the program, and contributed to the timely distribution of program funds.
Interest accrued on the HILLRP Reserve Fund is forwarded to the Government of Canada’s Consolidated Revenue Fund (CRF) quarterly. Participating institutions calculate daily interest on the reserve fund balances and will contribute these amounts to the CRF in accordance with the contribution agreement. As of September 2014, the HILLRP reserve fund has accrued more than $9 million in interest.
1.0 Introduction
1.1 Purpose of the Evaluation
The Evaluation of the Hog Industry Loan Loss Reserve Program (HILLRP) and the Hog Farm Transition Program (HFTP) was conducted in accordance with the federal government’s 2009 Policy on Evaluation and the Financial Administrative Act requiring ongoing grant and contribution programs to be evaluated once every five years. The evaluation results are intended to inform related future programming.
1.2 Evaluation scope and methodology
1.2.1 Evaluation Scope and Issues
The period under study was the five fiscal year period covered by the programs; 2009-2010 through 2013-2014. Evaluation data were gathered for the entire period of the programs and, in some cases, also included the period leading up to the start of the programs.
With respect to relevance, the evaluation looked at the need for the programs focusing particularly on market conditions at the time of their launch, and their alignment with the priorities and strategic outcomes of AAFC and the Federal Government. With respect to performance, the evaluation assessed the achievement of outcomes, and the economy and efficiency of the programs.
1.2.2 Data Sources
Document and Data Review
A review of documents was undertaken to develop program profiles for the two programs and to present the context in which the programs were introduced and operated. The document review contributed to addressing relevance and performance issues. Documents included previous program reviews and audits as well as a variety of documents related to program design and activities such as: Performance Measurement Strategies, and Program Terms and Conditions. Databases used for analysis purposes were the Canadian Agriculture Dynamic MicroSimulation (CADMS) database and the AgriStability and AgriInvest Forecasting Model (AAFM) database.
Key Informant Interviews
Thirty-six interviews were completed as part of the evaluation. As shown in Table 1, interviewees included program staff, randomly selected financial institution representatives, Canadian Pork Council (CPC) representatives and Welch LLP, the contracted agent for HFTP, and randomly selected producers. Interviews contributed primarily to addressing issues of performance.
| Interviewee Category | Number of Interviewees |
|---|---|
| HFTP Staff | 2 |
| HILLRP Staff | 3 |
| HILLRP Financial Institutions: Credit Unions | 1 |
| HILLRP Financial Institutions: Chartered Banks | 2 |
| HILLRP Financial Institutions: Farm Credit Canada | 2 |
| HILLRP Financial Institutions: Canadian Bankers’ Association | 1 |
| Canadian Pork Council and its Contracted Agent | 3 |
| Producer Recipients of HILLRP Loans | 10 |
| Producer Recipients of HFTP Payments | 12 |
| Total | 36 |
Performance Data
HILLRP performance data were obtained from Financial Guarantee Programs Division (FGPD) annual reports as well as annual reports from participating financial institutions. Records of HFTP transfer payments were obtained from the CPC and the implementing accounting firm, Welch LLP.
An analysis of HILLRP and HFTP participants who also participated in AgriInvest or AgriStability was conducted to assess the financial wellbeing of program participants prior to and after program implementation. The analysis examined records of HFTP and HILLRP participants who took part in the AgriStability and/or the AgriInvest program in 2009. The analysis compared HILLRP and HFTP participants with other hog operations on a variety of financial indicators (including revenue and sources of revenue, operating income, profit margins, and program payments from the Government) in 2009 and in 2012. Related data and reports from sources such as Statistics Canada and the CPC were also used to examine hog farm and hog market performance prior to and after implementation of the programs.
1.2.3 Limitations of the evaluation
While program expenditures and pork export data were available, external factors such as product price, competitors’ actions and economic conditions made it difficult to directly attribute all findings related to performance to the HILLRP and HFTP.
1.3 Description of the Programs
Starting in 2006, Canadian hog and pork producers faced a revenue and income crisis prompted by a strong Canadian currency, rising feed prices, rising energy costs and low pork prices world-wide. The financial pressures on producers was intensified by the global economic crisis, declining exports to the United States and export market closures in 2009 due to the outbreak of influenza A (H1N1). To help address the situation, the government introduced two initiatives in support of hog producers:
- The Hog Farm Transition Program (HFTP): a $75 million transition payment five year (2009-2014) program intended to assist hog producers to exit the industry for a minimum of three years; and,
- The Hog Industry Loan Loss Reserve Program (HILLRP): a $404 million loan reserve five year (2009-2014) program intended to assist viable hog operations with their short term liquidity pressures by encouraging lenders to provide producers with long term loans.
1.3.1 Hog Farm Transition Program
Overview of the Program
Recognizing that the Canadian total herd size was larger than what the market could sustain, the HFTP was designed to help return the hog industry to a level of production that better reflected the changing realities of both the domestic and international markets by providing payments to Canadian hog producers who agreed to exit the industry for a period of at least three years.
A four-step process was established to distribute program funds: registration; tender; audit; and, payment. Producers were required to submit a registration form with supporting documentation to Welch LLP, the independent accounting firm contracted by the CPC to administer the program, in order to qualify to bid in the tender process. Forms and program information were made available to producers on October 8, 2009 through Welch LLP and the CPC website. Representatives from Welch LLP and CPC provided training to provincial associations prior to the launch of the program so associations could assist producers in accessing the program.
Tenders were solicited in four separate auctions between November 2009 and March 2010. Registered producers were invited to submit bids declaring the price per animal they were willing to accept to close their barns to hog production for a minimum period of three years. To ensure that producers involved in all aspects of production - from "farrow to finish" - could participate on an equal footing, an "animal unit equivalent" (AUE) calculation was introduced formulated from an analysis of production trends. AUE’s were based on the calculation that for every sow in inventory there would be 3.4 pigs from wean-to-30 kilograms and 7.1 pigs from 31 kilograms to market.
Auction participants were ranked from lowest bid per AUE to highest, and the winners of a given auction were the lowest bidders on the list up to the point where the predetermined auction financial cap was expended. The predetermined caps for the four auctions were approximately $10 million, $25 million, $25 million, and $15 million respectively. Payments were issued to the winning bidders on a per-AUE basis according to the number of animal units the producer had.
Audit procedures were developed to ensure compliance with the program terms and conditions. Audits and site inspections were conducted by Welch LLP throughout the implementation period of the program to monitor compliance with the 3-year production ban.
Management Structure
The HFTP was administered and managed by the CPC on behalf of the Program Design and Performance Division of the Business Development and Competitiveness Directorate of Agriculture and Agri-Food Canada. The tender process was implemented by Welch LLP on behalf of CPC.
Financial Resources
The total program expenditure over the five years was $76,138,903 comprised of $75,811,040 in contributions ($71,702,879 in direct payments to producers and $4,278,373 to the CPC for program administration and a revenue of $170,212 generated from the project), and $327,863 in departmental operational costs. The bulk of the spending occurred in the second year of the program. The allocation of program resources is shown in Table 2.
| 2009-2010 | 2010-2011 | 2011-2012 | 2012-2013 | 2013-2014 | Total | |
|---|---|---|---|---|---|---|
| Vote 1 – Program Administration Vote 10 – Contributions (including employee benefits and accommodation premiums |
||||||
| Personnel | 0 | 64,254 | 95,799 | 49,258 | 43,868 | 253,179 |
| Operations and Maintenance | 20,000 | 0 | 0 | 4,047 | 0 | 24,047 |
| EBP @ 20% | 0 | 12,851 | 19,160 | 9,852 | 8,774 | 50,637 |
| Total Vote 1 | 20,000 | 77,105 | 114,959 | 63,157 | 52,642 | 327,863 |
| HFTP Grants and Contributions Program Disbursements | 3,922,722 | 62,875,502 | 4,904,655 | 0 | 0 | 71,702,879 |
| Program Administration | 1,929,176 | 1,490,134 | 473,492 | 217,478 | 168,093 | 4,278,373 |
| HFTP Grants and Contributions Revenues (Interest Earned) | 0 | 0 | (146,314) | (14,230) | (9,668) | (170,212) |
| Total Vote 10 | 5,851,898 | 64,365,636 | 5,231,833 | 203,248 | 158,425 | 75,811,040 |
1.3.2 Hog Industry loan loss reserve program
Overview of the Program
The HILLRP was designed to increase access to credit for producers who could demonstrate the viability of their operations through a business plan and had a reasonable prospect of repaying loans within 15 years. The program was established to assist hog operations with their short term liquidity pressures by having the Government of Canada share the risk with financial institutions in consolidating short term debt into long term loans. Loans issued under the HILLRP were first used to reimburse any outstanding 2008-2009 hog advance under the Advance Payments Program (APP) in the case where the recipient of the eligible HILLRP loan had an advance outstanding. Participation in the program was open to all hog producers in Canada; however, hog operations benefitting from HFTP were not eligible for participation in HILLRP.
AAFC entered into contribution agreements with financial institutions to provide reserve-backed loans to hog producers. For each loan registered, AAFC deposited a portion of the value of the loan in a reserve fund account with the lender. The value of the reserve for each lender was calculated as follows:
- 90% of the portion of the loan that was used to refinance outstanding 2008-2009 hog advances under the Advance Payment Program (APP);
- 60% of the portion of the loan that was used other than APP and that equaled or exceeded $2.5 million; and,
- 40% of the portion of the loan that was used for a purpose other than APP and that was less than $2.5 million.
All loans under the HILLRP are to be repaid by April 30, 2025. However, if at any time before April 30, 2025, a HILLRP loan becomes impaired and the lender decides to realize on the HILLRP loan, then only after completing collection activities as per regular commercial practices, can the lender draw a defined percentage of its net losses from its reserve fund account. The percentage of the draw is as followsFootnote 1:
- 90% of a loan loss, if the date the loan becomes impaired falls within the first 42 months, or 48 months if the Minister authorized a 6 months extension period, following the date of the last disbursement of the related loan;
- 80% of a loan loss, if the date the loan becomes impaired falls after the period referred to in paragraph a) but still within 78 months or 84 months if the Minister authorized a 6 months extension pursuant to paragraph a) following the date of the last disbursement of the related loan; and,
- 70% of a loan loss, if the date the loan becomes impaired falls after 78 months or 84 months if the Minister authorized a 6 months extension pursuant to paragraph a) following the date of the last disbursement of the related loan.
Lenders had the responsibility for assessing applications, extending and managing loan amounts in accordance with the program's terms and conditions, managing their reserve funds, and for any losses beyond those that could be drawn from the reserve fund. Lenders are required to pay to AAFC, interest on their reserve funds for as long as they hold the reserve funds.
Management Structure
Within AAFC, the HILLRP Program was managed by the Financial Guarantee Programs Division (FGPD). Resources dedicated to the program included a Program Manager and a Program Officer, supported by the Division Finance Manager. Oversight was provided by the Assistant Director, HILLRP and Advance Payments Program (APP) East, and the Director of the FGPD as well as the Director General of the Directorate. Management activities focused on implementing contribution agreements, reviewing and approving loan registrations provided by lenders, and calculating and monitoring the funds committed to the Loan Reserve.
Financial Resources
The total expenditure on HILLRP over five years was $241,050,505 comprised of $240,114,810 in contributions toward 263 reserve-backed loans to producers provided by 11 financial institutions, and $935,695 in departmental operational costsFootnote 2. The bulk of the spending occurred in the first two years of the program. The allocation of program resources is shown in Table 3. Following termination of the program, any outstanding reserve fund balance (with accrued interest) will be returned to the Government of Canada.
| 2009-2010 | 2010-2011 | 2011-2012 | 2012-2013 | 2013-2014 | Total | |
|---|---|---|---|---|---|---|
| Vote 1 – Program Administration and Support Vote 10 – Contributions (including employee benefits and accommodation premiums) |
||||||
| Personnel | 0 | 184,952 | 213,075 | 160,794 | 0 | 558,821 |
| Operations and Maintenance | 240,827 | 18,544 | 5,739 | 0 | 0 | 265,110 |
| EBP @ 20% | 0 | 36,990 | 42,615 | 32,159 | 0 | 111,764 |
| Total Vote 1 | 240,827 | 240,486 | 261,428 | 192,953 | 0 | 935,695 |
| HILLRP Grants and Contributions Disbursements | 246,409,120 | (2,608,623) | 0 | 0 | 0 | 243,800,497 |
| HILLRP Grants and Contributions (Excess amount of lender’s reserve fund) | 0 | 0 | 0 | 0 | (3,685,687) | (3,685,687) |
| Total Vote 10 | 246,409,120 | (2,608,623) | 0 | 0 | (3,685,687) | 240,114,810 |
1.3.3 Program Objectives
Through the implementation of the HFTP and HILLRP, AAFC aimed to advance its mandate to stabilize the agricultural industry and specifically the hog sector. The Farm Income Protection Act (FIPA) was the legislative authority used to implement these programs. The AAFC Strategic Outcome with which HFTP and HILLRP were most closely associated is: "A competitive agriculture, agri-food and agri-based products sector that proactively manages risk."
The HFTP was expected to contribute to the achievement of the following outcomes:
- Immediate Outcome: Compensation for hog producers that cease production for three years;
- Intermediate Outcome: Participating hog operations cease production for three years; and,
- End Outcome: Reduction in number of hogs produced in Canada.
The HILLRP was expected to contribute to the achievement of the following outcomes:
- Immediate Outcome: Reserve-backed loans provided to viable hog producers;
- Intermediate Outcome: Viable hog operations continue to operate during the industry downturn; and,
- End Outcome: Viable hog operations are positioned to benefit from improving market conditions.
2.0 Relevance
2.1 Demonstrated Need for the Programs
The pork industry in Canada accounts for some 45,000 jobs at the processing, farming and other supplier levels, and over $300 million in tax revenues. The pork industry’s contribution to Canada’s gross domestic product is estimated at $3.5 billion (2012 figures)Footnote 3. In 2009, Canadian pork exports (including products and live animals) were worth $2.96 billion. Historically, Canada’s hog industry has been successful with solid production and strong domestic and export markets. In terms of production, Canada’s industry has been characterized by:Footnote 4
- availability of fertile arable land, abundant, clean water and a climate conducive to hog production efficiency;
- a mature and efficient production and marketing infrastructure;
- a proven management and entrepreneurial foundation with a scientific and research base; and,
- a pork and hog marketing business climate based on supply-demand pricing, as well as open competitive markets and good access to the US and world markets.
In the latter part of the 2000’s, the hog industry faced a prolonged oversupply situation with low prices and high operating costs, and conditions were exacerbated by:
- the global 2008 economic crisis that limited liquidity and producers’ capacity to obtain credit;
- the rising Canadian-US dollar exchange rate affecting the price of inputs (for example machinery, fuel) - after a period of relatively favorable exchange rates had stimulated the expansion of the hog industry (through exports);
- the high price of hog feed (which represents up to 70 percent of the cost of raising hogs) due to increasing grain prices on the world market;
- labor availability and wages;
- swine flu (H1N1) that led to the issue of the closure of borders to hog exports (US, Japan) and lower consumer demand; and,
- regulatory issues in export markets such as the mandatory Country of Origin Labeling (COOL) in the USFootnote 5 that was having an impact on exports with no capacity for the domestic market to absorb the excess production.
Consequently, in 2009, producers had lost money for two years on every hog they were selling and many hog producers faced a prolonged situation of negative cash flow. The protracted period of negative cash flow had the potential of leading to a collapse in the industry that could have profound negative economic and social impacts.
Letting the markets regulate itself would likely have resulted in a high level of bankruptcies and serious problems on farms (for example the proper disposition of animals)Footnote 6. Historically, governments around the world have used different programs to help producers stabilize markets during turbulent periods. Europeans essentially provide income stabilization - while Canada typically uses insurance or agricultural stability programs to deal with temporary issues in an industry regulated by market conditions.Footnote 7
In 2009 a large percentage of hog producers (up to 85 percent) were recipients of the broader support provided to Canadian farmers through AgriStability, AgriInvest, and the Advance Payment Program (APP).Footnote 8 The Government of Canada and hog industry representatives felt that the existing suite of Business Risk Management (BRM) programs available in 2009 were not designed to restructure the hog industry.Footnote 9 The Cull Breeding Swine (CBS) Program, launched in 2007, aimed to address the need for restructuring of the industry. The CBS was based on a partial reduction of production from each producer by diminishing the number of sows at a fixed price per sow. According to the final evaluation report for that program:Footnote 10
The program enabled an accelerated cull of breeding swine in Canada of 8.4% of the total stock, just short of the 10% target set for the Program. The Program succeeded in assisting producers who wanted to exit the industry in downsizing their operations. However, the design of the Program did not appear to focus on meeting the objective of helping to return the industry to a competitive position. The industry continues to experience challenges for producers to generate profitable and sustainable operations. Nevertheless, an overall consensus was found that the Program was a step in the right direction in assisting producers who no longer wanted to participate in the hog production industry.
As the CPC noted that hog industry rationalization and consolidation undertaken was not enough to enable the sector to weather the global economic crisis that began in 2008, they developed strategic transition plan for the industry to weather the crisis.Footnote 11 CPC suggested a plan that called for the creation of a program that would further aid the industry to reduce its collective herd size via a complete cessation of hog production in all forms/stages of production by participants willing to leave the industry. Taking some producers out of the market was expected to improve the conditions for those staying in the business. However, that only dealt with the production of hogs. The CPC also noted there was a need to deal with debt level of producers, which was just as critical.
The CPC reported that many hog producers were having trouble securing bank financing and supplier credit due to the extended revenue crisis and ongoing uncertainty (for example, recession, H1N1 impacts, and so on). Financial Institutions confirmed that the value of assets on hog farms had dropped and businesses had lost their capacity to service short-term debt. The CPC and other industry representatives foresaw a loss of critical mass in the hog production sector in the absence of short term assistance to help remaining producers weather the economic crisis. Such a loss of critical mass would have further undermined the competitiveness of the processing sector, to which Canadian hog producers could sell their products to, making it difficult for the industry to rebound in the future.
CPC’s strategic transition plan appealed for additional steps needed for otherwise viable operations that had higher levels of debt and no equity left because of the economic downturn. Some producers, especially larger producers, could not exit the industry even if they had wanted to because their debts were too large. Providing lenders with government reserve-backed loan guarantees was the only way to persuade financial institutions to extend loans to hog producers over the longer term. To increase lending to hog producers under uncertain market conditions, lenders needed to be assured that significant losses on loans would not be incurred.
Speed of the intervention was critical because many operators were close to bankruptcy. In response, as the existing BRM program suite was not designed to achieve the strategic objectives of the CPC’s strategic plan of restructuring the industry, the Canadian government developed the $75 million HFTP program and the $404 million HILLRP program.
2.2 Alignment with Government and Department Priorities
2.2.1 Alignment with Federal Government Priorities
Agriculture and Agri-Food Canada’s Mandate
HILLRP and HFTP were aligned with federal government priorities and AAFC’s mandate to stabilize the agricultural industry. The Farm Income Protection Act (FIPA) provided the legislative authority to put the programs in place. The programs aimed to promote a viable, competitive agricultural sector.
HILLRP and HFTP were aligned with departmental strategic outcomes in AAFC's Program Activity Architecture (PAA). The 2009-2010 PAA linked Business Risk Management (BRM) programs to the strategic outcome of "a competitive agriculture, agri-food and agri-based products sector that proactively manages risk". The aim of HILLRP was to assist otherwise viable producers to manage short-time debt through conversion to longer-term loans and restructure their businesses as necessary to proactively take advantage of future market opportunities. The goal of HFTP was to help in the short-term to reduce the hog supply by assisting less viable producers to leave the industry and thereby improve the longer-term sustainability of the sector.
Agriculture and Agri-Food Canada’s Strategic Objectives
Growing Forward, the agriculture policy framework in place in 2009, was a shared initiative between federal and provincial/territorial governments seeking to build a competitive, innovative, and profitable agricultural sector with appropriately managed risks.Footnote 12 A key component of Growing Forward was the Business Risk Management (BRM) initiative including a set of programs providing producers with effective tools to manage business risks that are largely beyond their control, such as drought, flooding, low prices, and increased input costs, and remain competitive within the agricultural sector, thereby helping them to stabilize their farm income. HFTP and HILLRP complemented the core BRM programs and supported Growing Forward.Footnote 13
HFTP and HILLRP provided an important support for the improvement and development of agricultural operations during a crisis. The BRM programs along with HFTP and HILLRP cohesively promoted a secure and competitive agricultural sector. HFTP and HILLRP helped producers take the actions necessary toward restructuring with the aim of the longer-term sustainability of the sector.
2.3 Alignment with Federal Roles and Responsibilities
The crisis facing the hog industry was a problem national in scope and it was important to have a national intervention that eliminated any potential competition between the provinces. Industry organizations could not have dealt with the issue in part because of resource (organizational and financial) implications, but also because this would have been outside their mandate.Footnote 14 In the 2012 evaluation of AgriStability and AgriInvest, the importance of the Federal Government’s role in supporting agriculture production and market development was noted.
The Federal Government did not assume responsibilities for the HFTP that could have been left in the hands of the industry. AAFC had clear objectives and conditions as to how the funds would be distributed (for example the auction process), and was an active participant in the program management team that oversaw both the development and implementation of the program. AAFC provided a lot of flexibility for the day-to-day operations of the programs through CPC and Welch LLP. With HILLRP, the Federal Government again did not take on responsibilities that the private sector could assume. While the program was managed by AAFC, lending was done by financial institutions. The program provided financial guarantees to financial institutions for long-term loans. The program used a strong strategy in risk sharing, relying on good lending practices and expected producer viability based on business plans.
The indirect approach of the HILLRP that provided loans through financial institutions allowed AAFC to avoid using direct payments/subsidies to producers remaining in the industry, which would have been counter to trade rules/agreements and could have created conditions for the imposition of countervailing import duties by trade partner countries.Footnote 15
Duplication or Overlap with Other Programs, Policies or Initiatives
In introducing the HILLRP and HFTP, the Government was aiming to provide short-term interventions for the hog industry that might address the need for immediate financial liquidity for producers and reduced supply of pork for three years, and at the same time helping to position Canada’s hog industry to be more competitive in the longer-term. The programs were not designed to enable producers to maintain or increase production at reduced cost (that is, to manipulate the producers’ competitive positions in the market), to stop industry consolidation that was already underway, or to reach a pre-determined number of market players. The programs were introduced to contribute to the efficient performance of the Canadian hog industry as a whole.Footnote 16
In essence, the two programs were short-term initiatives that responded to a need for improved hog market efficiencies stemming from specific economic (global recession) and market (lack of financial liquidity and product oversupply) problems. Unlike more permanent agricultural and agri-food programs such as AgriInvest and AgriStability, HILLRP and HFTP were not intended to protect producers from reductions in income during cyclical downturns.Footnote 17 As profit margins and margins in the industry were shrinking rapidly at the time because of the prolonged downward market situation, the amount of financial support available under AgriStability was decreasing, thereby limiting the options for producers.
The existing AAFC programs, and specifically the AgriStability, AgriInvest and Advance Payments Program (APP), were being used by a majority of the producers that participated in HILLRP or HFTP. Hog association representatives and producers indicated that many hog farmers had already accessed short-term loans under the Advance Payments Program (APP) and had no equity left, with reduced or negative profitability because of the prolonged nature in the downturn of the market.
As financial support available under AgriStability was decreasing and the fact that many producers were already involved with APP, producers had essentially become ineligible for further assistance through the existing programs. HILLRP provided immediate financial relief to producers willing and able to remain in the industry as a viable entity by restructuring short-term debt (including APP loans) into long-term debt. HFTP helped producers unwilling or unable to remain in the industry with a means to pay their debts and close operations.
3.0 Achievement of Expected Hog Farm Transition Program Outcomes
3.1 Provision of Compensation for Hog Producers
The program’s expected immediate outcome was: providing compensation for hog producers that cease production. A total of 848 producers registered for the HFTP which represented 11.5 percent of the population of hog producers at that time. Of the 848 producers registered, 798 were issued bid formsFootnote 18, 726 submitted bids, and 446 had their bids accepted. Table 4 shows the geographic distribution of HFTP payments compared to the distribution of hog producers and total Canadian herd size in each region in 2009. The distribution of HFTP payments across provinces roughly reflected the number of producers and size of herds in each province, with the exception of Quebec for two reasons. First, the more prevalent use of contract finishers reduced take-up as these operations were not eligible for the program.Footnote 19 Second, the Farm Income Stabilization Insurance Program (ASRA) was available in the province since 2001 and further reduced uptake of the program. The evaluation found the program was accessible to producers across the country.
| Province | % of all HFTP Payments Made to Producers | % of Hog Producers in Each Region of Canada | % of Herd Size in Each Region of Canada |
|---|---|---|---|
| Alberta | 13% | 14.5% | 11.7% |
| Atlantic | 6% | 0.1% | 1.2% |
| British Columbia | 6% | 9.3% | 0.9% |
| Manitoba | 23% | 10.6% | 21.2% |
| Ontario | 34% | 31.7% | 25.6% |
| Québec | 9% | 23.5% | 31.9% |
| Saskatchewan | 9% | 10.3% | 7.4% |
| Total | 100% | 100% | 100% |
Given that 39 percent (280) of producers who had submitted bids were not successful, some producers and key informants from CPC suggested that the program could have helped more producers if more money had been made available. However, reducing the number of producers in the industry was not an objective of the program. Instead, the program targeted a reduction in hog inventories. The level of participation from hog producers was adequate given that all program funds were expended. In fact, the document review revealed that the cumulative value of submitted bids for each tender exceeded the compensation amounts available through the auction.Footnote 21
3.2 Hog Operations Ceasing Production
HFTP’s intermediate outcome was: participating hog operations cease production for three years. Program documentationFootnote 22 reveals that hog producers who won their bids closed their operations. Operations were still closed as of 2013 and all producers who were interviewed indicated that they were not planning to reopen their hog operations. In accordance with the contribution agreement, producers who received payments under the program were randomly selected for monitoring inspections. By the end of the program, 403 monitoring inspections had been conducted, and the overall compliance rate for the program was 100%.Footnote 23
Nearly three-quarters of producers who participated in HFTP had fewer than 200 AUEs; these could be considered small-scale operations and likely primarily sold live hogs.
3.3 Reduction of Hogs Produced
The program’s expected long-term outcome was: a reduction in the number of hogs produced in Canada. At the time the program was launched, CPC estimated that the industry needed to reduce its production by 6.5 million hogs, from 32 million to 25.5 million hogs. Program architects believed that HFTP could contribute to reducing the national herd size.
The $75.8 million of funding allocated for the program (transition payments and program implementation) led to a reduction in the hog inventory by 803,726 animals. Of these animals 124,475 were sows which would not normally be removed from the herd - that is, because sows are typically retained for breeding. On average each sow produces 20 offspring per year resulting in a substantial multiplier effect associated with sow reductions. The reduction of 124,475 sows is the equivalent of 2.7 million fewer new animals; suggesting the program indirectly removed closer to 2.8 million from the hog inventory.
Table 5 shows the annual hog production in Canada from 2008 to 2012. As indicated by table 5, Canadian hog production decreased from 31 million head in 2008 to approximately 27 million head in 2012; a net decrease of 4.1 million animals between 2008 and 2012. Canadian annual hog production recorded a particularly marked negative growth rate between 2009 (minus 9.27% growth) and 2010 (minus 3.99% growth); the two years that correspond with the bulk of HFTP implementation activities. The data suggests the program contributed to curbing an otherwise expected growth in hog supply over the 2010 to 2012 period.
| Year | Annual Production Estimates | Growth Rate (from previous year) |
|---|---|---|
| 2008 | 31,060,900 | −0.76% |
| 2009 | 28,179,000 | −9.27% |
| 2010 | 27,053,800 | −3.99% |
| 2011 | 27,080,100 | 0.09% |
| 2012 | 26,957,000 | −0.45% |
This analysis shows that the program met its target of a reduction of the hog inventory by 10 percent using two analytical methods: first, by indirectly removing 2.8 million from the hog inventory, representing a reduction of 9 percent of the total herd; and, second by Canadian hog production statistics reflecting a reduction of 13 percent taking into account the reduction of 2009 and 2010.
3.4 Overall Effectiveness of Hog Farm Transition Program
An analysis was undertaken to examine the characteristics of the farms enrolled in HFTP comparing them to Canadian hog farms in general and examining key financial indicators relating to participants’ farms before and after the implementation of the programs. Records of HFTP participants from Alberta, Manitoba and Ontario were matched with AgriInvest and AgriStability program dataFootnote 25 to obtain information about HFTP participants’ financial situations from 2005 through 2012. A total of 325 participants were matched out of the 446 who participated in HFTP and used in this analysis.
Figure 1 illustrates the decline of HFTP participants’ hog sales from 2005 to 2012. This decrease became steeper from 2009, when the HFTP was introduced. From 2009 to 2012, total hog sales of the 325 HFTP participants went from $76 million to $5.3 millionFootnote 26. Most HFTP participants reported farming income in 2012. Figure 2 shows that the contribution of hog sales to their market revenues plummeted to virtually zero. While many participants took advantage of the program to exit farming, most of them used it to transition into other productions.
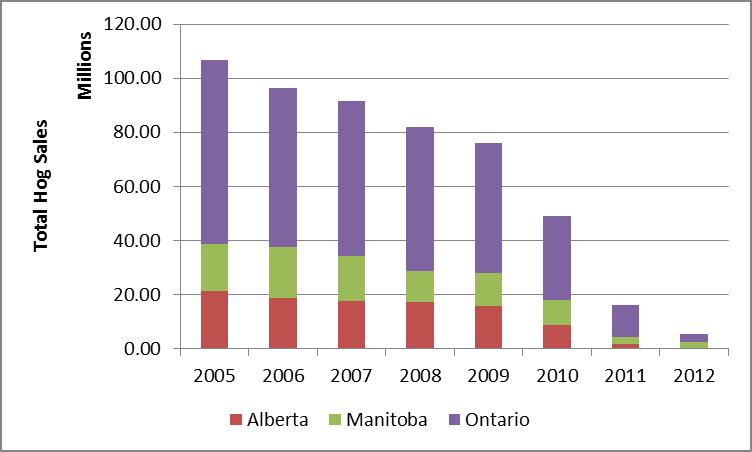
Description of Figure 1
Figure 1 shows Total Hog Revenues for the years 2005 to 2012 for Alberta Manitoba and Ontario.
The contents of the figure are as follows:
Alberta total hog sales:
2005 – 21,254,492
2006 – 18,680,081
2007 – 17,672,818
2008 – 17,103,215
2009 – 15,723,642
2010 – 8,649,948
2011 – 1,700,325
Manitoba hog sales:
2005 – 17,599,746
2006 – 19,021,142
2007 – 16,497,505
2008 – 11,596,189
2009 – 12,218,121
2010 – 9,387,467
2011 – 2,592,439
2012 – 2,515,687
Ontario hog Sales:
2005 – 67,750,815
2006 – 58,676,501
2007 – 57,390,874
2008 – 53,424,192
2009 – 48,202,406
2010 – 31,038,956
2011 – 11,868,498
2012 – 2,827,000
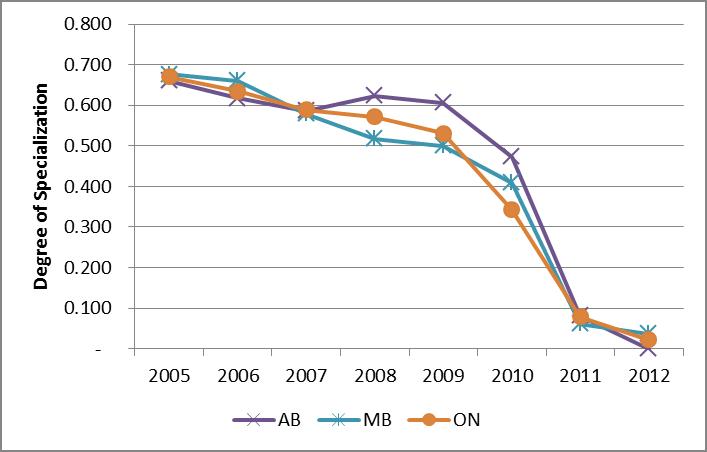
Description of Figure 2
Figure 2 shows the average contribution of hog sales to total revenues of HFTP participants by province, for Alberta Manitoba and Ontario from 2005 to 2012. The contents of the figure are as follows:
Alberta:
2005 - .661
2006 - .617
2007 - .586
2008 - .623
2009 - .606
2010 - .473
2011 - .081
2012 – 0
Manitoba:
2005 - .677
2006 - .660
2007 - .579
2008 - .518
2009 - .501
2010 - .409
2011 - .061
2012 - .037
Ontario:
2005 - .670
2006 - .634
2007 - .589
2008 - .572
2009 - .530
2010 - .343
2011 - .079
2012 - .022
Table 6 shows how HFTP participants compare to the population of Canadian hog farms. HFTP participants were relatively diversified operations, on average 54% of their market revenues came from hogs in 2009, compared to 92% for Canadian hog operations in general. They were smaller operations on average and the median participant had a net operating income lower than the median net operating income of hog operations in general. Most of HFTP participants were located in Ontario, but in proportion a greater share of Albertan hog farms participated in the program.
Among the 325 HFTP participants, 298 reported farming income in 2012, which represents 8% decrease compared to 2009. Due to data limitations, it is not possible to determine whether those participants exited farming or just ceased to participate to AgriStability and AgriInvest. The remaining HFTP participants seemed to have changed production since only 2% of their market revenues came from hog sales in 2012 compared to 54% in 2009. The median profit margin of HFTP participants went up in 2012 compared to 2009 when the program was implemented. The median net operating income of HFTP participants more than doubled between 2009 and 2012.
The overall number of hog operations in Canada decreased from 2009 to 2012. Over that period, the remaining hog operations received less program payments, more revenues from the market and their median profit margin increased. Over that three year period, the median net operating income of HFTP participants also improved.
| HFTP participants | All hog operations | |||
|---|---|---|---|---|
| 2009 | 2012 | 2009 | 2012 | |
|
* Ratio of net operating income to total revenues.
** Includes program payments |
||||
| Number of records | 325 | 298 | 3,700 | 2,680 |
| Average hog revenues (in $) | 234,290 | 17,928 | 891,888 | 1,484,764 |
| Average market revenues (in $) | 458,725 | 465,970 | 965,674 | 1,614,495 |
| Average share of market revenues from hog | 0.54 | 0.02 | 0.85 | 0.86 |
| Average program payments (in $) | 60,410 | 24,701 | 163,487 | 118,995 |
| Median profit margin* | 0.09 | 0.24 | 0.06 | 0.17 |
| Net operating income** (in $): 1rst quartile | −1,738 | 6,865 | −22,125 | 3,732 |
| Net operating income** (in $): Median | 19,692 | 40,073 | 23,654 | 72,962 |
| Net operating income** (in $): 3rd quartile | 71,450 | 99,290 | 117,268 | 228,596 |
| Number of operations located in: Alberta | 52 | 46 | 225 | 140 |
| Number of operations located in: Manitoba | 60 | 55 | 380 | 275 |
| Number of operations located in: Ontario | 213 | 197 | 1,305 | 890 |
Table 7 compares hog sales of HFTP participant to hog sales of all Canadian hog operations. From 2010 to 2011, the yearly decline of HFTP participants’ hog sales accelerated while hog sales of all Canadian hog operations increased.
| 2005 | 2006 | 2007 | 2008 | 2009 | 2010 | 2011 | 2012 | |
|---|---|---|---|---|---|---|---|---|
| Sources: AAFC, AAFM for data related to HFTP participants and CANSIM table 002-0044 for data related to all hog operations. * Hog operations are defined are farm that have at least 50% of their revenues that comes from hog sales. |
||||||||
| Sum of hog sales of HFTP participants [change compared to previous year] |
106.6 | 96.4 [−9.6%] |
91.6 [−5.0%] |
82.1 [−10.3%] |
76.1 [−7.3%] |
49.1 [−35.5%] |
16.2 [−67.1%] |
5.3 [−67.0%] |
| Hog sales of HFTP participants in Alberta | 21.3 | 18.7 [−12.1%] |
17.7 [−5.4%] |
17.1 [−3.2%] |
15.7 [−8.1%] |
8.6 [−45.0%] |
1.7 [−80.3%] |
0 [−100.0%] |
| Hog sales of HFTP participants in Manitoba | 17.6 | 19.0 [8.1%] |
16.5 [−13.3%] |
11.6 [−29.7%] |
12.2 [5.4%] |
9.4 [−23.2%] |
2.6 [−72.4%] |
2.5 [−3.0%] |
| Hog sales of HFTP participants in Ontario | 67.7 | 58.7 [−13.4%] |
57.4 [−2.2%] |
53.4 [−6.9%] |
48.2 [−9.8%] |
31.0 [−35.6%] |
11.9 [−61.8%] |
2.8 [−76.2%] |
| Sum hog sales of Canadian hog operations* [change compared to previous year] | 4,250.6 | 3,856.9 [−9.3%] |
3,701.8 [−4.0%] |
3,458.7 [−6.6%] |
3,300.0 [−4.6%] |
3,467.2 [5.1%] |
4,137.4 [19.3%] |
3,979.0 [−3.8%] |
| Hog sales of Canadian hog operations: Alberta | 325.6 | 265.8 [−18.4%] |
233.5 [−12.1%] |
195.7 [−16.2%] |
189.0 [−3.4%] |
194.7 [3.0%] |
265.4 [36.3%] |
213.3 [19.6%] |
| Hog sales of Canadian hog operations: Manitoba | 992.5 | 1,043.8 [5.2%] |
869.0 [−16.7%] |
731.7 [−15.8%] |
656.6 [−10.3%] |
693.5 [5.6%] |
833.3 [20.2%] |
801.3 [−3.8%] |
| hog sales of Canadian hog operations: Ontario | 1,070.3 | 949.1 [−11.3%] |
857.4 [−9.7%] |
836.2 [−2.5%] |
915.9 [9.5%] |
1,000.6 [9.2%] |
1,158.7 [15.8%] |
1,105.7 [−4.6%] |
As shown in Table 8, the average net operating income of HFTP participants more than doubled in 2010 compared to 2009, when the program was implemented. In the following years, the average net operating income remained higher than four years preceding the program. These higher net operating incomes mostly reflect higher market revenues.
| 2005 | 2006 | 2007 | 2008 | 2009 | 2010 | 2011 | 2012 | ||
|---|---|---|---|---|---|---|---|---|---|
| Alberta | Market revenue | 774.2 | 867.2 | 764.3 | 826.1 | 685.4 | 675.7 | 694.5 | 867 |
| Program payments | 44.4 | 50.6 | 84.2 | 123.8 | 194.7 | 75.1 | 82.9 | 33.2 | |
| Net operating income | 149.9 | 114.9 | 121.8 | 158.6 | 141.2 | 162 | 205.7 | 213.9 | |
| Manitoba | Market revenue | 433.8 | 465.3 | 468.7 | 408.3 | 464.7 | 380 | 298.5 | 359.2 |
| Program payments | 44 | 39.1 | 48.1 | 76.4 | 34.6 | 110.6 | 69.5 | 58.4 | |
| Net operating income | 58.2 | 46.9 | 23.7 | 23.7 | 21.3 | 132 | 62.6 | 93.2 | |
| Ontario | Market revenue | 449.3 | 408.7 | 430.1 | 440.1 | 401.7 | 359.3 | 390.2 | 402.1 |
| Program payments | 30.8 | 22.9 | 35.3 | 56.7 | 34.9 | 65.7 | 35.5 | 13.3 | |
| Net operating income | 74.7 | 44.7 | 37.1 | 45.7 | 39.5 | 98.6 | 107.2 | 79.6 | |
| Canada | Market revenue | 498.7 | 490.6 | 490.2 | 497.4 | 458.7 | 413.8 | 420.5 | 466 |
| Program payments | 35.2 | 30.1 | 45.4 | 71 | 60.4 | 75.4 | 48.8 | 24.7 | |
| Net operating income | 83.9 | 56.1 | 48.3 | 60.2 | 52.4 | 114.9 | 114.4 | 102.8 |
In summary, the overall number of hog operations in Canada decreased while the profitability of the sector improved in 2012 compared to 2009. Data show that HFTP participants’ financial situation improved after the implementation of the program. Their median profit margin (that is the ratio of net operating income to total revenues) went from 9% in 2009 to 24% in 2012. The median net operating income almost doubled from 2009 to 2012 (going from $19,692 to $40,073). Since few extreme observations have a big impact on the averages for profit margins and net operating income, medians are quoted since they appear to be a better indicator of central tendency.
3.5 Design and Delivery of Hog Farm Transition Program
3.5.1 Hog Farm Transition Program Design
According to an AAFC audit of the HFTPFootnote 29, no changes were made to the original design of the program. The design was effective and did not require any significant deviations from its original parameters. From an administrative point of view, there were some minor issues that were dealt with as they arose.
The tender process was not determined at the outset in the contribution agreement. It was established by the management committee (including AAFC representatives as non-voting members), the CPC and Welch LLP. The number of auctions was decided along the way - four were planned. The only major adjustments that were made to the original plan involved doing all four auctions in a single year instead of over two consecutive years, and putting back into the next bid all amounts allocated to winning producers who decided to withdraw their bids (which was allowed only once).Footnote 30 All producers participating in the tendering were informed at the end of each tender the total value of the distribution, as well as the low, high and average value of the AUEs for the winning bids. Unsuccessful bidders could then adjust their bids for the next round.
The evaluation found that the use of a national auction/tendering process was an effective way of rationalizing which producers were compensated for exiting the market. The program had found a way to allow producers to move out of the market without imposing too much of a burden on taxpayers (that is becoming a full subsidy program). The plan was to allow producers to decide for themselves what they needed to get out of the business rather than having to accept a fixed price per animal (as was the case with the Cull Breeding Swine Program). The use of the AUE allowed for a common per animal unit basis of comparison between different production types, configurations, and sizes of farms.Footnote 31 The tender process was well received by producers.
3.5.2 Economy and Efficiency of Hog Farm Transition Program Delivery
The evaluation found that the HFTP was administered well with minimal overhead costs. As previously stated total program expenditures over five years were $76,138,903, which included $71,702,879 in direct payments to producers and $4,278,373 to the CPC for program administration, and $327,863 in departmental operational costs, (Table 2). The evaluation did not include an audit or examination of CPC’s program administration; consequently, the evaluation cannot comment directly on the $4,278,373 administration expenditure. However, it should be noted that financial audits of the HFTP were prepared annually during the course of the program and at the end of the program, $677,322 was returned as unused administrative costs plus interest.
HFTP built on the existing relationship between CPC and Welch LLP, and leveraged the project management infrastructure and prior experience acquired from the delivery of the CBS. This relationship and prior experience resulted in a quick turnaround of 60 days between the announcement and the launch of the program, and contributed to the timely distribution of program funds.
3.5.3 Adequacy of Monitoring, Accountability and Reporting Practices
Representatives from AAFC and the CPC felt that the appropriate practices and mechanisms were in place to monitor the achievements of the program. The program management involved a Producer Advisory Group and a Management Committee (including AAFC representatives as non-voting members) reporting to the Board of Directors of the CPC. The Management Committee dealt with all program/policy decisions in the field, and was involved throughout in the design and implementation of the program. Weekly and bi-weekly meetings also contributed to the effective management of the program by the CPC in collaboration with AAFC.Footnote 32 The CPC hired Welch LLP to help manage the auction process. Welch LLP reported monthly on the results of the auctions during the first year and quarterly after that.Footnote 33 Recipient audits of financial statements were also done on a yearly basis, along with annual reports that were made public.Footnote 34 There was an interim evaluation, and a final evaluation was completed at the end of March 2014.Footnote 35
AAFC representatives felt that the accountability structures and practices were "mostly" or "entirely" adequate to ensure that the Management Committee had the capability of monitoring and influencing progress in program achievement. This view was supported by statements found in AAFC reports and external audit reports.
In summary, the evaluation found there to be appropriate practices and mechanisms, accountability structures and practices, and reporting structures and practices to monitor progress of program achievements.
4.0 Achievement of expected Hog Industry Loan Loss Reserve Program Outcomes
4.1 Provision of Reserve-Backed Loans to Viable Producers
The program’s expected immediate outcome was: Reserve-backed loans are provided to viable hog producers. AAFC had expected 20 to 23 percent of hog producers in Canada to participate in the HILLRP programFootnote 36 and the target for provision of HILLRP reserve-backed loans was $500 million. Overall, 263 HILLRP loans were issued during the life of the program, representing about three percent of farms with pigs.Footnote 37 Just over $408 million in loans were disbursed under the program. The number of producers accessing HILLRP and the total value of the loans were somewhat lower than anticipated. Program key informants suggested two possible reasons why demand for the program was less than anticipated: 1) many viable producers who were vertically integrated and diversified preferred to ride out the downturn without assuming more debt and/or increased interest rates; and 2) some producers with APP loans decided not to apply for a HILLRP loan in anticipation of a ministerial decision to extend the 2008-2009 livestock stay of default under the APP (advances limited to $400,000 with the federal government paying the interest on the first $100,000 of the advance), providing a more financially attractive option for producers than the long-term loans and the relatively higher interests rates of HILLRP.
Representatives from financial institutions confirmed that demand for the program was fuelled by viable producers since the program targeted producers needing short-term assistance for longer-term stability. Program criteria excluded producers involved in bankruptcy procedures, and further required that producers seeking HILLRP loans provide an acceptable business plan and be assessed by the financial institutions as able to repay the loans within the maximum limit of 15 years.
Different types of financial institutions participated in the program, including chartered banks, credit unions, and Farm Credit Canada (FCC). Among financial institutions that participated in the program, the largest number of loans was made by FCC. FCC loans accounted for 54 percent of all HILLRP loans made, representing 32 percent of the total value (Table 9). Chartered banks accounted for 55 percent of loans disbursed in terms of value, and 25 percent of HILLRP loans disbursed in terms of volume. Program representatives noted that some producers who were unable to qualify for a HILLRP loan through their chartered financial institution were subsequently redirected to the FCC by the Program. It is not possible to determine the proportion of registered producers that withdrew from the program as distinct from those whose loan requests were rejected by the lenders. For each loan registered under the program, AAFC deposited a portion of the value of the loan in a reserve fund account with each respective lender. So in other words, all lenders who issued loans under the HILLRP hold a HILLRP reserve account.
| Financial Institution | Volume of Loans Issued | Percentage of Total Number of Loans Issued | Value of Loans Issued | Percentage of Value of Loans Issued |
|---|---|---|---|---|
| * There were actually 263 HILLRP loans received by producers. Syndicated loans have been divided among financial institutions. | ||||
| Farm Credit Canada | 144 | 53.6 | $129,467,234 | 31.7 |
| Credit Unions | 56 | 21.1 | $55,912,366 | 13.7 |
| Banks | 68 | 25.3 | $222,729,046 | 54.6 |
| Total* | *268 | 100 | $408,108,646 | 100 |
Representatives from financial institutions indicated that the total amount and distribution of loans made under the program met their expectations. They also indicated that the distribution of loans mirrored the geographic distribution of producers throughout the country, except in Quebec where another provincial program was available.Footnote 39 The actual distribution of HILLRP loans by province in terms of number and value is shown in Table 10.
| Province | Percentage of Loans | Percentage of Value of Loans |
|---|---|---|
| Alberta | 10% | 8% |
| British Columbia | <1% | <1% |
| Manitoba | 15% | 34% |
| New Brunswick | 1% | 2% |
| Newfoundland | <1% | <1% |
| Nova Scotia | 2% | 2% |
| Ontario | 51% | 20% |
| Prince Edward Island | 1% | <1% |
| Québec | 17% | 18% |
| Saskatchewan | 3% | 17% |
| Total | 100% | 100% |
4.2 Viable Hog Operations Continue to Operate
HILLRP’s intended intermediate and end outcomes are similar: viable hog operations would continue to operate during the industry downturn with a target that 80 percent of hog producers who received reserve-backed loans continue to repay the loans without defaulting in the first 12 months (intermediate outcome) and that viable hog operations are positioned to benefit from improving market conditions with a target that 65 percent continue to repay the loans without defaulting in the first 36 months (end outcome). The status of HILLRP loans as of August 2014 indicates that 5 years after program implementation, the program had met its immediate and intermediate outcomes as shown in Table 11.
| Number | Amount ($) | |
|---|---|---|
| N/A = not applicable * Loans made under the program for which collection efforts have had to be made. ** Declared in default, with financial institutions exercising the guarantee offered by the program |
||
| Loans Issued | 263 | $408,108,646 |
| Value of Original Reserve | N/A | $243,800,487 |
| Fully Reimbursed Loans | 62* | $37,343,393 |
| Outstanding Loans in Good Standing (Not including Impaired Loans) |
177* | $178,931,061 |
| Outstanding Impaired Loans | 9 | $39,164,709 |
| Principal of Outstanding Loans when they Became Impaired Withdrawals from reserve (Closed) |
9 | $101,333,645 |
| Withdrawals from Reserve | 15 | $21,732,894 |
| Value of Outstanding Amount in Reserve | N/A | $222,067,593 |
| Interest Accumulated from Financial Institutions | N/A | $9,389,935 |
Referencing the August 2014 report on the status of HILLRP loans, of the total 263 loans, 62 loans have been fully reimbursed and 177 outstanding loans are in good standing. This makes the total percentage of hog producers receiving reserve-backed loans that continue in the first 36 months to repay the loans without defaulting at 91%; above the program set target of 65%. When reviewing the loan status amounts, the percentage of reserve-backed loans that continue in the first 36 months to be repaid without defaulting is at 53%Footnote 41. This suggests just under half of the loan amounts given to producers are impaired or are at risk of being impaired. The total value that could be withdrawn from the reserve remains unknown until the loans are in a full impaired status. A total of 15 withdrawals from the reserve have been made totaling approximately $21.7 million.
AAFC, financial institutions, and hog producer representatives agreed that HILLRP played a role in helping viable hog producers continue to operate for 12 months or more during the adverse market conditions while non-viable ones had to exit the industry through bankruptcy, sale, or other means. A number of producers interviewed noted that the program was effective in keeping HILLRP loan recipients in operation long enough for them to restructure their operations. Prices of hogs and hog products remained low for longer than expected after program implementation, adding to the value of the program as a stop-gap measure.
4.3 Overall Effectiveness of Hog Industry Loan Loss Reserve Program
An analysis was undertaken to examine the characteristics of the farms enrolled in HILLRP, comparing them to Canadian hog farms in general, and examining key financial indicators relating to participants’ farms before and after the implementation of the program. Records of HILLRP participants from Alberta, Manitoba and Ontario were matched with AgriInvest and AgriStability program dataFootnote 42 to obtain information about HILLRP participants’ financial situations from 2005 through 2012.
Ninety-five percent of HILLRP participants also participated in AgriStability and/or or AgriInvest in 2009. As indicted in Table 12, in 2009, HILLRP participants managed operations that generated more market revenues and hog revenues than the average of all Canadian hog operations. They had a greater share of their income coming from other commodities than hogs and received more program payments. Program participants had a median net operating income in negative territory while it reached $23,654 for all hog operations in Canada. Among HILLRP participants, half of them generated negative net operating margin in 2009, while 24% of all Canadian hog operations reported negative net operating income in that year.
In 2012, not only did HILLRP participants remain in the farming business, but they also saw their median profit margin increase to 7% and the median of their net operating income increase to $71,256, a level close to what is observed for all Canadian hog operations in that year. They mostly remained in the hog production industry with on average 75% of their market revenues originating from hog sales. Their average program payments were reduced by more than half in 2012 compared to 2009.
| HILLRP participants | All hog operations | |||
|---|---|---|---|---|
| 2009 | 2012 | 2009 | 2012 | |
|
Sources: AAFM and CADMS for all data related to HFTP participants, medians and the average share of market revenues that originates from hog sales. CANSIM table 002-0044 was used for the number of records and the remaining averages for all Canadian hog operations.
* Ratio of net operating income to total revenues. ** Includes program payments. |
||||
| Number of records | 175 | 174 | 3,700 | 2,680 |
| Number of records below breakeven point | 88 | 34 | 882 | 598 |
| Average hog revenues (in $) | 2,730,015 | 3,848,747 | 891,888 | 1,484,764 |
| Average market revenues (in $) | 3,157,185 | 4,126,144 | 965,674 | 1,614,495 |
| Average share of market revenue from hogs | 0.80 | 0.75 | 0.85 | 0.86 |
| Average program payments (in $) | 234,495 | 108,367 | 163,487 | 118,995 |
| Median profit margin* | 0.00 | 0.07 | 0.06 | 0.17 |
| Net operation income** (in $): 1rst quartile | −84,952 | 15,658 | −22,125 | 3,732 |
| Net operation income** (in $): Median | −830 | 71,256 | 23,654 | 72,962 |
| Net operation income** (in $): 3rd quartile | 66,903 | 214,296 | 117,268 | 228,596 |
| Number of operations located in: Alberta | 22 | 22 | 225 | 140 |
| Number of operations located in: Manitoba | 29 | 30 | 380 | 275 |
| Number of operations located in: Ontario | 124 | 122 | 1,305 | 890 |
Table 13 shows that the average net operating income of HILLRP participants deteriorated on average over the year that preceded the implementation of the program and it improved in 2011 and 2012. This improvement was observed in all provinces where hog operations enrolled in the program except in Manitoba, where the average net operating income dipped deeper during from 2008 to 2010 and was still in negative territory in 2012. To quantify how much of the change in the financial situation of HILLRP participants was due to the program and how much was related to the improvement of the hog market in 2011 and 2012, would require further analysis.
| 2005 | 2006 | 2007 | 2008 | 2009 | 2010 | 2011 | 2012 | ||
|---|---|---|---|---|---|---|---|---|---|
| Note: Net operating income includes program payments | |||||||||
| Alberta | Percentage of market revenues from hog sales | 93% | 89% | 85% | 81% | 79% | 82% | 81% | 81% |
| Market revenue | 3,707.40 | 3,580.10 | 3,552.50 | 3,541.90 | 3,701.70 | 4,027.30 | 5,061.40 | 5,577.50 | |
| Program payments | 71.5 | 176.5 | 307.2 | 866.9 | 325.1 | 173.4 | 147.4 | 91.7 | |
| Net operating income | 348 | 276.3 | 210.1 | −26.6 | −98 | −366.4 | 231 | 189.6 | |
| Manitoba | Percentage of market revenues from hog sales | 90% | 89% | 93% | 91% | 92% | 92% | 90% | 87% |
| Market revenue | 11,444.90 | 12,295.20 | 10,440.50 | 10,329.20 | 9,196.10 | 8,137.70 | 10,433.80 | 10,388.50 | |
| Program payments | 253.8 | 87.6 | 64.6 | 563.1 | 524.4 | 451 | 161 | 204.2 | |
| Net operating income | 1,877.10 | 1,670.60 | 867.3 | −205 | −174.1 | −1,211.20 | 494.1 | −639.2 | |
| Ontario | Percentage of market revenues from hog sales | 78% | 75% | 76% | 78% | 77% | 79% | 80% | 71% |
| Market revenue | 1,554.90 | 1,407.50 | 1,378.50 | 1,401.50 | 1,648.20 | 1,797.60 | 2,129.30 | 2,324.50 | |
| Program payments | 61.7 | 59.1 | 99.3 | 232.2 | 150.6 | 148.8 | 51.2 | 87.8 | |
| Net operating income | 146.6 | 22.5 | 2.5 | −15.7 | −16.6 | 20.6 | 117.8 | 96.8 | |
| Canada | Percentage of market revenues from hog sales | 82% | 79% | 80% | 80% | 80% | 82% | 82% | 75% |
| Market revenue | 3,307.40 | 3,246.10 | 2,862.50 | 2,935.30 | 3,157.20 | 3,149.30 | 3,901.30 | 4,126.10 | |
| Program payments | 91.7 | 77.1 | 117.6 | 358.1 | 234.5 | 203.1 | 81.7 | 108.4 | |
| Net operating income | 431.4 | 292.1 | 144.1 | −43.9 | −52.9 | −236.3 | 195.7 | −18.4 | |
4.4 Design and Delivery of Hog Industry Loan Loss Reserve Program
4.4.1 Hog Industry Loan Loss Reserve Program Design
With HILLRP, AAFC assumed management responsibilities for the program while the administration of loans was done by financial institutions. The Program’s approach integrated risk sharing, good lending practices, and assessments of producers’ viability based on business plans. The indirect approach of providing loans through financial institutions allowed AAFC to avoid direct payments/subsidies to producers staying in the industry, which would have been counter to trade rules and agreements.Footnote 43
The evaluation noted several novel and positive features of HILLRP that were critical to the achievement of program objectives:
- the requirement to have a business plan to demonstrate the viability of operations over the next 12 months;
- the broad lending criteria to accommodate the lenders; the program was effective in consulting producers and lenders in the design phase, thus arriving at a solution that could be attractive to industry and would not impose significant costs or implementation burden on lenders;
- no caps on interest rates although fears existed that interest rates would be too high. There were no complaints from the parliamentary committees, farmer associations or the AAFC to that effect, and few from producers; and,
- the possibility to make interest-only payments for the first two years, which was particularly helpful in providing additional liquidity for producers in dire financial situations.
Representatives from financial institutions who were interviewed agreed that:
- the reserve funding level established for HILLRP was sufficient to support loan requests by producers;
- lending criteria for the program were broad enough to accommodate the lenders; and,
- accounting and reporting procedures for the HILLRP were appropriate and well supported.
An issue with the approach of the program was:
- The balance of guarantee by the federal government was designed to decline over time, with the banks taking over more of the risks. There were some concerns (expressed later by program representatives and producers) that financial institutions might take action on farms and exercise the guarantee while farms were still covered by the loan guarantee period. Given the time horizon of HILLRP loans, it is too early to assess whether these concerns were founded.
A potential risk of the HILLRP program was that banks would roll short-term debts into long-term debts that are guaranteed, and decline to make further credit available to producers. AAFC ensured that the program’s terms and conditionsFootnote 44 prevented that type of action. As a result, financial institution representatives reported that HILLRP did not affect their institutions’ regular short-term lending to hog producers and there was no evidence collected in the evaluation to the contrary.
The performance measurement strategy developed for the HILLRP program used indicators and targets of the percentage of loans in good standing with no targets set to the value of the loans in good standing. The number of loans is only one proxy measure for the achievement of outcomes of the program. The value of the loan and its status would enable the program to better gauge a complete assessment of its outcomes. Hence, as such data would breach confidentiality of the recipients of the loans, such analysis was not able to be conducted.
4.4.2 Economy and Efficiency of Hog Industry Loan Loss Reserve Program Delivery
The evaluation found that HILLRP was administered well, with minimal overhead costs. As previously stated, program expenditures over five years totaled $241,050,505 comprised of $240,114,810 in contributions toward 263 reserve-backed loans to producers, and $935,695 in departmental operational costs, (Table 3). Financial institutions that participated in the program essentially absorbed overhead costs for the program, contributing to the economy of the program.
Repayment of any interest accrued on the HILLRP reserve fund is being forwarded to the Government of Canada’s Consolidated Revenue Fund (CRF) quarterly. Participating institutions calculate daily interest on the reserve fund balances and contribute these amounts to the CRF in accordance with the contribution agreement. As of September 2014, the CRF has accrued more than $9 million in interest.
The program was implemented as planned in the view of financial institutions. Two adjustments to the HILLRP terms and conditionsFootnote 45 were made by AAFC in order to expand lending activities by the financial institutions, namely:Footnote 46
- increasing the amount that AAFC would make available as financial reserve which was done to increase program uptake; and,
- extending the interest-only payments period which was done to help the few producers that were not able to start principal payments on schedule.
It remains unclear if these amendments actually increased producer participation in the program (that is increase the number and value of loans to eligible producers).
Satisfaction was expressed by the financial institutions regarding the support provided by AAFC, and their interactions with the department during the implementation of HILLRP. One important aspect of this collaboration was the inclusion of financial institutions on the HILLRP Monitoring Committee. Additionally, the responsible directorate within AAFC regularly communicated with financial institutions, and the department provided different types of supports including detailed Terms and Conditions for Contribution Payments, and HILLRP Lenders Guidelines.Footnote 47
The program’s governance mechanism, accountability structures and practices were adequate and ensured that managers had the capability of monitoring and assessing progress in the achievement of program outcomes. An Internal Audit of the HILLRP conducted by AAFC in 2010 confirmed that the governance, risk management and control frameworks established for the program were adequate, provided a reasonable expectation that funds would be used for their intended purpose, and could lead to the achievement of planned outcomes. Controls were in place for program payments, and payments were made in accordance with the provisions of the contribution agreements with financial institutions, program terms and conditions as approved by Treasury Board, and the Financial Administration Act. It was noted, however, that lending institutions’ reporting requirements to AAFC were limited to quarterly and annual reports including basic statistics on loan values, impairments and closures, but excluding additional data such as the reasons for the refusal of HILLRP loans.Footnote 48 This limitation constrained the types of analyses this evaluation could undertake in order to shed further light on the economy of the program.
5.0 Conclusions
The evaluation found that both HFTP and HILLRP were relevant in terms of their needs, alignment with federal government priorities and AAFC strategic outcomes, and alignment with federal roles and responsibilities.
In the latter part of the 2000’s, the pork industry was facing a prolonged oversupply situation with low prices and high operating costs. Programs such as the Cull Breeding Swine Program (CBSP), that were implemented in addition to existing AAFC business risk management programming of AgriStability, AgriInvest and the Advance Payment Program (APP), could not effectively aid the pork and hog industry through the economic crisis. The HFTP and HILLRP were introduced in 2009 with the aim of contributing to shorter-term viability of the industry that would allow for longer-term sustainability.
In terms of effectiveness, both HFTP and HILLRP were found to have achieved the objectives of short-term viability and long-term sustainability of the pork and hog industry.
HFTP achieved its intended outcomes. Its immediate outcome of providing compensation to hog producers was achieved within its first year with a total of 446 producers receiving compensation. The intermediate outcome of participating hog operations ceasing productions for three years was achieved with compensated producers being 100% compliant in keeping their barns closed. The program’s end outcome of reducing the number of hogs produced in Canada was achieved as the evaluation found the program aided in removing an estimated 4.1 million hogs from the hog inventory.
HILLRP also achieved its intended outcomes. By providing 263 loans, the program achieved its immediate outcome of reserve-backed loans provided to viable hog producers. The program’s intermediate outcome of 80 percent of viable hog operations continue to repay their loans without defaulting and end outcome of 65% of viable hog operations continue to repay their loans without defaulting can only be determined in 2025 when the program ends.
In terms of the effectiveness of the programs’ on the hog industry as a whole, the evaluation found that HFTP and HILLRP recipients’ financial situation from 2005 to 2012 improved. In 2012, not only did HILLRP participants remain in the farming business, but they also saw their median profit margin and net operating income increase to a level close to what is observed for all Canadian hog operations in that year.
The evaluation found that both programs were well administered with minimal overhead costs. HFTP was implemented in an expedited manner and its reporting structure and practices were entirely adequate for the purpose of monitoring of program achievement. HILLRP was found to have sound governance mechanisms, with strong support provided by AAFC to financial institutions during the implementation of the program.