
March 29, 2018
Abbreviations
- AAFC
- Agriculture and Agri-Food Canada
- R&D
- Research and Development
Executive summary
Purpose
This evaluation examines the relevance and performance of Agriculture and Agri-Food Canada's (AAFC) AgriInnovation Program Stream C: Enabling Commercialization and Adoption (henceforth called Stream C). It assessed the relevance and performance of Stream C, specifically focusing on results achieved by the program to date. The evaluation covers the period from fiscal year 2013-14 to 2017-18.
Methodology and scope
To assess the program's relevance and performance, the evaluation utilized multiple lines of evidence, including: program documents, files and performance data; comparative and matched pair analysis; a literature review; case studies; and interviews with AAFC representatives, external stakeholders, project recipients, and project applicants that did not obtain Stream C funding.
Background
Stream C was designed to facilitate the demonstration, commercialization and/or adoption of innovative products, technologies, processes or services in the agriculture, agri-food and agri-based products sector. The overall goal of Stream C is to increase sector competitiveness across the value chain and realize returns on investments made at earlier stages of the innovation continuum.
The program is offered as part of the AgriInnovation Program, a five-year Growing Forward 2 program (2013-14 to 2017-18) that brings together the pre-commercialization and commercialization stages of innovation. Programs with similar objectives were implemented previously, such as the Agri-Opportunities Program (2006-07 to 2010-11) and the Agri-based Processing Initiative (2009-10 to 2013-14). Stream C is delivered by funding the following three types of projects through interest-free, repayable contribution agreements with industry partners:
- Demonstration projects – up to $2-million in assistance to support activities at the commercialization stage of the innovation continuum and are designed to demonstrate the viability of a project to the market to facilitate commercial uptake
- Commercialization projects – up to $10-million in assistance to support activities to commercialize innovative products, technologies, processes or services in the agriculture, agri-food, and agri-based products sector
- Adoption projects – up to $10-million in assistance to support activities related to adoption of innovation in agriculture and agri-food sectors
The total budget allocated for Stream C is $137.3-million from fiscal year 2013-14 to 2017-18. Stream C projects are cost-shared with industry partners, up to 50% of eligible project costs.
Findings
AgriInnovation Program Stream C: Enabling Commercialization and Adoption remains relevant to facilitate the demonstration, commercialization and/or adoption of innovative agri-based products, technologies, processes or services in the agriculture, agri-food and agri-based products sector. The key evaluation findings are:
- Stream C helps Canadian agriculture and agri-food companies respond to market opportunities and productivity challenges through support for innovation. However, small enterprises, start-ups and emerging sectors need more support.
- Stream C aligns with federal roles, responsibilities and priorities to enhance sector competitiveness and bring innovation to market by addressing barriers to finance, attracting investment, and reducing risks for adoption and commercialization projects.
- Stream C complemented other government sources of funding, which have different mandates, to further reduce the financial risk and accelerate the demonstration, commercialization and adoption of innovation.
- Stream C is on track to meeting its expected outputs and outcomes. Stream C projects are reporting increases in revenues, productivity and savings; however, it is too early to assess long-term impacts as only 21 out of 45 projects have reported results.
- Stream C maintained low operational costs compared to similar programs, and its benefits exceed its costs.
- Stream C had attractive funding mechanisms, strong due diligence, and efficient processes but needs to address barriers faced by small enterprises, start-ups and emerging sectors. The Program could benefit from strengthening assurance mechanisms such as clarifying the definition of innovation, and broadening the definitions of commercialization success.
- There are gaps in communication between program staff and industry stakeholders. The Program could benefit from engaging in targeted face-to-face meetings, outreach at industry events such as Value Chain Roundtables, and establish formal networks with other federal and provincial government partners involved in commercialization and the modernization of value-added food manufacturing.
Recommendations
- Recommendation 1: Assistant Deputy Minister, Programs Branch, should explore options to improve access to the program for small enterprises, start-ups and emerging sectors undertaking commercialization.
- Recommendation 2: Assistant Deputy Minister, Programs Branch, should strengthen quality assurance mechanisms for performance data collection and management, and strengthen performance indicators to better measure the success of the program.
- Recommendation 3: Assistant Deputy Minister, Programs Branch, in collaboration with other Branches, should review industry communication strategies.
- Recommendation 4: Assistant Deputy Minister, Programs Branch, should review options to collaborate with other agencies (Federal, Provincial, Private lenders, and Non-profits) to leverage the expertise and resources (advice and assessment) to better respond to where investment is lacking and providing a sector wide approach to innovation.
1.0 Introduction
The evaluation of AgriInnovation Program Stream C: Enabling Commercialization and Adoption (henceforth called Stream C) was undertaken by AAFC's Office of Audit and Evaluation as part of the 2016-17 to 2020-21 Departmental Evaluation Plan. This evaluation fulfills a requirement of the Financial Administration Act and the Treasury Board Policy on Results. Stream C was designed to facilitate the demonstration, commercialization and/or adoption of innovative products, technologies, processes or services in the agriculture, agri-food and agri-based products sector. The results of this evaluation are intended to inform future program and policy decisions.
2.0 Methodology and scope
The evaluation was conducted in accordance with the Treasury Board Policy on Results and Directive on Results. It assessed the relevance and performance of Stream C, specifically focusing on progress on results achieved by the program from 2013-14 to 2017-18.
The evaluation utilized multiple lines of evidence, including: program document, file and performance data review; a comparative and matched pair analysis; a literature review; case studies; and interviews with AAFC representatives, external stakeholders, project recipients, and project applicants that did not obtain Stream C funding. The detailed evaluation methodology is in Annex A.
3.0 AgriInnovation Program: Stream C
3.1 Objectives
The AgriInnovation Program is a Growing Forward 2 program (2013-14 to 2017-18) that brings together the pre-commercialization and commercialization stages of innovation. Its objectives are to accelerate the creation, availability, application and transfer of knowledge and technologies to the sector; and increase the successful demonstration, commercialization or adoption of agriculture, agri-food and agri-based innovations. The AgriInnovation Program funds activities under three streams: Stream A: Research Accelerating Innovation (usually ten years or more from commercialization); Stream B: Research, Development, and Knowledge Transfer (usually two to ten years from commercialization); and Stream C: Enabling Commercialization and Adoption (usually two years or less from commercialization).
The objective of Stream C is to accelerate the pace of innovation by facilitating the demonstration, commercialization and/or adoption of innovative agri-based products, technologies, processes or services in the agriculture, agri-food and agri-based products sector. See Annex B for the program logic model. The overall goal is to increase sector competitiveness across the value chain and realize returns on investments made at earlier stages of the innovation continuum (Figure 1). The aim is to enhance economic growth, productivity, competitiveness, adaptability and sustainability of the Canadian agriculture, agri-food and agri-based products sector and assist in capturing opportunities for the sector in domestic and international markets.
Programs with similar focus were implemented previously, such as the Agri-Opportunities Program (2006-07 to 2010-11) and the Agri-based Processing Initiative (2009-10 to 2013-14).
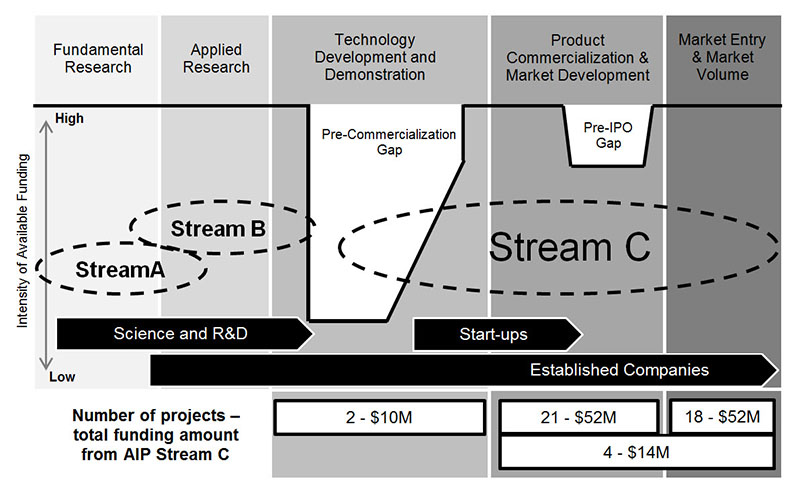
Figure 1: AgriInnovation Program on the innovation continuum
Description of above image
The innovation commercialization continuum diagram is divided into five stages and indicates intensity levels of available funding in each of the five stages.
From left to right on the diagram:
- The first stage is Fundamental research.
The funding trend shown at this stage illustrates the availability of funding for fundamental research activity.
- The second stage is Applied research.
The funding trend shown at this stage illustrates continued availability of funding for applied research activity.
- The third stage is Technology development & demonstration.
A gap is exposed at this stage where there is a sharp decline in the intensity of funding. This funding gap has been termed the pre-commercialization funding gap.
- The fourth stage is Product commercialization & market development.
At this stage the intensity of funding increases back to the level in the applied research stage. Late in this stage there is a small decline in funding intensity which has been termed the pre-IPO gap, representing a decline in funding available to companies that are preparing to offer stock in their companies through stock exchanges.
- The fifth and final stage is Market entry & market volume.
Overlaying the Technology development & demonstration, Product commercialization & market development and Market entry & market volume stages is the AgriInnovation Program “Stream C”. It is by providing funding in these three stages of commercialization that Stream C accelerates the demonstration, commercialization, and adoption of innovative agri-based projects, technologies, processes, or services. There are two other AgriInnovation Programs which cover stages of the innovation continuum. AgriInnovation “Stream A” is shown covering the Fundamental Research stage and early Applied research, AgriInnovation “Stream B” covers from late Fundamental research up to the pre-commercialization funding gap.
Below these three stages are boxes indicating the number of projects, and value of funding provided to projects at each stage from Stream C. Two projects were funded in the Technology development & demonstration stage ($10-million), 22 projects were funded in the Product commercialization & market development stage ($57-million), 17 projects were classified as adoption projects and fall in the Market entry & market volume stage ($49-million), and four projects occurred across the product commercialization and market entry stages ($14-million).
The typical classification of enterprises as they move from R&D to successful companies is shown across the five stages. During the Fundamental research, applied research and Technology development (before the pre-commercialization gap) enterprises typically are engaging in science and R&D. If a new enterprise makes it past the pre-commercialization gap, it will typically be considered a start-up, through the rest of the Technology development stage, and into the Product commercialization stage until the pre-IPO gap. Once an enterprise is through the pre-IPO gap and into the Market entry stage it is likely an established company and a viable business, though established companies may also undertake Applied research, and therefore, established companies are overlaid across the last four stages of the innovation continuum.
Source: AAFC
3.2 Activities
Stream C is delivered by funding three types of projects through repayable contribution agreements with industry partners:
- Commercialization projects: Support activities to commercialize innovative products, technologies, processes or services in the agriculture, agri-food and agri-based products sector
- Demonstration projects: Support activities at the commercialization stage of the innovation continuum and are designed to demonstrate the viability of a project to the market in order to facilitate commercial uptake
- Adoption projects: Support activities related to adoption of innovation in agriculture and agri-food sectors
Interest-free, repayable contributions may be provided for up to 50% of eligible project costs, to a maximum of $10-million for commercialization and adoption projects and normally to a maximum of $2-million for pre-commercialization demonstration projects. The total maximum contribution to an applicant from all streams under the AgriInnovation Program cannot exceed $10-million per year. The maximum level of total Canadian government funding (federal, provincial, territorial, and municipal) a recipient can receive towards the total eligible costs of a project is 75%. Eligible expenditures include capital costs such as construction, purchasing and installing equipment, as well as costs for contracted services, labour, and some limited marketing and skills development.
3.3 Application and reporting process
The Program involves a two-stage application process. In the first phase, potential applicants submit a Project Screening Summary, which helps the program determine the potential eligibility of the applicant for funding under Stream C. Program officials converse with the potential applicant, during which program officials may advise whether the potential project is a good fit with program eligibility criteria. If the proposed project appears to meet the eligibility criteria and other assessment (non-essential) criteria, a program official contacts the applicant to provide the application package and guidance on preparing the application and the supporting documentation required. For those applicants who submit a full application, final determination of eligibility is made based on an assessment of the full application package.
The application is subject to a due diligence process which involves assessment by a program officer, the Programs Branch Financial Analysis Unit, and technical reviews by Market and Industry Services Branch (Sector Development and Analysis Division and Regional Office), Science and Technology Branch, and Strategic Policy Branch. A funding recommendation for the project is made by the Program Director to the AAFC Directors General Innovation Committee which reviews the project and makes a final recommendation. The delegated authority approves the projects.
To be eligible for funding under this stream, applicants must clearly demonstrate:
- the innovative aspect of the proposed product, process, technology or service
- technical feasibility and readiness for market of the innovation
- sufficient evidence from the market to support the need and demand for the innovation
- the managerial capability to successfully complete the project, and
- the financial capacity to complete the project and to repay the contribution.
In addition, applicants must show that their project contributes to one or more of the following benefits to Canada:
- increased revenues or decreased operating costs in the agricultural sector
- increased demand for primary agriculture and/or agri-based inputs
- increased employment in the sector
Priority is given to projects that involve the following:
- the pre-commercial demonstration or commercialization of a recently proven (such as within the last five years) innovation in the Canadian agriculture, agri-food and agri-based products sector
- the creation or expansion of export markets
- an innovation that is transformative for the sector
Successful applicants are required to provide periodic financial and work plan progress, and performance reports as required under the terms and conditions of the signed contribution agreement with AAFC. Once the project is completed, AAFC contributions are repaid over a period of up to 10 years. One year following completion, project reporting commences and repayments begin. The amount to be repaid and repayment schedule are set out in the contribution agreement. No interest is payable on contribution funding, with the exception of interest charged on late payments and debts owed to the Crown, should such situations arise.
3.4 Resources
Stream C is managed by the Innovation Programs Directorate within Programs Branch. For the five-year period from 2013-14 to 2017-18, the program was allocated a budget of $137.3-million (Table 1). Of this amount, $18.8-million was for Vote 1 funding (operational and salary, including management costs), and $118.5-million for Vote 10 funding (grants and contributions). Actual direct program expenditures were $7.1-million (which excludes corporate management costs) for Vote 1 and $120.7-million for Vote 10.
Table 1 : Stream C Program budget/expenditures, 2013-14 to 2017-18 ($)
| Year | Budget | Expenditures | Variance |
|---|---|---|---|
| 2013-14 | $27,456,362 | $25,890,350 | $1,566,012 |
| 2014-15 | $27,456,362 | $33,525,768 | −$6,069,406 |
| 2015-16 | $27,456,362 | $26,548,823 | $907,539 |
| 2016-17 | $27,456,362 | $27,478,645 | −$22,283 |
| 2017-18 (February 2018) | $27,456,362 | $18,465,925 [a] | $8,990,437 |
| Total | $137,281,810 | $131,909,511 | $5,372,299 |
|
Source: Program Expenditures is from AAFC Finance (as of February 1, 2018). [a] Note: Program expects to expend all financial commitments. |
|||
4.0 Program relevance
4.1 Continued need to support innovation in the agriculture and agri-food sector
Stream C helps Canadian agriculture and agri-food companies respond to market opportunities and productivity challenges through support for innovation. However, small enterprises, start-ups and emerging sectors need more support.
The Canadian agriculture and agri-food sector operates in a context involving food cultivation, food manufacturing, and beverages. There are regional differences for these activities, with most food and beverage processing establishments located in Ontario and Quebec (37.3% and 22.2% respectively). While large firms dominate other sectors (for example, auto, telecommunications), the agriculture and agri-food sector is comprised primarily of small and medium enterprises. In 2016, there were 6,554 food and beverage processing establishments in Canada of which 94.1% were small (less than 100 employees). There is increasing investment in the sector by foreign multinational enterprises; in 2014, food accounted for 11.4% of total manufacturing foreign direct investment, compared to 6.0% in 2007.Footnote 1 While possessing advantages, the Canadian sector is highly competitive and faces challenges from commodity price volatility, exchange rate fluctuation, tight labour markets, and varying input costs.
Agriculture and agri-food manufacturers face challenges defending their competitive position. Changing global market conditions have led to both the closure of many leading manufacturing firms and entry of new players. A 2016 study by Western University's Lawrence National Centre for Policy and Management, Food and Industrial Biotechnology, reports that between 2006 and 2014, 143 Canadian food plants closed, resulting in the direct loss of 21,514 jobs. In contrast, during the same period, 62 new plants opened, and 132 companies completed or announced major investments (expansions, reinvestments, etc.). The erosion in Canadian food manufacturing competitiveness has stemmed, in part, from low investment in advanced machinery and equipment.Footnote 2 The 2017 survey of food processors in Canada found that 63% of food processors are partially or minimally automated and only four percent (4%) are fully automated. Cost was the most cited barrier to automation (76%). This barrier resulted in lower levels of food processing productivity (0.2% of annual productivity growth compared to 0.5% in the overall manufacturing sector from 1961 to 2013) and an underdeveloped sector since Canada processes only 50% of its own agricultural outputs, based on AAFC data.
The agriculture and agri-food sector has an opportunity to improve its productivity, strengthen its competitive position, and expand its markets through the commercialization and adoption of innovative technologies. The 2014 Report to the Standing Senate Committee on Agriculture and Forestry and the 2017 report by the Advisory Council on Economic Growth, Unleashing the Growth Potential of Key Sectors both highlight market opportunities for commercializing new and innovative products due to increasing demand for traceability, food safety, sustainability, nutritional value, product differentiation, and bio-products. The Advisory Council on Economic Growth noted great potential for the Canadian agriculture and agri-food sector and estimates the possibility of an additional US$30-billion in exports (approximately 2% of current gross domestic product).
There is an opportunity for Canada to leverage increasing global investment in agriculture and agri-food technologies. As noted in the Finistere Ventures report, 2017 Agtech Investment Review, there is growing global interest in agriculture technologiesFootnote 3 with 162 deals valued at $1.013-billion and 312 investors in 2016 globally. In the first half of 2017, Canada received less than three percent (3%) of the dollar value of venture capital activity and less than 10% of the number of venture capital deals in agriculture and agri-food technologies, while the United States accounted for over sixty percent (60%) of each. However, Canada maintained a leading position for venture capital deal activity during this time, indicating possible growing interest from abroad.Footnote 4 Programs such as Stream C capitalize on this growing global investment in agriculture and agri-food technology by assisting earlier stage deals to mature enough to attract the interest of global investors.
The Organisation for Economic Co-operation and Development notes that foreign direct investment supports both local economic development and international trade, improving the competitiveness of both receiving and investing economies. Foreign direct investment in Canadian food manufacturing grew almost 500% and topped out at $15.4-billion from 2004 to 2014, mostly from the United States and Europe.Footnote 5 This growth in investment was partially the result of strong industry clusters, government incentive programs such as Stream C, and the coordination between multiple government partners and programs, all which demonstrate an “open-for-business” policy environment.
Limited domestic agri-food distribution channels and difficulties in exporting constrain competitiveness. Investments in innovation and commercialization are needed for Canadian agriculture and agri-food companies to compete globally. Companies now face increased competition due to the changing trade policy landscape and reduction in tariffs, with the introduction of the Comprehensive and Progressive Agreement for Trans-Pacific Partnership in 2018 and provisional ratification of the Comprehensive Economic and Trade Agreement in 2017. According to the AAFC 2017 survey of food processors, 73% of processors cite increased competition from trading partners as a significant or moderate business challenge resulting from trade agreements and 63% do not export.Footnote 6
By providing incentives and programs, such as Stream C, to attract domestic and foreign investment, the Canadian government helps agriculture and agri-food businesses to adopt world class technologies and commercialize innovative products so they can compete globally. Stream C helped Canadian agriculture and agri-food companies respond to market opportunities and address challenges by reducing the financial risks and accelerating innovation. The program assisted companies to commercialize new technologies to improve productivity and capacity, as well as respond to changing consumer demands and new export markets. This enables companies to undertake projects in a timelier manner to seize market opportunities and enhance their speed of growth than they would otherwise. Securing additional private financing enables companies to overcome significant financial barriers, as it does not tie up existing assets.Footnote 7 Forty-four percent (44%) of project recipients noted their projects were in response to a particular need to build, update, or expand their facilities or to bring new products, processes, services or technologies to market.
While Stream C supports the sector to be more competitive, there is evidence that Stream C does not optimally meet the needs of small enterprises, start-ups and emerging sectors.
Canadian agriculture and agri-food small enterprises, start-ups, and firms in emerging sectors in particular face barriers to commercialization and expansion. For these firms, there is little financing support during the risky period known as the “Valley of Death,” where costs exceed revenues and there is a high potential for failure.Footnote 8 Commercial lenders are less willing to finance these commercialization activities due to high risks associated with small enterprises, start-ups and emerging sectors, such as unproven products or technologies and difficulties in meeting financial requirements by these applicants. For small firms, paying interest on loans tie up valuable working capital that could be allocated towards additional scale-up investments. While venture capital and angel investments are important sources of financing, gaps remain for investments in early-stage higher-risk deals.Footnote 9 For example, in 2013 fewer than 20% of Canadian venture capital investment took the form of early-stage financing compared to an average of 60% among international peers.Footnote 10 The agriculture sector is less desirable to these investors since it tends to result in lower returns compared to other sectors.
This gap in financing for high-risk early stage commercialization activities in the agriculture and agri-food sector presents opportunities for government involvement, particularly since these firms stand to generate the most benefits if they succeed.Footnote 11 Some small enterprises, start-ups and firms from emerging sectors have limited business knowledge, management expertise and resources, which may have limited their ability to complete an application package. Financial requirements (such as the ability to repay), application costs and timelines dissuade small enterprises and start-ups from applying to the program and made it difficult for them to be eligible.
4.2 Alignment with federal roles and responsibilities
Stream C aligns with federal roles, responsibilities and priorities to enhance sector competitiveness and bring innovation to market by addressing barriers to finance, attracting investment, and reducing risks for adoption and commercialization projects.
The ultimate role of the program is to enhance sector competitiveness by accelerating the demonstration, commercialization and adoption of innovative technologies in the agriculture and agri-food sector. This aligns with responsibilities outlined in the Mandate Letter for the Minister of Agriculture and Agri-Food, which emphasizes supporting the agricultural sector in a way that allows it to be a leader in innovation. Stream C accelerates innovation and adoption by enhancing access to financing, assisting in attracting investment capital into the sector, and sharing the risk with early adopters on “new to Canada” or “first of kind” innovations in the agriculture sector. Stream C is aligned with AAFC's Strategic Outcome for an innovative and sustainable agriculture, agri-food and agri-based products sector, particularly in terms of “generating new knowledge, fostering innovation and increasing adoption and commercialization of agricultural, agri-food and agri-based products, processes or practices.” The Program aligns with broader federal priorities such as the Innovation and Skills Agenda and Budget 2017's focus on “bringing Canadian innovations to market,” by addressing barriers to financing for projects that commercialize, demonstrate and adopt new innovations. Stream C supports the Pan Canadian Framework on Clean Growth and Climate Change, which underscores the need to “accelerate innovation” and “support clean technology”.
4.3 Program complementarity with other sources of funding
Stream C complemented other government sources of funding, which have different mandates, to further reduce the financial risk and accelerate the demonstration, commercialization, and adoption of innovation.
The evaluation identified comparable federal, provincial and regional programs that support activities similar to Stream C (See Annex C). Regional development agency investment in the agriculture and agri-food sector was $27-million in fiscal year 2014-15. While there is some overlap, these programs complement Stream C funding as they have different areas of focus, such as particular regions or sectors, or cover different stages of the innovation continuum. For instance, Farm Credit Canada may finance similar technology adoption projects, but is less likely to finance riskier start-up-led projects since its mandate is to generate a profit. Canadian venture capital companies tend to focus on later stage commercialization while provincial and non-profit support tends to be smaller scale and more focused on demonstration. Stream C is the only federal government Vote 10 business funding program focused on value-added agriculture and agri-food.
The evaluation found that eight out of the 45 projects funded received support from other federal or provincial government programs; as long as the stacking and matching requirements are met, spreading project risk across multiple funders was seen as beneficial to reduce individual funder impact if the project failed. The 2016 Food and Industrial Biotechnology study by the Lawrence National Centre for Policy and Management at Western University found that government officials can play a critical role as “account executives” facilitating the coordination of multiple funding partners and aligning policy objectives to share the risks for particular projects.
AAFC coordinates with other federal government agencies to enhance and improve coordination of complementary programs. AAFC is participating in the Horizontal Innovation Review of federal programs that support business innovation and clean technology to improve coordination with other departments.
5.0 Performance
5.1 Activities and outputs
Stream C utilized its full budget toward 45 projects, exceeding the target of funding 36 projects.
On average, each Stream C project received $2.9-million in AAFC funding. Stream C projects tended to fall into three broad categories:
- Niche innovations with significant impacts on a company and/or sector's success
- Increasing product development and agricultural inputs
- Value-added innovations that increase the competitiveness of the agriculture sector
The largest proportion of AAFC funding was approved for projects in Ontario and Quebec and a focus on agri-food processing related to the cereal and pulse and horticulture sectors (Table 2).
Table 2: Stream C projects approved 2013-14 to 2017-18 by province and agricultural input sector
| Number of projects | Number of projects percent |
AAFC funding approved $ |
AAFC funding approved % |
|
|---|---|---|---|---|
| Ontario | 24 | 53% | $66,843,672.00 | 52% |
| Quebec | 8 | 18% | $28,557,878.00 | 22% |
| British Columbia | 4 | 9% | $15,313,966.00 | 12% |
| Nova Scotia | 3 | 7% | $6,162,250.00 | 5% |
| Manitoba | 2 | 4% | $5,319,165.00 | 4% |
| Prince Edward Island | 2 | 4% | $5,246,000.00 | 4% |
| Alberta | 1 | 2% | $838,850.00 | 1% |
| Yukon Territory | 1 | 2% | $600,000.00 | 0% |
| Total | 45 | 100% | $128,881,781.00 | 100% |
| Source: Stream C Project Data | ||||
| Number of projects | Number of projects percent |
AAFC funding approved $ |
AAFC funding approved % |
|
|---|---|---|---|---|
| Cereal and Pulse | 13 | 29% | $48,210,575.00 | 37% |
| Horticulture | 15 | 33% | $36,498,196.00 | 28% |
| Dairy, Pork, Poultry and Other Livestock | 6 | 13% | $22,858,429.00 | 18% |
| Various [a] | 6 | 13% | $9,782,758.00 | 8% |
| Oilseeds | 1 | 2% | $4,600,000.00 | 4% |
| Beef | 1 | 2% | $3,797,973.00 | 3% |
| Various (farming technology) | 3 | 7% | $3,133,850.00 | 2% |
| Total | 45 | 100% | $128,881,781.00 | 100% |
|
Source: Stream C Project Data [a] “Various” includes projects that benefited various agricultural input industries. For example, a granola bar processor benefited organic oats, blueberry, cranberry, and flaxseed producers by increasing the demand for these products. |
||||
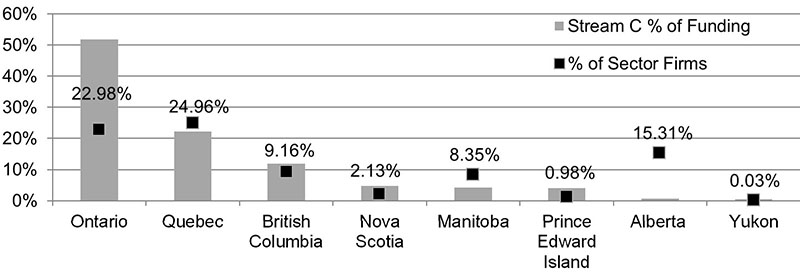
The provinces that received the greatest portion of funding are those with the highest percentage of sector firms: Ontario has 23% of sector firms and received 52% of Stream C funding. Quebec has 25% of firms and received 22% of Stream C funding (Figure 2).
Figure 2: Provincial distribution of sector firms and Stream C funding
Description of above image
The provincial distribution of sector firms and Stream C funding figure shows a graphical representation of the following data:
| Province | Percent of total Stream C funding | Percent of sector firms |
|---|---|---|
| Ontario | 51.86 | 22.98 |
| Quebec | 22.16 | 24.96 |
| British Columbia | 11.88 | 9.16 |
| Nova Scotia | 4.78 | 2.13 |
| Manitoba | 4.13 | 8.35 |
| Prince Edward Island | 4.07 | 0.98 |
| Alberta | 0.65 | 15.31 |
| Yukon | 0.47 | 0.03 |
Source: Stream C Project Data. Statistics Canada, Canadian Socioeconomic Database: CANSIM 552-0006 (2017) (North American Industry Classification System 1111, 112, 1151, 1152, 311, 3121, 4111, 4132).
Projects targeted various sub-sectors of agricultural inputs, with over 50% of the funding targeting cereals and pulses (for example, wheat, corn, and barley) and horticulture (for example, apples, blueberries, cranberries, strawberries, grapes, greenhouse vegetables and fruit, microgreens, milkweed, and potatoes).
Evidence suggests that the program supported a higher proportion of projects that are less risky, such as technology adoption projects. In the first two years of the program, 53% of projects approved were adoption projects compared to only 24% for commercialization projects. In the last three years the program focused more on commercialization projects as 32% and 61% of projects were adoption and commercialization projects respectively. The remaining percentage of projects were either both adoption and commercialization or demonstration projects. As of February 2018, the mix of adoption, commercialization and other projects has balanced (Table 3).
Table 3: Stream C projects approved by type, 2013-14 to 2017-18
| Type of project | Number of projects | Number of projects % |
AAFC funding approved | AAFC funding approved % |
|---|---|---|---|---|
| Adoption | 18 | 40% | $51,761,981.00 | 40% |
| Commercialization | 21 | 47% | $52,449,601.00 | 41% |
| Commercialization and Adoption | 4 | 9% | $14,200,198.00 | 11% |
| Demonstration | 2 | 4% | $10,470,000.00 | 8% |
| Total | 45 | 100% | $128,881,780.00 | 100% |
Stream C exceeded one of its program output targets and did not meet the other. As of February 2018, 43 adoption and commercialization projects were approved, exceeding the target of 36, and two demonstration projects have been approved, while four were targeted. It is difficult to identify projects as uniquely demonstration, commercialization, or adoption since project activities may involve more than one of these elements.
5.2 Sector access to government and private investment to support demonstration, commercialization, and adoption
Stream C projects exceeded the intermediate outcome in matching private investment capital by 7.4-million but did not meet all the targets for completed projects.
As of February 2018, Stream C exceeded its target of $118.5-million in matching private sector investments towards projects with $125.9-million in investments (49% of total project costs in Stream C Contribution Agreements). These investments included cash on hand, equity offerings, lines of credit, commercial loans, and cash flow. Stream C exceeded the previously implemented Agri-Opportunities Program's $83.6-million in private sector investment (fiscal years 2006-07 to 2010-11). In addition, $4.3-million (one percent (1%) of total project costs) was provided in matching funds for Stream C projects from other federal and provincial governments. As of February 2018, 28 commercialization or adoption projects were successfully completed (of which nine have made final payments), and no demonstration projects have been completed, partially meeting the targets of 36 and 3 respectively. Twelve additional projects are expected to be completed by year end, March 31, 2018 (Table 4).
Table 4: Achievement of Stream C Program immediate outcomes (February 2018)
| Program outcome | Indicator | Target March 31, 2018 | Achievements February 14, 2018 | Status |
|---|---|---|---|---|
| Sector has access to government and private investment capital to support demonstration, commercialization and adoption of innovative technologies, processes, products, and services | Dollar value of private sector investments | $118.5-million | $125.9-million | Exceeded |
| Sector has access to government and private investment capital to support demonstration, commercialization and adoption of innovative technologies, processes, products, and services | Number of companies that have successfully completed their commercialization/adoption projects | 36 | 28 projects completed (9 projects made final payments) |
On Track |
| Sector has access to government and private investment capital to support demonstration, commercialization and adoption of innovative technologies, processes, products, and services | Number of demonstration projects completed | 3 | 2 projects completed | Not met |
| Source: Stream C Project Data; Stream C Program Performance Measurement and Risk Management Strategy. | ||||
The total budgets for many projects were greater than the sum of their Stream C contributions and private matching funds. Evaluation evidence found that 20 projects exceeded the required 50% of matching private investment. These projects obtained an additional $114.5-million in private sector investment and an additional $40.4-million in other government funding in projects, above and beyond the investments reported in their contribution agreements.
5.3 Developing the sector’s capacity to commercialize products, processes or services
While Stream C projects are reporting increases in revenues, productivity, and savings, it is challenging to attribute Stream C contributions towards sector’s capacity to commercialize.
Stream C project recipients who were interviewed estimated a 52% likelihood that their projects would have proceeded in some form (for example, reduced in scope or delayed) without AAFC assistance. Analysis conducted by the AAFC Stream C Financial Analysis Unit estimated that 12 of 43 approved projects could have proceeded without Stream C funding. Based on the averages of 25 projects shared by these two datasets, the evaluation estimates a 42% likelihood that projects would have proceeded without AAFC assistance. This percentage is comparable to similar government programs, as the Western Diversification Canada Western Innovation Initiative and the Canada Small Business Financing Program reported a 40% and 44% likelihood of projects proceeding without program support.Footnote 12 Furthermore, the evaluation found that the program potentially displaced $35-million of private sector funding for lower-risk projects.
Evaluation evidence found that, without Stream C assistance, 75% of funded projects that may have proceeded would likely have been delayed, reduced in scope or less successful due to increase project risks. Among applicants who failed to receive Stream C funding, 78% noted that their project activities were reduced, delayed or canceled.
The targeted intermediate program outcome of the sector developing the capacity to commercialize products, processes, or services is on track to be met. Impacts of the program were estimated based on the analysis of 21 projects and the assumption that impacts would not have occurred in the absence of the program. Given the 42% likelihood that Stream C projects could have proceeded without AAFC assistance, a 58% probability was applied to all reported impacts.
Assuming 58% of increases are attributable to Stream C support (program incremental achievements), Stream C resulted in increases of $198.8-million in domestic and export revenues, $45.5-million in actual cost savings, $54.8-million in actual dollar value of agricultural input, and 31 innovations entering the market. These impacts are expected to increase as projects progress and more projects report on outcomes, until the program ends on March 31, 2018 (Table 5).
Project recipients stated that their projects have been very successful in achieving their objectives to date. In addition to the indicators discussed in Table 5, Stream C has resulted in 443 new full-time and 60 new part-time jobs. However, only employment increases directly related to funded projects were reported with no information on any jobs eliminated by the companies as a result of the project. Data from Statistics Canada indicates that Stream C funded companies fell from 8,024 employees in 2013 to 5,370 employees in 2016, suggesting that aggregate employment of companies funded by Stream C is decreasing. Seventy-four percent (74%) of recipients reported their projects led to other projects, investments or development by their organization or other partners, with specifically four recipients reporting $126.4-million in investment following the completion of their projects.
Table 5: Achievement of Stream C Program intermediate outcomes, February 2018
| Program outcome | indicator | Program target March 31, 2018 |
Achievements February 14, 2018 (# projects) [a] |
Program incremental achievements (based on 58% probability) (# projects) |
Status |
|---|---|---|---|---|---|
| The sector develops the capacity to commercialize products, processes, or services | Revenue increase generated as a result of project | $854.0-million | $342.7-million (14) |
$198.8-million (14) |
On Track |
| The sector develops the capacity to commercialize products, processes, or services | Actual cost savings resulting from commercialization/ adoption projects | $11.6-million | $78.5-million (2) |
$45.5-million (2) |
Exceeded |
| The sector develops the capacity to commercialize products, processes, or services | Actual $ value of agricultural input increase resulting from commercialization/ adoption projects | $236.5-million | $94.5-million 8) |
$54.8-million (8) |
On Track |
| The sector develops the capacity to commercialize products, processes, or services | Number of innovative products, technologies, processes, or services supported by the program that enter the market | 33 | 53 (13) |
31 (13) |
On Track |
|
Sources: Recipient interviews and Stream C Project Data; Stream C Program Performance Measurement and Risk Management Strategy. [a] Targets and achievements are aggregated for each year they were reported. |
|||||
Factors that may have impacted the completion and success of projects included access to the Stream C funding and a strong project team. Constraints included technical issues delaying the project implementation, market and regulatory challenges slowing access to new markets and limited capital to grow their business. Evidence suggests the need for sector-wide innovation and adoption to remove threats to global competitiveness trumps the risk of potential displacement of other funding.
Examples of impacts resulting from Stream C projects including production cost savings, increased revenues, production volumes, and agricultural inputs, and reduced facilities footprint were identified in the case studies and recipient interviews (Annex E).
5.4 Enabling the sector to produce, adopt, and commercialize innovative products, processes, practices and services and technologies
Stream C met the target of increasing productivity in the sector. However, it is too early to assess long-term impacts as only 21 out of 45 projects have reported results.
As the program is not yet complete and there is insufficient recent data available to report on performance indicators, it is too early to assess progress on the end outcome. The performance measurement indicator for the end outcome of “a sector that produces, adopts, and commercializes innovative products, processes, practices, services, and technologies” is the increase in agriculture net value added (target of $12.3-billion by March 31, 2018) and total factor productivity (target of 108 by March 31, 2018). AAFC research indicates that agriculture net value added has shown a promising trend, reaching $18.7-billion in 2015. However, the sector continues to struggle with productivity growth compared to overall manufacturing sectors in Canada with a 0.2% of annual productivity growth compared to 0.5% in the overall manufacturing sector from 1961 to 2013. To better assess the contribution of Stream C and previously delivered programs such as the Agri-Opportunities Program, post-project performance of these firms in terms of net value added and total factor productivity would be necessary.
To determine the possible long term impacts of AAFC programs supporting innovation, analysis was undertaken with Statistics Canada to determine impacts long after the conclusion of Agri-Opportunities Program, the predecessor program of Stream C. Since Agri-Opportunities ended in 2012, data for 16 companies indicates that their average revenues fluctuated between $2.8-million and $3.3-million from 2012 to 2016, and the average net income increased from a loss of $1.9-million to a loss of $22,000. While the sales of goods and services per employee increased from $1.2-million to $2-million, the average number of employees decreased from 21 to 14 and the average wages per employee fluctuated around $52,816. These trends indicate that it is difficult to attribute the impact of innovation programming on specific firms and sectors in the medium to long term due to the various factors that influence the business environment.
5.5 Program efficiency
Stream C maintained low operational costs compared to similar programs, and its benefits exceed its costs.
Stream C funded $124.8-million in grants and contributions for 45 projects to date, representing 105% of the planned $120.7-million in spending. Stream C expenditures were highest in the second year of delivery at $32.4-million. Program responsiveness to industry need, some marketing efforts, and word of mouth contributed to the high industry up-take of the program. Table 6 provides more details on planned and actual spending from 2013-14 to 2017-18.
| Fiscal year | Planned grants and contributions | Actual grants and contributions | Actual/ planned ratio | Operational costs | Total program costs | Operational/ total costs |
|---|---|---|---|---|---|---|
| 2013-14 | $23,700,000 | $24,915,211 | 105% | $975,139 | $25,890,350 | 3.8% |
| 2014-15 | $23,700,000 | $32,376,380 | 137% | $1,149,388 | $33,525,768 | 3.4% |
| 2015-16 | $23,700,000 | $25,031,600 | 106% | $1,517,223 | $26,548,823 | 5.7% |
| 2016-17 | $23,700,000 | $25,739,837 | 109% | $1,738,808 | $27,478,645 | 6.3% |
| 2017-18 [a] | $23,700,000 | $16,759,617 | 71% | $1,706,308 | $18,465,925 | 9.2% |
| Total | $118,500,000 | $124,822,645 | 105% | $7,086,866 | $131,909,511 | 5.4% |
|
Sources: Planned is from Program data, and total Program Expenditures is from AAFC Finance (as of February 1, 2018). [a] The fiscal year 2017-18 is incomplete and is estimated to-date. Program expects to expend all financial commitments by March 31, 2018. |
||||||
Stream C maintained low operational costs averaging 5.4% of total program costs from 2013-14 to 2017-18. This was lower than similar programs such as the AAFC Agri-Opportunities Program (8.3%), AAFC Agri-based Processing Initiative (8.4%), Western Economic Diversification Canada Western Innovation Initiative (12.3%), and Atlantic Canada Opportunities Agency Innovation and Commercialization Sub-program (8.3%).
A cost-benefit analysis of Stream C results found that the program has a benefit cost ratio ranging from a low of $2.59:1 to a high of $7.58:1 (Table 7). Benefits include attributable revenues compared to program costs. Costs include the cost of capital to the government of Canada of estimated total disbursements (using the average Government of Canada benchmark 5-year bond yield from April 1, 2013 to February 15, 2018), total program administrative costs, and estimated total defaults. It should be noted that these results present only an estimate and are based on self-reported project impacts and attributions not verified by other sources.
| Benefits | Low estimate | High estimate |
|---|---|---|
| Stream C portion of attributable revenues |
$99,370,921 | $290,520,950 |
| Total benefits | $99,370,921 | $290,520,950 |
| Costs | Low estimate | High estimate |
|---|---|---|
| Cost of capital to Government of Canada |
$9,916,280 | $9,916,280 |
| Estimated defaults | $21,300,000 | $21,300,000 |
| Program administrative costs | $7,086,866 | $7,086,866 |
| Total costs | $38,303,146 | $38,303,146 |
| Benefit to cost ratio | $2.59:1 | $7.58:1 |
|
Sources: Revenues from interviews and project performance reports; cost of capital estimates from Bank of Canada; estimated defaults from Programs Branch and Corporate Management Branch financial estimates; program administrative costs from program financial data. Notes: Benefits: Low estimate assumes no revenues are generated past February 2018. Revenues are estimated based on 14 projects reporting and assumes impacts are attributed to 0.5 Stream C portion of funding and 0.58 incrementality factor. |
||
5.6 Program design and delivery
Stream C has attractive funding mechanisms, strong due diligence, and efficient processes but needs to address barriers faced by small enterprises, start-ups and emerging sectors, lack of clarity in guidelines, issues with data accuracy, and limited communication with industry stakeholders.
Program design
Project recipients were generally satisfied with the funding mechanisms, including interest-free repayable contribution funding, no security requirement, and the grace period of one-year post-project completion to repay. These terms make it easier to access additional sources of financing and enhance the liquidity of recipients, freeing up working capital and accelerating the pace of scale-up and expansion. Stream C's focus on commercialization was a key strength since it helps to address access to financing, a major barrier faced by small enterprises, start-ups and emerging sectors.
Issues were identified in the Stream C program design, which may limit access to funding for some prospective applicants. The financial requirements and repayable nature of the contributions may have limited the program's ability to address the needs of higher risk commercialization projects undertaken by small enterprises, start-ups and emerging sectors, or where industry is not willing to invest.
Project approvals
The Stream C project approval process has seen improvement compared to previously delivered programs. Financial reviews have improved due to the establishment of a Repayment and Financial Business Case Analysis Unit in 2012, contributing to lower default rates compared to the Agri-Opportunities Program. Efforts were made to further strengthen the project approval process such as a Lean Process Improvement Workshop to improve timeliness and service standards. Treasury Board has recognized Stream C as one of the faster programs processing large agreements with a strong emphasis on service standards and delivery, as documented in its Horizontal Review of Business Innovation and Clean Technology.
Despite this progress, the approval process still faces issues of timeliness and clarity of the guidelines. The evaluation found that 57% of approval or rejection letters were sent within 100 business days after receiving a full application (less than the service standard target of 80%). Project recipients were less satisfied on average with the application process compared to other program elements. The time and cost to apply to the program could further restrict small enterprises and start-ups from applying and prevent applicants from quickly responding to market opportunities.
Stream C program guidelines created confusion with respect to acceptable levels of risk, program priorities, and the definition of innovation. AAFC's 2016 Audit of Stream C expressed concerns that the financial due diligence process may be crowding out private sector financing and insufficient guidelines regarding the acceptable level of program risk. The evaluation identified a need to clarify what constitutes ‘innovation', and whether it means a technology is new to the applicant, region, sector, or Canada. Further clarity and guidelines for program priorities may facilitate rationales for funding decisions in technical reviews and by senior management. Plans for the next iteration of Stream C have highlighted priorities with respect to adoption projects in the area of clean technology, automation, robotics and precision agriculture.
The considered benefits to Canada may need revisions to better reflect program objectives and innovation. The adoption of technologies and innovation to increase efficiency and reduce costs may result in loss of jobs as automation is adopted. Additional benefits to Canada, such as highly qualified personnel jobs created, licenses executed or net capital expenditures, could be explored as program criteria. Comparable programs to Stream C utilize indicators such as the expected number of benefits to occur or benchmarking targets for identified benefits which may assist in improved assessment and judgement of potential projects.Footnote 13
Claims, reporting, and data management
Stream C claims and reporting processes are generally working well. Project recipients were generally satisfied with these processes, and noted the automated claims process is straightforward and that AAFC staff have been helpful. Recipients indicated that the reporting process is clear with reminders, due-dates, and pre-populated fields that ease reporting. The program is meeting service standards with respect to claim payment times, as the program was able to send a payment within 30 days of receipt of a duly completed and document claim 93% of the time from July to September 2017 (above the target of 80%).
Reporting and tracking performance data issues were identified. Start and contribution agreement dates, applicant contribution amounts, and project status were inaccurately recorded, with empty data fields for some projects. Evidence from interviews indicated that data fields collected could have been expanded, such as reasons for withdrawal or rejection, which would assist in program evaluation. Suggestions included a measure of gross margin to better determine if a company was growing profitably or broader definitions of success by including impacts to the overall innovation and commercialization ecosystem. For example, if a company commercializes a technology and creates jobs for a brief period but then defaults, it could still be considered a success for that time period and for the lessons the entrepreneur brings to their next venture. The Advisory Council on Economic Growth 2017 report Unlocking Innovation to Drive Scale and Growth noted that an ecosystem lens is required to improve the country's innovation outcomes and that five critical elements should be considered: access to talent, capital, connectivity, customers, and enabling public-sector programs. This may imply Stream C broadening its stated benefits to Canada to include benefits to Canadian venture capital such as expanded networks or increased availability of capital to support further investment in Canadian businesses.
Communication and industry outreach
Interviewees, particularly project funding recipients, identified limited communication with industry stakeholders, and limited understanding about industry and start-up needs among program staff. There is a limited awareness and understanding about the program among some industry stakeholders. According to the 2017 AAFC survey of food processors, almost half of processors are aware of AAFC's Growing Forward 2 programs, with responses ranging from a low of 32% in Quebec to a high of 50% in Ontario. Evidence from interviews suggests a need for more communication and face-to-face interactions between program staff and project applicants during the application process. Program analysis has considered solutions to address these challenges such as increased participation in Value Chain Roundtables, increased frequency of contact and collaboration with other AAFC branches such as Market and Industry Services Branch and Strategic Policy Branch, the establishment of formal networks with similar programs across Canada, and increased contact with other levels of government more connected to firms in their jurisdictions, including provincial programs and organizations operating in the area of agriculture commercialization.
6.0 Conclusions and recommendations
6.1 There is a continued need for Stream C: Enabling Commercialization and Adoption
The Canadian agriculture and agri-food sector faces several challenges impacting its competitiveness, particularly low rates of automation, limited access to financing for commercialization, and increasing global competition for export markets and foreign investment. Stream C has helped companies to respond to these challenges by reducing the risks associated with such investments. Without Stream C assistance, many projects would have been delayed or reduced in scope. While other sources of funding for demonstration, commercialization, and adoption are available, Stream C generally complements these other sources of funding as they have different mandates, can share the risks for particular projects, and AAFC coordinates with other federal funding partners to ensure resources are aligned. Stream C aligns with federal roles to enhance sector competitiveness as the program addresses barriers to financing, attracting investment, and reducing the risks for adoption and commercialization projects. The program aligns with AAFC and federal priorities to bring innovations to market and address climate change.
6.2 Stream C projects reported increasing productivity, however it is too early to assess the program’s contribution to the sector.
The program has funded a variety of projects across Canada benefiting different agricultural input and value-added sectors. As of February 2018, $128.9-million in AAFC repayable contribution funding, $125.9-million in matching private sector investment, and $4.3-million in other federal and provincial government funding was dedicated to 45 Stream C projects. Program targets for the number and types of projects to be funded and completed have been met or exceeded, except one. Stream C projects are reporting increased revenues, savings and demand for products. It is too early to assess long-term program impacts as only 21 projects are reporting results.
6.3 Stream C is economical and its benefits exceed its costs
Stream C has been delivered economically since it has exceeded planned grants and contributions spending targets and maintains a low operational cost compared to similar programs. The program has resulted in an estimated benefit cost ratio ranging from a low of $2.59:1 to a high of $7.58:1 comparing revenues generated by program recipients to estimated defaults, government cost of capital, and program administrative costs.
6.4 Stream C had attractive funding mechanisms and efficient processes but needs to address barriers faced by small enterprises, start-ups and emerging sectors undertaking commercialization activities
The strength of Stream C design and delivery included attractive funding terms, strong due diligence process, and efficient claims and reporting processes. However, the program design limits access to funding for small enterprises, start-ups and emerging sectors which may have potential to commercialize products. This may require adjustments to financial requirements, assessment criteria, or approval timelines. Priorities and risk tolerance levels should be further clarified and communicated in program guidelines.
Recommendation 1: Assistant Deputy Minister, Programs Branch, should explore options to improve access to the program for small enterprises, start-ups and emerging sectors undertaking commercialization.
6.5 Stream C had issues with reporting and tracking performance data
Issues with data accuracy included inaccurate start dates, applicant contribution amounts, and project statuses. Performance measures could be further refined to more accurately capture program impacts. Broader definitions of success could be considered by looking at innovation and commercialization ecosystem impacts. For example, if a company commercializes a technology and creates jobs for a brief period but then defaults, it could still be considered a success for that time period and for the lessons the entrepreneur brings to their next venture. Benefits to Canada could include expanded networks for Canadian venture capital companies or increased availability of capital to support further investment in Canadian businesses.
Recommendation 2: Assistant Deputy Minister, Programs Branch, should strengthen quality assurance mechanisms for performance data collection and management, and strengthen performance indicators to better measure the success of the program.
6.6 There are gaps in communication between program staff and industry stakeholders
There are gaps with respect to communication between program staff and industry stakeholders, understanding of industry and start-up needs, and awareness of the program in some regions. Increased outreach and communication would help to better align the program with industry needs (for example, through targeted promotion to small enterprises and start-ups) and communicate the program purpose to ensure that those who do not fit the criteria do not apply. There is a lack of awareness and understanding about the program among some industry stakeholders. Gaps could be addressed through increased communication and face-to-face interactions between program staff and project applicants, increased participation in Value Chain Roundtables, increased frequency of contact and collaboration with other departmental branches such as Market and Industry Services Branch and Strategic Policy Branch, the establishment of formal networks with similar programs across Canadian regions, and increased contact with other levels of government that are more connected to businesses in their regions.
Recommendation 3: Assistant Deputy Minister, Programs Branch, in collaboration with other Branches, should review industry communication strategies.
Recommendation 4: Assistant Deputy Minister, Programs Branch, should review options to collaborate with other agencies (Federal, Provincial, Private lenders, and Non-profits) to leverage the expertise and resources (advice and assessment) to better respond to where investment is lacking and providing a sector wide approach to innovation.
7.0 Management Response and Action Plan
| Recommendation | Management Response and Action Plan (MRAP) | Target date | Responsible leads |
|---|---|---|---|
| Recommendation 1: Assistant Deputy Minister, Programs Branch, should explore options to improve access to the program for small enterprises, start-ups and emerging sectors undertaking commercialization. |
Agreed. In developing the newly launched AgriInnovate Program, the assessment criteria of financial risk have been amended to improve access for small enterprises, start-ups and organizations from emerging sectors seeking to undertake commercialization projects. Over the course of the implementation of the AgriInnovate Program, the Innovation Programs Directorate will continue its ongoing tracking of projects to confirm that the balance of commercialization versus adoption projects is appropriate. The Directorate will also track the uptake of AgriInnovate funding among small- and medium-sized enterprises compared to larger firms. Results will be tracked in a mid-program review to assess progress. |
September 2020 | Director General, Innovation Programs Branch |
| Recommendation 2: Assistant Deputy Minister, Programs Branch, should strengthen quality assurance mechanisms for performance data collection and management, and strengthen performance indicators to better measure the success of the program. |
Agreed. The department is working towards a more automated system for the grants and contributions delivery, which will create program efficiencies and improve the integrity of program data. The Directorate will prepare an action plan including an annual quality assurance process to ensure that the data captured by the program is accurate and complete. The Innovation Programs Directorate will investigate if other performance indicators would better measure and demonstrate the success of the program and its impact on the sector. The Directorate will examine the performance indicators being used by comparable programs to determine if the same or similar indicators would be appropriate for the AgriInnovate Program. The Innovation Programs Directorate will continue to work with Strategic Policy Branch, Research and Analysis Directorate and Statistics Canada to apply statistical methods to the AgriInnovate Program. |
March 2019 | Director General, Innovation Programs Branch |
| Recommendation 3: Assistant Deputy Minister, Programs Branch, in collaboration with other Branches, should review industry communication strategies. |
Agreed. The Innovation Programs Directorate developed an engagement plan for targeted outreach in advance of the launch of the AgriInnovate Program. This engagement plan included outreach to regional offices, regional development agencies, the National Research Council's Industrial Research Assistance Program, and select industry organizations from the emerging sector. The Innovation Programs Directorate will continue its efforts in conducting these sessions throughout the first year of implementation of the AgriInnovate Program, to better identify potential program beneficiaries who are ready to implement an adoption and/or commercialization project. |
March 2019 | Director General, Innovation Programs Branch |
| Recommendation 4: Assistant Deputy Minister, Programs Branch, should review options to collaborate with other agencies (Federal, Provincial, Private lenders, and Non-profits) to leverage the expertise and resources (advice and assessment) to better respond to where investment is lacking and providing a sector wide approach to innovation. |
Agreed. To develop and coordinate a whole-of-government approach to innovation AAFC has representatives in the following organizations and committees: Innovation Canada, Clean Growth Hub, a government wide committee on the delivery of innovation programming, and a Federal/Provincial/Territorial Innovation Working Group. AAFC will continue to collaborate with other agencies through the committees and structures detailed above to support the government-broad initiative of better coordination of its innovation agenda. |
March 2020 | Director General, Innovation Programs Branch |
Annex A: Evaluation methodology
A. Evaluation methodology
The evaluation was conducted in accordance with the Treasury Board Policy on Results and Directive on Results. It assessed the relevance and performance of Stream C, specifically focusing on results or progress on results achieved by the program in terms of effectiveness, efficiency, and economy.
The evaluation covered the period from 2013-14 to 2017-18. The evaluation focused on the extent that Stream C met program objectives and addressed industry needs.
Sources of evidence:
- Program document, file and performance data review: The program document, file and performance data review primarily gathered evidence on program performance, including the extent that projects have addressed the financing gaps and facilitated commercialization, adoption and returns on investments. Information was gathered related to program relevance and the rationale for providing funding described in project applications and summary forms. All available program financial, administrative, project and performance data was included in the analysis. Related program and departmental consultations, studies and analyses, such as preliminary results from the matched pair analysis undertaken by Statistics Canada and Treasury Board Secretariat-led Horizontal Review, were included as part of the assessment.
- Comparative analysis: A comparative analysis was conducted of the performance of Stream C in relation to similar previously funded programs, such as the Agri-Opportunities Program (2006-07 to 2010-11) and comparable programs implemented by other departments and agencies. The comparative analysis primarily focused on comparisons with respect to economy and efficiency (for example the timeliness, resources and administrative costs involved in delivering the program).
- Literature review: A review of past and current program related literature, such as government reports, grey and peer reviewed literature, and other government and subject matter expert reports. The literature review provided evidence of the relevance of Stream C programming by examining the availability of financing for innovation and commercialization in Canada, more generally, and specifically related to the agricultural sector. The review assessed possible factors or conditions that may constrain access or facilitate access to finance for businesses in these sectors.
- Interviews: 51 interviews were conducted with AAFC senior management and staff, external experts and stakeholders, project recipients, and project applicants. The interviews took place between September and November 2017. An interview guide was developed for each target group and interviewees were provided with interview guides in advance. The interviews focused on relevance, performance, economy, and efficiency. The breakdown by interview group is as follows:
| Target group | Description | Target | Actual |
|---|---|---|---|
| AAFC senior management and staff | AAFC senior management and staff interviewed included Directors (3), Managers (3), and Program Officers (3) involved in Stream C and the Agri-Opportunities Program (AOP), specifically in the areas of program delivery and design, financial review and assessment, and policy review. | 5 to 10 | 9 |
| Experts and stakeholders | Stakeholders interviewed included senior management and other representatives of a variety of organizations providing support for commercialization, demonstration, and adoption of innovations in the agriculture and agri-food sector, including a regional development agency, lending institutions, venture capital (VC) organizations, and industry associations in the area of agri-food processing and bio-products. | 5 to 10 | 8 |
| Project recipients | Project recipients interviewed included proponents and other project stakeholders involved in implementing projects that received Stream C funding. We attempted to interview all project funding recipients (such as recipients of the 43 approved Stream C projects at the time interviews began). A total of 25 recipients completed an interview. The majority of project recipients who participated in the evaluation reported that their projects had been completed (15). | 30 to 40 | 25 |
| Project applicants | Project applicants interviewed included applicants that submitted a full proposal for Stream C funding but either were rejected or withdrew their application. A random sample of 28 applicants was selected and these applicants were contacted for interviews. A total of 9 applicants completed an interview. Eight of the 9 project applicants interviewed indicated their application was rejected. The majority of project recipients who participated in the evaluation reported that their projects had been completed (3) or was ongoing (5). | 10 to 15 | 9 |
| Total | 50 to 75 | 51 |
- Case studies: Six case studies of Stream C funded projects provided in-depth analysis to assess and illustrate the breadth of the impact and factors that contribute to the achievement of intended program outcomes and returns on investments for project recipients. Case studies included, at a minimum, interviews with project recipients, and a review of project files and performance reports.
- Matched pair analysis: Statistics Canada was contracted to conduct a matched pair analysis where economic indicators of Stream C project recipients were compared with groups of similar sized companies in similar industries who did not participate in AAFC innovation programs. With a match rate of 75.7%, Statistics Canada were able to clean the data records based on their Generic Survey Universe File, a Business Register database and limit the comparison to same criteria as Stream C recipients, such as employment of less than 250.
- Cost-benefit analysis: The cost-benefit analysis determined the economic benefits of the Stream C and compared these benefits with the costs of delivering the program.
B. Methodological limitations
| Limitation | Mitigation strategy | Impact on evaluation |
|---|---|---|
| Data accuracy issues in Stream C project databases (for example, inaccurate start dates, missing information on private sector leverage, lack of clarity for definitions of some indicators, etc.) | Reviewed individual project Contribution Agreements and Work Plans to correct inaccuracies and fill in missing data gaps. Evidence was supplemented through interviews with project recipients (for example, reported impacts resulting from projects). | Most data accuracy issues and gaps were addressed; however, differences in how some variables are defined (for example, business days) may result in some discrepancies when comparing figures across data sources. |
| Limited number of interviews with program stakeholders reduced case studies from the plan eight to six. | Combined interview responses with evidence from the file review. | May not have fully represented stakeholder views. |
| Program impact data based on limited, self-reported results. | Used variety of information sources to assess program impact. | May not have full results on program impacts. |
Annex B: Stream C: Enabling Commercialization and Adoption logic model
| Objectives | To accelerate the pace of innovation by facilitating the demonstration, commercialization and/or adoption of innovative products, technologies, processes, practices and/or services in order to enhance economic growth, productivity, competitiveness, adaptability and sustainability of the Canadian agriculture, agri-food and agri-based products sector and assist in capturing opportunities for the sector in domestic and international markets. |
|---|---|
| Program components | Enabling Commercialization and Adoption |
| Activities |
|
| Outputs |
Program management and oversight products: Received applications, approval/rejection letters, contribution agreements prepared for review, financial claims processed. Recipient outputs: Commercialization projects and Demonstration projects. |
| Immediate outcomes | Sector has access to government and private investment capital to support demonstration, commercialization and adoption of innovative technologies, processes, products and services |
| Intermediate outcomes | The sector develops the capacity to commercialize products, processes or services. |
| End outcomes | The sector produces, adopts, and commercializes innovative products, processes, practices, services and technologies. |
| Link to PAA | PA 3.1: "Science, Innovation and Adoption" |
| AAFC strategic outcome | Strategic Outcome 3: “an innovative agriculture, agri-food and agri-based products sector” |
| Source: Stream C Program Performance Measurement and Risk Management Strategy. | |
Annex C: Other programs related to innovation
| Type | Examples of organizations and programs |
|---|---|
| Federal government programs |
|
| Crown corporations |
|
| Provincial government programs |
|
| Non-profit organizations |
|
| Venture capital organizations |
|
Annex D: Case studies
A total of six case studies were undertaken to assess and illustrate the breadth of the impact and factors that contribute to the achievement of intended program outcomes and returns on investments for project recipients. Case studies were to compensate for further analysis since projects were expect to report on results six months to a year after they were completed or after the end of the program in March 31, 2018. Additional case studies were considered, however, due to limited information and challenges reaching project proponents for interviews, these case studies were not included in the final analysis. Case studies were selected using various criteria such as a mix of provinces, impacted primary agricultural industries, project types (for example commercialization, adoption, demonstration), project sizes, and based on the availability of project performance data. Projects that were scheduled to be complete at least one year ago were given priority.
The six cases studies are listed below:
| # | Case studies |
|---|---|
| 1 | Integration of farm software/apps and sensor/equipment data in one place |
| 2 | Commercialization of Clean Seed Agricultural Technologies Smart SeederTM |
| 3 | Commercialization of the PhytoCleanTM Extraction Method |
| 4 | Modernization of a packing plant |
| 5 | Production of BioBased succinic acid employing yeast at a new plant in Sarnia, ON |
| 6 | Modernizing Hemp Oil Canada to meet growing domestic and international market needs |
For each case study, the following activities were undertaken at a minimum:
- Identifying proponents and partners involved in design and implementation of the case study projects;
- Developing interview questions and protocols necessary to conduct individual interviews;
- Conducting telephone interviews based on the interview questions and protocols developed;
- Requesting documents and files demonstrating success of the projects;
- Conducting a detailed review of all documents and materials (for example, project proposals, annual and progress reports, budget and outputs generated by the project) related to each case study project; and
- Conducting content analysis of all the collected data (such as, results of interviews, and additional documents and files).
Annex E: Examples of impacts resulting from Stream C projects
Production/per unit cost savings
Examples:
- Decreasing production costs by 20% for an organic greenhouse company. A project undertaken by an organic greenhouse company aimed to modernize and commercialize new to Canada automated greenhouse growing technologies which would reduce cost, increase efficiency and productivity, and displace the importation of California greens. The project has reduced production costs by 20% (through improved automation and reduced energy needs), increased food safety, and expanded the scale of production, which allowed the company to serve large national food retail chains. Domestic sales have increased from $2.5-million to $60-million.
- A reduced cost of drying a specialty ingredient from $25 USD per kilogram (kg) to $5 USD per kg.
- An annual $2.5-million in actual production cost savings.
- A steady decrease in the per unit production cost of deli meat, from $1.83/kg to $0.75/kg in 2015, and $0.53/kg in 2017.
Increased revenue
Examples:
- Increasing revenues from export markets from $7.6-million to $20.0-million by implementing new-to-sector processing equipment for an oilseed manufacturer. A project undertaken by an oilseed manufacturer with a reputation of the highest quality producer of its kind in the world aimed to implement new to sector and North America technology which would significantly enhance food quality features, enable future product innovation, and meet international product demands. The project resulted in expanded export revenues from $7.6-million to $20-million, increased full-time equivalent jobs from 22 to 45 jobs, and further investments in the company through its acquisition by a major Canadian competitor who, together with the recipient, generate a combined $80-million in revenues annually.
Increased production volume
Examples:
- An increase in production volume by 10 times.
- A 10% increase in production value at a flour milling plant, and a microgreens plant increased its production volume by 20%.
- A 3% volume increase in 2017 versus the same period in 2016 and projected a 9% increase in April 2018 versus April 2017.
- An increase from 1.4 million kg to 2.0 million kg in annual production of feta and ricotta.
Increased agricultural input
Examples:
- Increasing demand for edible beans and soybeans by $47.6-million for a crop processing and marketing company. A project undertaken by a crop processing and marketing company aimed to invest in innovative automated, high-speed, high-volume packaging technology to meet international volume, quality, and pricing demands. The project resulted in an increase in demand for edible beans and soybeans by $47.6-million.
- An increase from 0 to 688,876 bushels of corn, as the project continues to ramp up.
- An increase from 15,000 kg to 3.7 million kg in sweet potatoes.
- An increase from 565.0 million liters of milk per year to 570.0 million liters per year.
- An increase from 397,629 metric tons of corn to 442,416 metric tons.
- An increase from 3.6 million pounds (lbs) to 6.4 million lbs in organic hemp seeds.
- An increase from 3.8 million lbs to 16.8 million lbs of wild blueberries; the recipient noted that without this growth initiative, the industry would be in crisis to provide processing of the wild blueberry crop.
- An increase from 4.2 million litres to 13 million litres in cow milk, 1.7 million litres to 2.0 million litres in sheep milk, and 1.1 million litres to 1.9 million litres in goat milk.
Increased private sector investment and spin-off projects
Example:
- Securing a $6.5-million spin-off investment for a precision/digital agriculture focused start-up. A project undertaken by a precision/digital agriculture focused start-up aimed to commercialize a platform that integrates farm software, apps and sensor and equipment data in one place to allow farmers to have greater control over that information. The project resulted in the technology being licensed by a US-based machinery company and helping the recipient to secure additional private sector investment of $500,000 in equity and $6-million in venture capital to launch a related spin-off technology.
Increased development of innovative products, technologies, processes, or services
Example:
- Establishing the first company in the world to produce and sell bio-based succinic acid using a proprietary manufacturing process. A project undertaken by a bioproduct manufacturing start-up aimed to construct a large-scale facility to produce and sell bio-succinic acid from corn sugar using a proprietary manufacturing process. Succinic acid is a commercialized product used in a wide range of items including paints, adhesives, flavour additives, and cosmetics. It is the method through which the company produces succinic acid that is innovative: it is carbon neutral and derives the acid from renewable feedstocks, leaving a smaller environmental footprint than products derived from petroleum-based compounds. The plant is the world's largest commercial plant to produce bio-based succinic acid and has created 60 highly skilled jobs. As of 2017, the project has also resulted in $8.9-million in annual exports to 70 customers, mostly in the U.S., Europe and China.
- A company purchased and installed new technology and equipment to manufacture healthy organic granola and bar snack products, and used a new formulation and process to the snack food industry.
- A company was involved the design, fabrication, and installation of a first-to-industry undercarriage wash system for livestock transportation equipment, which improved the Canadian animal transportation industry's bio-security and addressed the threat of Porcine Epidemic Diarrhea.
Reduced footprint of facilities and number of jobs
Example:
- Five production facilities amalgamated to one facility, and an estimated net job loss of 1,550. A project undertaken which replaced five production facilities with one new facility, of which Stream C funded the installation of select equipment in the new facility. It was estimated that 2,700 positions would be eliminated and 1,150 new positions would be created. The company stated actual job losses were up to 6,000 (Employment was not a performance measure for this project).