

Note: This report includes forecasting data that is based on baseline historical data.
Executive summary
The United States (US) economic outlook has continued to improve, both consumer spending and business investment experienced are recovering close to end of 2019 levels (Euromonitor, May 2021). On the downside, there is 18-28% probability that US real gross domestic product (GDP) could down to 4.0% in 2021 and 2.3% in 2022 (Euromonitor, May 2021).
In 2020, the estimate of US retail e-commerce sales was $759.4 billion, an increase of 31.7% from 2019, with a compound annual growth rate (CAGR) of 18.7% from 2016 to 2020. From 2019 to 2020, the growth of e-commerce retail sales was about ten times higher than that of the total retail sales.
Among the top ten e-grocery markets, the US experienced the most significant sales growth from 2019 to 2020 at 119.1%. Over the forecast period, it will be challenging for the US to maintain the three-digit sales growth like in the 2019-2020 period as store-based retailing will recovery after the worst days of the pandemic. However, the US e-grocery sales will continue to increase at a CAGR of 6.3% from 2021 to 2025 reaching US$106.0 billion in 2025.
After China, the US is one of the countries that has the best market potential to support higher e-commerce sales (Euromonitor, e-commerce readiness model, 2020) particularly for packaged foods and alcoholic beverage categories.
Despite this significant growth, the US e-grocery continues to account for a minor part of e-commerce sales with a market share of 4.2% in 2020. In 2025, e-grocery sales are expected to reach US$106.0 billion with a CAGR of 6.3% over the forecast period.
In 2020, Canada was the second biggest consumer-oriented agri-food products exporter to the US after Mexico, reaching US$17.0 billion in 2020 with a CAGR of 4.8% from 2016 to 2020. Between January 2016 and December 2020, 5,109 food and drink products were launched online in the US. And Canada was American's biggest foreign manufacturer of online food and drink products in terms of the number of product launches.
Socioeconomic profile
With President Biden's historical fiscal stimulus and growing COVID-19 vaccination rates, the US economic outlook has continued to improve and both consumer spending and business investment experiences are recovering close to end of 2019 levels (Euromonitor, May 2021). Real GDP is now expected to increase to 6.4% in 2021 and 3.5% in 2022 (International Monetary Fund, April 2021). On the downside, there is 18-28% probability that unrealised herd immunity, the spread of worrying new various variants and declining private sector confidence could cut US real GDP to 4.0% in 2021 and 2.3% in 2022 (Euromonitor, May 2021).
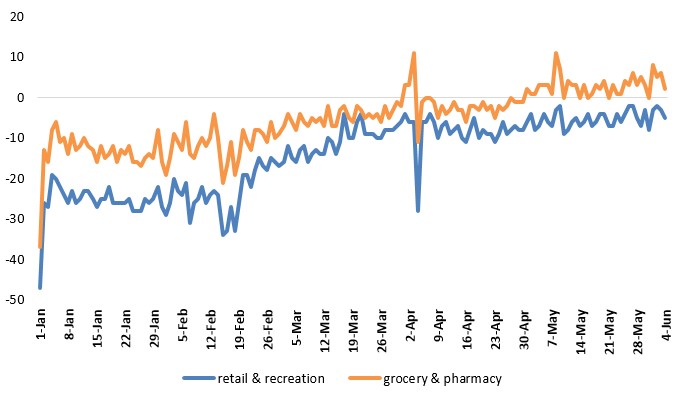
US consumer confidence remained strong and stable during May 2021. The Conference Board Consumer Confidence Index dropped by 0.3% (+36.4% year-over-year) to 117.2 during May following three consecutive months of firm gain to 117.5 during April (The Conference Board & Haver Analytics, May 25, 2021). Out-of-home spend intent is also recovering. Based on Google mobility data collected in the US, the decline of consumers' mobility trend to retail & recreation places and grocery & pharmacy places have narrowed, respectively, from −47.0% and −37.0% in January 1, 2021 to −5.0% and 2% in June 4, 2021.
Even though some consumers doing e-groceries for the first time will certainly return to their traditional shopping behaviours after the pandemic, many will not (Euromonitor, June 2020). McKinney US consumer sentiment survey found that 29% respondents indicated that they had tried new digital shopping method during the
Covid-19 and 81% of them intent to stick with this new shopping behavior after the pandemic (McKinney, May 2021). As a result, there will be a permanent shift towards e-grocery.
Description of above image
| Date | Retail and recreation | Grocery and pharmacy |
|---|---|---|
| January 1 | −47 | −37 |
| January 2 | −26 | −13 |
| January 3 | −27 | −16 |
| January 4 | −19 | −8 |
| January 5 | −20 | −6 |
| January 6 | −22 | −11 |
| January 7 | −24 | −10 |
| January 8 | −26 | −14 |
| January 9 | −23 | −9 |
| January 10 | −26 | −13 |
| January 11 | −25 | −12 |
| January 12 | −23 | −10 |
| January 13 | −23 | −12 |
| January 14 | −25 | −13 |
| January 15 | −27 | −16 |
| January 16 | −25 | −12 |
| January 17 | −25 | −15 |
| January 18 | −22 | −14 |
| January 19 | −26 | −12 |
| January 20 | −26 | −16 |
| January 21 | −26 | −13 |
| January 22 | −26 | −14 |
| January 23 | −25 | −12 |
| January 24 | −28 | −16 |
| January 25 | −28 | −16 |
| January 26 | −28 | −17 |
| January 27 | −25 | −15 |
| January 28 | −26 | −14 |
| January 29 | −25 | −15 |
| January 30 | −22 | −8 |
| January 31 | −27 | −16 |
| February 1 | −29 | −19 |
| February 2 | −26 | −15 |
| February 3 | −20 | −9 |
| February 4 | −23 | −11 |
| February 5 | −24 | −13 |
| February 6 | −21 | −6 |
| February 7 | −31 | −14 |
| February 8 | −26 | −15 |
| February 9 | −25 | −12 |
| February 10 | −22 | −10 |
| February 11 | −26 | −12 |
| February 12 | −24 | −10 |
| February 13 | −23 | −4 |
| February 14 | −24 | −10 |
| February 15 | −34 | −21 |
| February 16 | −33 | −17 |
| February 17 | −27 | −11 |
| February 18 | −33 | −19 |
| February 19 | −26 | −15 |
| February 20 | −19 | −8 |
| February 21 | −19 | −11 |
| February 22 | −22 | −13 |
| February 23 | −18 | −8 |
| February 24 | −15 | −8 |
| February 25 | −17 | −9 |
| February 26 | −18 | −11 |
| February 27 | −15 | −6 |
| February 28 | −16 | −10 |
| March 1 | −17 | −9 |
| March 2 | −16 | −7 |
| March 3 | −12 | −4 |
| March 4 | −15 | −6 |
| March 5 | −16 | −8 |
| March 6 | −13 | −4 |
| March 7 | −12 | −6 |
| March 8 | −16 | −7 |
| March 9 | −14 | −5 |
| March 10 | −13 | −6 |
| March 11 | −14 | −5 |
| March 12 | −14 | −7 |
| March 13 | −10 | −2 |
| March 14 | −11 | −7 |
| March 15 | −14 | −7 |
| March 16 | −11 | −3 |
| March 17 | −4 | −2 |
| March 18 | −10 | −5 |
| March 19 | −10 | −6 |
| March 20 | −6 | −2 |
| March 21 | −4 | −3 |
| March 22 | −9 | −5 |
| March 23 | −9 | −4 |
| March 24 | −9 | −5 |
| March 25 | −10 | −4 |
| March 26 | −10 | −6 |
| March 27 | −8 | −2 |
| March 28 | −8 | −5 |
| March 29 | −8 | −3 |
| March 30 | −7 | −1 |
| March 31 | −6 | −2 |
| April 1 | −4 | 3 |
| April 2 | −6 | 3 |
| April 3 | −6 | 11 |
| April 4 | −28 | −11 |
| April 5 | −6 | −1 |
| April 6 | −6 | 0 |
| April 7 | −4 | 0 |
| April 8 | −6 | −1 |
| April 9 | −10 | −5 |
| April 10 | −7 | −2 |
| April 11 | −6 | −4 |
| April 12 | −9 | −3 |
| April 13 | −8 | −1 |
| April 14 | −7 | −3 |
| April 15 | −10 | −3 |
| April 16 | −11 | −6 |
| April 17 | −8 | −2 |
| April 18 | −5 | −2 |
| April 19 | −10 | −3 |
| April 20 | −8 | −1 |
| April 21 | −9 | −3 |
| April 22 | −9 | −2 |
| April 23 | −11 | −5 |
| April 24 | −9 | −2 |
| April 25 | −6 | −3 |
| April 26 | −9 | −2 |
| April 27 | −8 | 0 |
| April 28 | −7 | −1 |
| April 29 | −8 | −1 |
| April 30 | −8 | −1 |
| May 1 | −6 | 2 |
| May 2 | −4 | 1 |
| May 3 | −8 | 1 |
| May 4 | −7 | 3 |
| May 5 | −4 | 3 |
| May 6 | −6 | 3 |
| May 7 | −7 | 1 |
| May 8 | −3 | 11 |
| May 9 | −2 | 7 |
| May 10 | −9 | 0 |
| May 11 | −8 | 4 |
| May 12 | −6 | 3 |
| May 13 | −5 | 3 |
| May 14 | −7 | 0 |
| May 15 | −6 | 3 |
| May 16 | −4 | 0 |
| May 17 | −7 | 1 |
| May 18 | −6 | 3 |
| May 19 | −4 | 2 |
| May 20 | −4 | 4 |
| May 21 | −7 | 0 |
| May 22 | −7 | 3 |
| May 23 | −4 | 1 |
| May 24 | −6 | 1 |
| May 25 | −4 | 4 |
| May 26 | −2 | 3 |
| May 27 | −2 | 6 |
| May 28 | −5 | 3 |
| May 29 | −7 | 5 |
| May 30 | −3 | 3 |
| May 31 | −8 | 0 |
| June 1 | −3 | 8 |
| June 2 | −2 | 5 |
| June 3 | −3 | 6 |
| June 4 | −5 | 2 |
Source: Google COVID-19 Community Mobility Reports, June 8, 2021.
Note (quoted directly from Google):
- Retail and recreation: mobility trends for places like restaurants, cafes, shopping centers, theme parks, museums, libraries, and movie theaters.
- Grocery and pharmacy: mobility trends for places like grocery markets, food warehouses, farmers markets, specialty food shops, drug stores, and pharmacies.
- The baseline is the median value, for the corresponding day of the week, during the 5-week period Januay 3 to February 6, 2020.
- The graphic shows trends over several weeks with the most recent data representing approximately 2-3 days ago.
- Google calculates these insights based on data from users who have opted-in to Location History for their Google Account, so the data represents a sample of its users. As with all samples, this may or may not represent the exact behavior of a wider population.
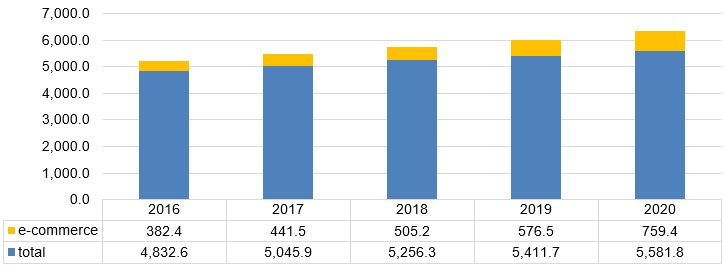
In 2020, the estimate of US retail e-commerce sales was $759.4 billion, an increase of 31.7% from 2019, with a CAGR of 18.7% from 2016 to 2020. Total retail sales for 2020 were estimated at $5,581.8 billion, an increase of 3.1% from 2019, with a CAGR of 3.7% from 2016 to 2020. From 2019 to 2020, the growth of e-commerce retail sales was about ten times higher than that of the total retail sales. And the share of e-commerce represented 13.6% of total retail sales in 2020 compared with 10.7% in 2019.
Description of above image
| Year | Total | E-commerce |
|---|---|---|
| 2016 | 4,832.6 | 382.4 |
| 2017 | 5,045.9 | 441.5 |
| 2018 | 5,256.3 | 505.2 |
| 2019 | 5,411.7 | 576.5 |
| 2020 | 5,581.8 | 759.4 |
Source: United States Census Bureau, 2021
Note:
- Estimates are adjusted for seasonal variation, but not for price changes. Total sales estimates are also adjusted for trading-day differences and moving holidays.
- E-commerce sales are sales of goods and services where an order is placed by the buyer or price and terms of sale are negotiated over an Internet, extranet, Electronic Data Interchange (EDI) network, electronic mail, or other online system. Payment may or may not be made online.
E-commerce market overview
Market trends
As a result of the fast digital shift during the pandemic, a greater share of goods was purchased online in nearly all countries in 2020 (Euromonitor, March 2021). Over the 2020-2025 forecast period, e-commerce is expected, by Euromonitor, to represent more than half of the absolute value growth in the global retail market (Euromonitor, March 2021). That expansion is roughly equivalent the size of the total value of products sold across all retail channels in the past five years.
In 2020, the US was the second largest e-commerce market in the world with retail sales amounting to US$1,817.1 billion with a CAGR of 14.9% from 2016 to 2020. The country was expected to reach US$3,230.2 billion in 2025 with a CAGR of 11.9% from 2021 to 2025.
| Market | 2016 | 2020 | CAGR* % 2016-2020 | 2021 | 2025 | CAGR* % 2021-2025 |
|---|---|---|---|---|---|---|
| World | 3,251.8 | 7,037.3 | 21.3 | 8,230.9 | 13,318.3 | 12.8 |
| China | 818.0 | 2,630.1 | 33.9 | 3,084.8 | 4,560.1 | 10.3 |
| United States | 1,042.4 | 1,817.1 | 14.9 | 2,061.9 | 3,230.2 | 11.9 |
| United Kingdom | 175.5 | 272.4 | 11.6 | 333.9 | 579.1 | 14.8 |
| Japan | 164.3 | 230.3 | 8.8 | 246.1 | 316.6 | 6.5 |
| South Korea | 67.1 | 189.0 | 29.5 | 221.2 | 354.4 | 12.5 |
| Germany | 87.4 | 141.0 | 12.7 | 161.7 | 271.3 | 13.8 |
| Russia | 22.5 | 125.0 | 53.5 | 158.2 | 315.7 | 18.9 |
| France | 75.7 | 115.4 | 11.1 | 137.9 | 228.1 | 13.4 |
| Australia | 82.1 | 103.7 | 6.0 | 112.3 | 168.4 | 10.7 |
| Canada | 39.0 | 70.2 | 15.8 | 83.0 | 130.4 | 12.0 |
|
Source: Euromonitor, 2021 *CAGR: Compound annual growth rate |
||||||
In the food and drink category, the US was the first biggest e-grocery market in the world with retail sales amounting to US$76.1 billion in 2020, representing 30.4% of the global market share. The US e-grocery market registered a CAGR of 47.5% from 2016 to 2020.
| Market | 2016 | 2017 | 2018 | 2019 | 2020 | CAGR* % 2016-2020 | Market share % in 2020 |
|---|---|---|---|---|---|---|---|
| World | 96.0 | 116.0 | 140.6 | 164.5 | 250.1 | 27.0 | |
| United States | 16.1 | 20.9 | 25.2 | 34.8 | 76.1 | 47.5 | 30.4 |
| China | 33.6 | 40.0 | 49.7 | 57.1 | 67.5 | 19.0 | 27.0 |
| United Kingdom | 8.4 | 8.8 | 10.2 | 10.6 | 18.8 | 22.5 | 7.5 |
| South Korea | 7.6 | 10.5 | 13.6 | 14.6 | 16.7 | 21.9 | 6.7 |
| France | 6.9 | 7.7 | 8.8 | 8.9 | 12.1 | 14.9 | 4.8 |
| Japan | 7.5 | 8.0 | 8.8 | 9.6 | 11.0 | 10.0 | 4.4 |
| Australia | 1.7 | 2.2 | 2.6 | 3.0 | 4.0 | 24.4 | 1.6 |
| Spain | 1.4 | 1.6 | 1.8 | 2.1 | 3.3 | 23.2 | 1.3 |
| Netherlands | 0.9 | 1.1 | 1.5 | 1.8 | 3.0 | 36.5 | 1.2 |
| Germany | 1.2 | 1.4 | 1.9 | 2.1 | 2.8 | 24.4 | 1.1 |
| Canada (14th) | 0.4 | 0.5 | 0.7 | 0.9 | 1.9 | 48.3 | 0.8 |
|
Source: Euromonitor, 2021 *CAGR: Compound annual growth rate |
|||||||
In the past, the US fell behind most other developed markets in terms of e-grocery penetration, but the lockdown caused by Covid-19 has abruptly accelerated the development of e-grocery (Euromonitor, 01 Fed 2021). Among the top ten e-grocery markets, the US experienced the most significant sales growth from 2019 to 2020 at 119.1%, followed by Canada (101.2%) and the United Kingdom (UK) (78.2%). Over the forecast period, it will be challenging for the US to maintain the three-digit sales growth like in the 2019-2020 period as store-based retailing will recovery after the worst days of the pandemic. However, the US e-grocery sales will continue to increase at a CAGR of 6.3% from 2021 to 2025 reaching US$106.0 billion in 2025.
| Market | 2021 | 2022 | 2023 | 2024 | 2025 | CAGR* % 2021-2025 | Market share (%) in 2025 |
|---|---|---|---|---|---|---|---|
| World | 276.1 | 299.7 | 325.2 | 366.5 | 412.6 | 10.6 | |
| China | 75.5 | 84.4 | 94.1 | 104.4 | 115.1 | 11.1 | 46.0 |
| United States | 82.9 | 80.7 | 78.7 | 90.9 | 106.0 | 6.3 | 42.4 |
| United Kingdom | 18.4 | 20.1 | 21.7 | 22.9 | 24.0 | 6.9 | 9.6 |
| South Korea | 17.8 | 18.9 | 20.1 | 21.2 | 22.4 | 5.8 | 9.0 |
| Japan | 12.4 | 14.0 | 15.9 | 17.8 | 20.0 | 12.6 | 8.0 |
| France | 13.6 | 14.7 | 15.6 | 16.5 | 17.6 | 6.7 | 7.0 |
| India | 4.2 | 6.3 | 8.9 | 12.2 | 16.1 | 39.7 | 6.5 |
| Australia | 4.1 | 4.8 | 5.7 | 6.6 | 7.7 | 17.5 | 3.1 |
| Russia | 2.9 | 3.7 | 4.6 | 5.4 | 5.9 | 19.5 | 2.3 |
| Netherlands | 3.7 | 4.2 | 4.8 | 5.3 | 5.8 | 12.2 | 2.3 |
| Canada (11th) | 2.5 | 3.3 | 4.1 | 4.9 | 5.8 | 22.8 | 2.3 |
|
Source: Euromonitor, 2021 *CAGR: Compound annual growth rate |
|||||||
E-grocery readiness
The total number of internet users in the US increased by 2% to 283 million in 2020, with 91% of the population online. While 91% of the US population was online in 2020, 71% of the population accessed the internet via mobile phones, while 36% of the population accessed the internet via a laptop, netbook, notebook or tablet (Euromonitor, May 2021). A strong shift towards e-commerce has been obvious even before Covid-19. 43% of Euromonitor' survey respondents in the US, including 61% of millennials, did at-home online shopping at least weekly, versus a global average of 29%. The main motivations for online shopping were free shipping and best price (Euromonitor, August 2020).
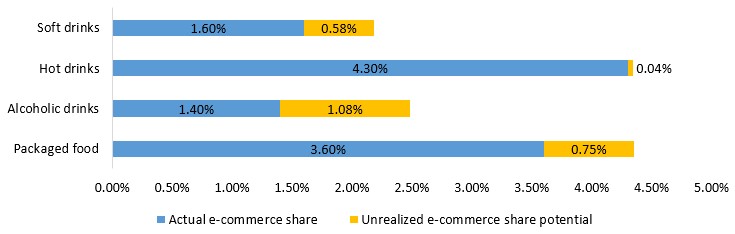
After China, the US is one of the countries that has the best market potentials to support higher e-commerce sales after the Covid-19 (Euromonitor, e-commerce readiness model, 2020). And packaged food, alcohol drinks are prime sub-sectors of food and drinks for sustained American e-grocery growth post-pandemic.
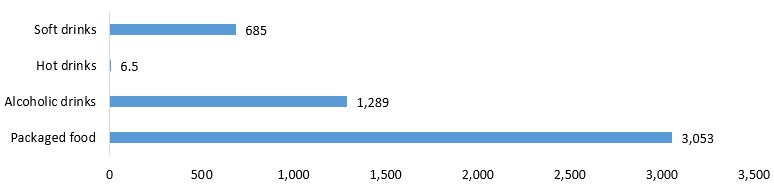
The actual e-commerce share for packaged food in the US is 3.6% and has an unrealized potential of US$ 3,053 million and 0.7% unrealized e-commerce share potential. New consumers adapting to online packaged food shopping will keep doing so after the pandemic as they enjoy added convenience even after safety concerns subside (Euromonitor, Oct 2020).
The actual e-commerce share for alcoholic drinks in the US is 1.4% and has an unrealized potential of US$ 1,289 million and 1.08% unrealized e-commerce share potential. According to Rabobank's US online alcohol report, "alcohol brands are losing billions of dollars in online sales opportunities every year, and they are missing a critical opportunity to build digital relationships with millions of omni-channel consumers. If alcohol companies are not able to effectively participate in the online ecosystem, e-commerce could become a wedge that separates alcohol brands from their consumers"(Rabobank 2019). As American consumers have increased their awareness of alcohol e-grocery during the pandemic, alcohol drinks' shift to e-commerce will be sustained post-pandemic (Rabobank 2020).
Description of above image
| Industry | Actual e-commerce share | Unrealized e-commerce share potential |
|---|---|---|
| Soft drinks | 1.60% | 0.58% |
| Hot drinks | 4.30% | 0.04% |
| Alcoholic drinks | 1.40% | 1.08% |
| Packaged food | 3.60% | 0.75% |
Source: Euromonitor's e-commerce readiness model 2020. The potential calculated base on the last complete year: 2019
Note: The primary output of this Euromonitor's e-commerce readiness model is a predicted share of e-commerce that could have been supported by the market in 2019 before COVID-19 became a global pandemic. The difference between this predicted share and actual share of e-commerce signals which countries and categories had the most unrealised ecommerce potential before the pandemic and are thus most likely to show sustained e-commerce growth afterwards.
E-commerce share potential: Difference between predicted e-commerce share from the E-Commerce Readiness Model and actual e-commerce share
During the pandemic, many states in the US have temporarily relaxed or clarified laws on alcohol delivery in response to the Covid-19, and some of these changes could become more permanent (IWSR). Post-pandemic, most states may reinstitute restrictions on alcohol delivery, this situation could stimulate the alcohol industry and associations to start advocating for straightforward and unambiguous regulations that offer clarity to retailers, remove unreasonable barriers to fulfilling online alcohol orders (Rabobank, April 2020). Canadian companies interested in wine, beer and spirits opportunities in the U.S will need to address the sector-specific logistical and regulatory complexities, as well as strong international competition in their export strategies (Canadian Trade Commissioner Service, 2022).
Description of above image
| Industry | Unrealized e-commerce value potential, million US$ |
|---|---|
| Soft drinks | 685 |
| Hot drinks | 6.5 |
| Alcoholic drinks | 1,289 |
| Packaged food | 3,053 |
Source: Euromonitor's e-commerce readiness model 2020. The potential calculated base on the last complete year: 2019
Note: The primary output of this Euromonitor's e-commerce readiness model is a predicted share of e-commerce that could have been supported by the market in 2019 before COVID-19 became a global pandemic. The difference between this predicted share and actual share of e-commerce signals which countries and categories had the most unrealised ecommerce potential before the pandemic and are thus most likely to show sustained e-commerce growth afterwards.
E-commerce value potential: Difference between predicted e-commerce sales from the E-Commerce Readiness Model and actual e-commerce sales
Retail sales
From 2016 to 2020, e-grocery was one of the most popular categories of e-commerce, witnessing robust growth in value sales. In 2020, US e-grocery sales reached US$76.1 billion and saw a CAGR of 47.5% from 2016 to 2020. Despite this significant growth, e-grocery continues to account for a minor part of e-commerce sales with a market share of 4.2% in 2020.
E-commerce sales in the US are expected to continue to see fast growth, with a CAGR of 11.9% from 2021 to 2025. In 2025, e-grocery sales are expected to reach US$106.0 billion with a CAGR of 6.3% over the forecast period.
| Category | 2016 | 2017 | 2018 | 2019 | 2020 | CAGR* % 2016-2020 |
|---|---|---|---|---|---|---|
| Total e-commerce | 1,042.4 | 1,192.3 | 1,362.2 | 1,562.1 | 1,817.1 | 14.9 |
| E-grocery | 16.1 | 20.9 | 25.2 | 34.8 | 76.1 | 47.5 |
|
Source: Euromonitor, 2021 *CAGR: Compound annual growth rate |
||||||
| Category | 2021 | 2022 | 2023 | 2024 | 2025 | CAGR* % 2021-2025 |
|---|---|---|---|---|---|---|
| Total e-commerce | 2,061.9 | 2,337.0 | 2,628.2 | 2,922.1 | 3,230.2 | 11.9 |
| E-grocery | 82.9 | 80.7 | 78.7 | 90.9 | 106.0 | 6.3 |
|
Source: Euromonitor, 2021 *CAGR: Compound annual growth rate |
||||||
Within the e-grocery category, packaged food made up about 34.5% of the sectors' online sales in 2020, while the remaining 65.5% are estimated to come from drinks and fresh foods. In 2020, the US total online sales of packaged foods, alcoholic drinks, and hot drinks reached US$31.7 billion with a CAGR of 38.9% from 2016 to 2020. As consumers are increasingly using online shopping for packaged non-perishable foods during the pandemic, the sales growth rate for all of the sub-categories of packaged foods soared over 79.2% from 2019 to 2020, making 2020 a remarkable year for the fast adoption of e-grocery. Post Covid-19, while the online sales growth rate will stabilize, e-grocery adoption will continue to grow (Mercatus, 2020).
| Category | 2016 | 2017 | 2018 | 2019 | 2020 | CAGR* % 2016-2020 |
|---|---|---|---|---|---|---|
| Packaged Food | 6,667.7 | 8,894.2 | 11,632.4 | 14,645.0 | 26,249.2 | 40.9 |
| Cooking ingredients and meals | 2,724.0 | 3,820.7 | 4,750.9 | 5,569.9 | 9,983.6 | 38.4 |
| Edible oils | 68.7 | 86.5 | 120.0 | 161.2 | 288.9 | 43.2 |
| Ready meals | 2,123.1 | 3,041.5 | 3,761.6 | 4,292.7 | 7,694.3 | 38.0 |
| Sauces, dressings and condiments | 444.0 | 581.3 | 732.3 | 928.9 | 1,665.0 | 39.2 |
| Soup | 58.6 | 67.7 | 85.4 | 107.9 | 193.5 | 34.8 |
| Sweet spreads | 29.6 | 43.7 | 51.7 | 79.2 | 142.0 | 48.0 |
| Dairy products and alternatives | 857.9 | 1,091.9 | 1,635.6 | 2,306.6 | 4,134.3 | 48.2 |
| Baby food | 458.8 | 605.6 | 975.6 | 1,388.9 | 2,489.5 | 52.6 |
| Dairy | 399.2 | 486.4 | 660.0 | 917.7 | 1,644.8 | 42.5 |
| Snacks | 1,993.8 | 2,595.3 | 3,317.0 | 4,328.3 | 7,757.6 | 40.4 |
| Confectionery | 543.9 | 715.4 | 923.1 | 1,146.1 | 2,054.3 | 39.4 |
| Ice cream and frozen desserts | 270.6 | 321.6 | 362.9 | 577.1 | 1,033.9 | 39.8 |
| Savoury Snacks | 505.9 | 749.2 | 1,009.4 | 1,373.6 | 2,462.1 | 48.5 |
| Sweet biscuits, snack bars and fruit snacks | 673.4 | 809.1 | 1,021.6 | 1,231.5 | 2,207.3 | 34.6 |
| Staple Foods | 1,091.9 | 1,386.3 | 1,928.9 | 2,440.2 | 4,373.8 | 41.5 |
| Baked goods | 399.4 | 425.8 | 531.1 | 674.5 | 1,209.0 | 31.9 |
| Breakfast cereals | 150.9 | 189.6 | 312.6 | 266.7 | 478.0 | 33.4 |
| Processed fruit and vegetables | 136.6 | 207.6 | 296.5 | 395.3 | 708.6 | 50.9 |
| Processed meat and seafood | 230.2 | 329.6 | 474.1 | 694.2 | 1,244.3 | 52.5 |
| Rice, pasta and noodles | 174.8 | 233.6 | 314.5 | 409.4 | 733.8 | 43.1 |
| Alcoholic Drinks | 1,467.4 | 1,731.6 | 2,077.9 | 2,536.7 | 4,316.1 | 31.0 |
| Hot Drinks | 377.2 | 415.6 | 491.2 | 697.8 | 1,134.2 | 31.7 |
| Total | 8,512.3 | 11,041.4 | 14,201.5 | 17,879.5 | 31,699.5 | 38.9 |
|
Source: Euromonitor, 2021 *CAGR: Compound annual growth rate |
||||||
Even the US e-grocery's soaring growth from Covid-19 is expected to be stabilized, Raobobak's analytical model, focusing on the US e-grocery sales, suggested that "the recent increase in focus and investment in e-commerce is justified. While there are exceptions, many food & beverage companies have stalled e-commerce investments for so long that there is little risk of an over-adjustment" (Rabobank, Jun 2020)
Key grocery retailers
Big stored-based grocery retailers like Walmart expanded online food and drink products ordering services during the pandemic. 2020 online e-grocery sales are currently unavailable. In 2019, Kroger.com recorded the highest online food and drink sales at US$2.3 billion in the US Amazon.com and Walmart.com registered the second and third highest online food and drink sales at US$1.7 billion and US$1.6 billion respectively.
In the US, 44.8% of stored-based grocery sales were made from the top-ten companies in 2020. Walmart was the biggest grocery retailer in 2020, reaching sales at US$316.5 billion with a market share of 25.3%. Kroger was the second biggest grocery retailer in 2020, reaching sales at US$112.9 billion with a market share of 9.0%. Albertsons was the third biggest grocery retailer in 2020, reaching sales at US$64.7 billion with a market share of 5.2%.
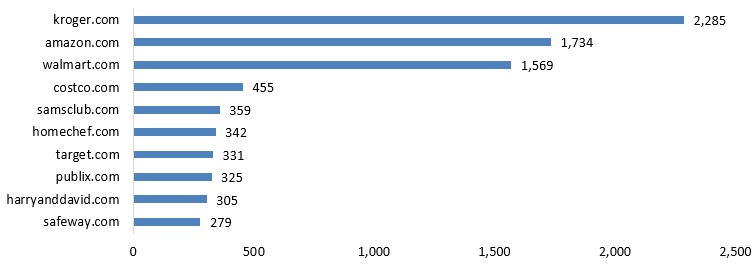
Description of above image
| Online stores | Net sales |
|---|---|
| kroger.com | 2,285 |
| amazon.com | 1,734 |
| walmart.com | 1,569 |
| costco.com | 455 |
| samsclub.com | 359 |
| homechef.com | 342 |
| target.com | 331 |
| publix.com | 325 |
| harryanddavid.com | 305 |
| safeway.com | 279 |
Source: Statista, March 2021
| Company Name | 2016 | 2017 | 2018 | 2019 | 2020 | CAGR* % 2016-2020 |
|---|---|---|---|---|---|---|
| Walmart Inc | 281.5 | 288.9 | 298.1 | 301.8 | 316.5 | 3.0 |
| Kroger Co | 98.6 | 102.3 | 99.5 | 101.1 | 112.9 | 3.4 |
| Albertsons Cos Inc | 56.0 | 55.8 | 55.6 | 57.2 | 64.7 | 3.7 |
| Koninklijke Ahold Delhaize NV | 42.1 | 41.8 | 42.4 | 43.2 | 49.5 | 4.1 |
| Publix Super Markets Inc | 34.0 | 34.6 | 36.1 | 38.1 | 45.3 | 7.4 |
| HE Butt Grocery Co | 20.7 | 22.0 | 22.1 | 25.1 | 25.8 | 5.6 |
| Meijer Inc | 16.6 | 17.7 | 18.0 | 19.4 | 20.3 | 5.2 |
| Aldi Group | 13.0 | 15.0 | 16.9 | 18.6 | 19.8 | 11.1 |
| Wakefern Food Corp | 15.9 | 16.2 | 16.4 | 16.5 | 19.1 | 4.6 |
| Amazon.com Inc | 15.7 | 15.9 | 16.1 | 16.0 | N/C[1] | |
|
Source: Euromonitor, 2021 *CAGR: Compound annual growth rate 1: Not calculable |
||||||
| Company Name | 2016 | 2017 | 2018 | 2019 | 2020 | CAGR* % 2016-2020 |
|---|---|---|---|---|---|---|
| Total | 100.0 | 100.0 | 100.0 | 100.0 | 100.0 | |
| Walmart Inc | 25.7 | 25.7 | 25.9 | 25.6 | 25.3 | −0.4 |
| Kroger Co | 9.0 | 9.1 | 8.7 | 8.6 | 9.0 | 0.0 |
| Albertsons Cos Inc | 5.1 | 5.0 | 4.8 | 4.9 | 5.2 | 0.5 |
| Koninklijke Ahold Delhaize NV | 3.8 | 3.7 | 3.7 | 3.7 | 4.0 | 1.3 |
| Publix Super Markets Inc | 3.1 | 3.1 | 3.1 | 3.2 | 3.6 | 3.8 |
| HE Butt Grocery Co | 1.9 | 2.0 | 1.9 | 2.1 | 2.1 | 2.5 |
| Meijer Inc | 1.5 | 1.6 | 1.6 | 1.6 | 1.6 | 1.6 |
| Aldi Group | 1.2 | 1.3 | 1.5 | 1.6 | 1.6 | 7.5 |
| Wakefern Food Corp | 1.5 | 1.4 | 1.4 | 1.4 | 1.5 | 0.0 |
| Amazon.com Inc | 1.4 | 1.4 | 1.4 | 1.3 | N/C | |
| Others | 32.9 | 32.9 | 33.1 | 32.9 | 31.8 | −0.8 |
|
Source: Euromonitor, 2021 *CAGR: Compound annual growth rate 1: Not calculable |
||||||
Trade overview and opportunities for Canada
In 2020, Canada was the second biggest consumer-oriented agri-food products exporter to the US after Mexico, reaching US$17.0 billion in 2020 with a CAGR of 4.8% from 2016 to 2020.
| Country | 2016 | 2017 | 2018 | 2019 | 2020 | CAGR* % 2016-2020 |
|---|---|---|---|---|---|---|
| World | 79,745.3 | 84,001.9 | 88,642.7 | 93,518.6 | 98,400.2 | 5.4 |
| Mexico | 18,779.0 | 21,097.2 | 22,310.5 | 26,134.2 | 27,923.5 | 10.4 |
| Canada | 14,091.4 | 14,695.0 | 15,547.3 | 16,351.7 | 17,006.5 | 4.8 |
| Italy | 3,297.8 | 3,480.1 | 3,814.1 | 4,061.2 | 4,385.4 | 7.4 |
| Singapore | 107.1 | 108.8 | 3,038.3 | 3,064.2 | 3,485.5 | 138.9 |
| China | 3,300.2 | 3,413.1 | 3,630.4 | 2,937.5 | 3,251.7 | −0.4 |
| Australia | 2,483.3 | 2,582.1 | 2,595.0 | 2,825.8 | 2,627.5 | 1.4 |
| France | 2,257.4 | 2,600.2 | 2,916.2 | 3,006.0 | 2,527.5 | 2.9 |
| Puerto Rico | 2,846.9 | 3,023.0 | 544.9 | 647.6 | 2,454.1 | −3.6 |
| New Zealand | 2,360.7 | 2,339.1 | 2,316.3 | 2,200.2 | 2,391.2 | 0.3 |
| Peru | 1,401.6 | 1,551.3 | 1,736.4 | 2,079.1 | 2,222.2 | 12.2 |
|
Source: Global Trade Tracker, 2021 |
||||||
Among the top-ten American total imports of consumer-oriented agri-food products in 2020, Canada was the biggest supplier of bread, pastry, cakes, biscuits and fresh/chilled boneless bovine meat with market share of 51.1% and 45.1% respectively. The country was also American's second biggest supplier of food preparations and tomatoes with market share of 13.0% and 13.5% respectively.
| HS 6 Code | Description | Total imports | 1st supplier | 2nd supplier | Canada ranking (market share %) |
|---|---|---|---|---|---|
| 210690 | Food preparations | 6,372.8 | Singapore | Canada | 2nd (13.0) |
| 220300 | Beer made from malt | 5,977.5 | Mexico | Netherlands | 5th (1.8) |
| 220421 | Wine of fresh grapes,in containers of <= 2 litres (excluding sparkling wine) | 4,215.0 | Italy | France | 4th (0.04) |
| 190590 | Bread, pastry, cakes, biscuits and other bakers' wares | 4,214.6 | Canada | Mexico | 1st (51.1) |
| 020130 | Fresh/chilled bovine meat, boneless | 3,002.1 | Canada | Mexico | 1st (45.1) |
| 070200 | Tomatoes, fresh/chilled | 2,918.3 | Canada | Mexico | 2nd (13.5) |
| 220210 | Waters, for direct consumption as a beverage | 2,799.6 | Austria | Switzerlad | 4th (5.9) |
| 020230 | Frozen, boneless meat of bovine animals | 2,655.6 | Australia | New Zealand | 8th (1.8) |
| 080390 | Fresh/dried bananas (excluding plantains) | 2,550.0 | Guatemalq | Costa Rica | N/O[1] |
| 080440 | Fresh/dried avocados | 2,540.5 | Mexico | Peru | 6th (0.00) |
|
Source: Global Trade Tracker, 2021 1: not offered |
|||||
From 2019 to 2020, Canada was the leading supplier of ten fastest-growing consumer-oriented agri-food products imported by the US. In 2020, Canada was America's biggest supplier of frozen fruit and nuts and sauces with a market share of 31.8% and 21.8% respectively. And Canada was America's second biggest supplier of uncooked pasta, fresh/chilled bovine cuts, tomatoes, pet food and food preparations with a market share of 9.7%, 34.6%, 13.5% 23.8% and 13.0% respectively.
| HS Code | Description | 2019 | 2020 | Growth rate in % | Canada ranking (market share %) in 2020 |
|---|---|---|---|---|---|
| 190219 | Uncooked pasta | 605.3 | 807.2 | 33.4 | 2nd (9.7) |
| 020230 | Frozen, boneless meat of bovine animals | 2,119.4 | 2,655.6 | 25.3 | 8th (1.8) |
| 020120 | Fresh/chilled bovine cuts, with bone in | 584.9 | 730.1 | 24.8 | 2nd (34.6) |
| 081190 | Frozen fruit and nuts | 574.6 | 706.0 | 22.9 | 1st (31.8) |
| 070200 | Tomatoes, fresh/chilled | 2,391.0 | 2,918.3 | 22.1 | 2nd (13.5) |
| 230910 | Dog or cat food, for retail sale | 1,022.9 | 1,231.7 | 20.4 | 2nd (23.8) |
| 210390 | Preparations for sauces and prepared sauces; | 1,136.2 | 1,349.7 | 18.8 | 1st (21.8) |
| 200599 | Vegetables, prepared/preserved | 533.9 | 619.1 | 16.0 | 5th (6.5) |
| 081020 | Fresh raspberries, blackberries, mulberries and loganberries | 1,355.7 | 1,527.6 | 12.7 | 3rd (0.05) |
| 210690 | Food preparations | 5,804.3 | 6,372.8 | 9.8 | 2nd (13.0) |
|
Source: Global Trade Tracker, 2021 Note: American's top-10 fastest-growing imports of consumer-oriented agri-food include products with at least 0.5% of total imports from the world in 2019 and the 10 fastest growth rate between 2019 and 2020 |
|||||
Trade assistance for Canadian exporters
Canada Agriculture and Food Trade Commissioner Service (TCS) can help companies who are looking to start doing business online with customers abroad, or who are already selling internationally. TCS' CanExport for Small and Medium Sized Enterprises (will be opening in April 2022) offers up to $50,000 to:
- help you break into international markets
- cover some costs related to digital adoption such as adaptation and translation of marketing tools
- search engine optimization
- expert advice from legal and business experts
- intellectual property protection
Source: Government of Canada, September 2020
Canada's' trade commissioner service has created following resources for Canadian agri-trade practitioners aiming to sell their products online internationally:
- U.S. State Sales Tax
- E-Commerce for Canadian food and beverage companies
- Shipping and logistics for the US 101
Export Development Canada (EDC) has built Export Help Hub which is "a collection of free, reliable resources about international sales, up-to-date market insights, regulations on customs, taxes and logistics and other related topics. With EDC's US market expertise, Canadian exporters will get trustable information about customs, market research, paying taxes, setting up US operations and more" (EDC, 2021)
Business Development Bank of Canada (BDC) provides e-commerce toolkit and suite of solutions to help Canadian entrepreneurs with various projects related to their online presence. Plus, BDC can finance the cost of its advisory services (BDC, 2021).
Post Canada offers e-commerce solutions and resources for Canadian exporters. Its e-commerce service can "help you turn online browsers into buyers, use your inventory more effectively, give your customers a great receiving experience, and build loyalty with them by offering easy returns" (Post Canada, 2021).
Product launch analysis
Between January 2016 and December 2020, 5,109 food and drink products were launched online in the US. And Canada was American's biggest foreign manufacture of online food and drink products in terms of the number of product launches. In the same period, 3,340 Canadian food and drinks were launched across all distribution channels in the US, among them 183 products were distributed online.
The top categories of food and drink products offered were snack/cereal/energy bars, nutritional & meal replacement drinks, sweet biscuits/cookies, baking ingredients & mixes and coffee. The top claims (may contain more than one claim per package) were kosher, low/no/reduced allergen, gluten free, GMO free and Social media. The top five companies were Amazon, Brandless, Williams-Sonoma, Target and Schwan's Home Service. The top three storage types were shelf stable, chilled and frozen.
| Product attributes | Yearly launch count | ||||
|---|---|---|---|---|---|
| 2016 | 2017 | 2018 | 2019 | 2020 | |
| Yearly product launches | 697 | 496 | 596 | 849 | 2471 |
| Top five categories | |||||
| Snack/cereal/energy bars | 117 | 61 | 34 | 76 | 122 |
| Nutritional and meal replacement drinks | 112 | 104 | 47 | 49 | 60 |
| Sweet biscuits/cookies | 45 | 21 | 33 | 42 | 113 |
| Baking ingredients and mixes | 9 | 10 | 17 | 28 | 181 |
| Coffee | 41 | 3 | 24 | 43 | 110 |
| Top five claims | |||||
| Kosher | 270 | 160 | 311 | 396 | 1127 |
| Low/no/reduced allergen | 298 | 189 | 268 | 362 | 1037 |
| Gluten free | 275 | 180 | 259 | 347 | 966 |
| GMO free | 185 | 132 | 244 | 299 | 871 |
| Social media | 218 | 111 | 156 | 209 | 599 |
| Top five companies | |||||
| Amazon.com | 3 | 10 | 30 | 93 | 165 |
| Brandless | 0 | 64 | 67 | 53 | 0 |
| Williams-Sonoma | 11 | 1 | 6 | 3 | 70 |
| Target | 2 | 1 | 5 | 11 | 60 |
| Schwan's Home Service | 12 | 9 | 18 | 25 | 7 |
| Top five launch types | |||||
| New product | 361 | 302 | 236 | 293 | 1010 |
| New variety/range extension | 220 | 115 | 220 | 368 | 914 |
| New packaging | 92 | 54 | 109 | 152 | 474 |
| Relaunch | 18 | 9 | 27 | 34 | 72 |
| New formulation | 6 | 16 | 4 | 2 | 1 |
| Top five locations of manufacture | |||||
| United States | 236 | 145 | 147 | 186 | 529 |
| Canada | 35 | 24 | 16 | 41 | 67 |
| Italy | 1 | 3 | 4 | 12 | 71 |
| Spain | 4 | 2 | 7 | 2 |
36 |
| Turkey | 1 | 2 | 0 | 4 | 42 |
| Top three storage types | |||||
| Shelf stable | 663 | 450 | 542 | 758 | 2212 |
| Chilled | 12 | 12 | 18 | 55 | 166 |
| Frozen | 22 | 34 | 36 | 36 | 93 |
|
Source: Mintel Global New Products Database, 2021 Note: The online food and drinks products are defined as food and drink products ordered from internet/mail: this option is used to identify products available through online (web-based) retailers or through mail-order catalogs |
|||||
Product examples
Original Blend K-Cup Pods
Source: Mintel Global New Products Database, 2021
| Company | Tim Hortons |
|---|---|
| Category | Hot beverages |
| Market | United States |
| Location of manufacture | Canada |
| Store name | Target.com |
| Store type | Internet / mail order |
| Date published | November 2019 |
| Launch type | New packaging |
| Price in local currency | $10.49 |
Tim Hortons Keurig Original Blend K-Cup Pods have been repackaged in an updated 6.67-ounce FSC-certified recyclable pack containing 18 0.37-ounce single serve recyclable K-cups pods. They are claimed to have the same great taste and a unique premium blend of medium roast 100% Arabica coffee beans with a smooth finish. This kosher-certified product is suitable for Keurig K-Cup machines and the ground is compostable.
Consumer Sentiment: 30% of consumers in our panel responded that they likely or definitely would buy this product, outperforming its subcategory.
All Natural Mussels with Vinegar and Garlic

Source: Mintel Global New Products Database, 2021
| Company | Triton Ocean Products |
|---|---|
| Category | Processed fish, meat and egg products |
| Market | United States |
| Location of manufacture | Canada |
| Store name | Worldmarket.com |
| Store type | Internet / mail order |
| Date published | April 2020 |
| Launch type | New product |
| Price in local currency | $7.99 |
Triton Ocean Products All Natural Mussels with Vinegar and Garlic are sourced from the waters of Notre Dame Bay in Newfoundland. The manufacturer states that mussels are rope-cultured and hand-selected for the freshest, highest-quality seafood snack, and infused with garlic and preserved using traditional techniques. This premium product is said to be a delicious addition to charcuterie spreads or enjoyed straight out of the jar. It is low in fat, contains 0% sugar, and retails in a 7.05-ounce pack.
Consumer Sentiment: 36% of consumers in our panel responded that they likely or definitely would buy this product, outperforming its subcategory.
Blueberry Blast Power SuperFruit Spread

Source: Mintel Global New Products Database, 2021
| Company | Crofters Food |
|---|---|
| Category | Sweet spreads |
| Market | United States |
| Location of manufacture | Canada |
| Store name | thrivemarket.com |
| Store type | Internet / mail order |
| Date published | June 2020 |
| Launch type | New variety / range extension |
| Price in local currency | $4.79 |
Crofter's Organic Blueberry Blast Power SuperFruit Spread comprises 75% fruit content of varietal fruit chosen with care, and is said to contain 33% less sugar than a preserve. This USDA Organic-certified product provides 4 grams added sugar and 30 calories per serving, is free from GMOs and naturally gluten free. According to the manufacturer, the premium product is made with organic sugar from an ethical and environmentally friendly source certified by Fair Trade IBD. It retails in a 16.5-ounce pack, bearing a QR code.
Consumer Sentiment: 43% of consumers in our panel responded that they likely or definitely would buy this product, outperforming its subcategory.
Chocolate Brownie Bakes

Source: Mintel Global New Products Database, 2021
| Company | Small Planet Foods |
|---|---|
| Category | Snacks |
| Market | United States |
| Location of manufacture | Canada |
| Store name | Target.com |
| Store type | Internet / mail order |
| Date published | October 2020 |
| Launch type | Relaunch |
| Price in local currency | $4.39 |
Lärabar Kids Chocolate Brownie Bakes have been relaunched with a new brand name, previously known as Lärabar Kid, and in a newly designed pack. The kosher-certified product is said to be baked with just nine ingredients, and is free from gluten, high fructose corn syrup, GMO ingredients and artificial sweeteners. It retails in a 5.76-ounce pack made with 100% recycled paperboard, containing six 0.96-ounce units, and bearing the Box Tops for Education.
Consumer Sentiment: 42% of consumers in our panel responded that they likely or definitely would buy this product, outperforming its subcategory.
Moonshine Moppin' Craft BBQ Sauce

Source: Mintel Global New Products Database, 2021
| Company | Kroger |
|---|---|
| Category | Sauces and seasonings |
| Market | United States |
| Location of manufacture | Canada |
| Store name | Kith |
| Store type | Internet / mail order |
| Date published | May 2021 |
| Launch type | New variety / range extension |
| Price in local currency | $3.19 |
Private Selection Moonshine Moppin' Craft BBQ Sauce is described as North Carolina style with apple cider vinegar and hot sauce. This spirit infused and small batch crafted product is tart and savory with moonshine whiskey notes. It retails in a 13.7-ounce pack.
Consumer Sentiment: 42% of consumers in our panel responded that they likely or definitely would buy this product, significantly outperforming its subcategory.
Berry Prenatal Smoothie with Vitamin D3 and Folic Acid

Source: Mintel Global New Products Database, 2021
| Company | Market Solutions Group |
|---|---|
| Category | Nutritional drinks and other beverages |
| Market | United States |
| Location of manufacture | Canada |
| Store name | Target.com |
| Store type | Internet / mail order |
| Date published | September 2020 |
| Launch type | New variety / range extension |
| Price in local currency | $11.99 |
Sweetie Pie Organics Berry Prenatal Smoothie with Vitamin D3 and Folic Acid is designed for before, during, and after pregnancy and recommended to be consumed once a day. This USDA Organic and kosher certified product contains natural vitamin D3 and folic acid, is suitable for vegans, and is free from dairy, gluten and added sugar. It retails in an 11.1-ounce recyclable pack.
Consumer Sentiment: 23% of consumers in our panel responded that they likely or definitely would buy this product, outperforming its subcategory.
Key definitions
- E-commerce
- refers to the sales of consumer goods to the general public via the internet through electronic devices such as mobile and tablets.
- E-grocery
- refers to online sales of food and drinks. This includes all packaged food, fresh food and drinks.
- Actual e-commerce share
- actual e-commerce share of category sales
- E-commerce share potential
- difference between predicated e-commerce share from the e-commerce readiness model and actual e-commerce share (Euromonitor, e-commerce readiness model, 2020)
- E-commerce value potential
- difference between predicated e-commerce sales from the e-commerce readiness model and actual e-commerce sales (Euromonitor, e-commerce readiness model, 2020)
For more information
The Canadian Trade Commissioner Service:
International Trade Commissioners can provide Canadian industry with on-the-ground expertise regarding market potential, current conditions and local business contacts, and are an excellent point of contact for export advice.
More agri-food market intelligence:
International agri-food market intelligence
Discover global agriculture and food opportunities, the complete library of Global Analysis reports, market trends and forecasts, and information on Canada's free trade agreements.
Agri-food market intelligence service
Canadian agri-food and seafood businesses can take advantage of a customized service of reports and analysis, and join our email subscription service to have the latest reports delivered directly to their inbox.
More on Canada's agriculture and agri-food sectors:
Canada's agriculture sectors
Information on the agriculture industry by sector. Data on international markets. Initiatives to support awareness of the industry in Canada. How the department engages with the industry.
Resources
- Business Development Bank of Canada, 2021, E-commerce and online presence
- Export Development Canada, 2021, Export Help Hub, Insights to guide smart export decisions
- Euromonitor, 01 February, 2021, Food and Drink E-Commerce in the US
- Euromonitor, May, 2021, Digital Landscape in the US
- Euromonitor, 31 May, 2021, Global Economic Forecasts: Q2 2021
- Euromonitor, 25 March 2021, Retail in Transition: Capitalising on Future E-commerce Opportunities
- Euromonitor, June 2020, The global state of online grocery in 2020
- Euromonitor, 2020, e-commerce readiness model
- Euromonitor, August 2020, Mega trend in the US
- Euromonitor, October 2020, The New Normal: Identifying the Markets Most Primed for Sustained E-Commerce Growth
- Global Trade Tracker, 2021.
- Government of Canada, September 2020, E-commerce Grow your global presence
- Haver Analytics, May 25, 2021, U.S. Consumer Confidence Remains Elevated During May
- International Monetary Fund, April 2021, World economic outlook
- IWSR, Will the US overtake China in online alcohol sales? Uber seems to think so
- Mercatus, 2020, eGrocery Adoption: The New Reality for Grocery Shopper Behavior
- McKinney, May 13 2021, Survey: US consumer sentiment during the coronavirus crisis
- Mintel Global New Products Database, 2021.
- Post Canada, 2021, Enhance your e-commerce operations
- Rabobank, Bourcard Nesin, December 2019, US Online Alcohol Sales Reach USD 2.6bn: The 2020 Alcohol E-Commerce Playbook
- Rabobank, Bourcard Nesin, April 2020, Will The Covid-19 Crisis Change Alcohol E-Commerce Forever? Like, Forever Ever?
- Rabobank,Bourcard Nesin, June 2020, Will Consumers Stick With Online Grocery? The Post-Covid World of US Online Grocery Growth
- Statista, Mars, 2021 Top online stores in the Food & Beverages segment in the U.S. in 2019, by e-commerce net sales
- The Conference Board, May 25 2021, Consumer Confidence Holds Steady In May
- United States Census Bureau, 2021, Latest Quarterly E-Commerce Report
Distribution Channel Series – E-grocery market in the United States
Global Analysis Report
Prepared by: Zhiduo Wang, Market Analyst
© Her Majesty the Queen in Right of Canada, represented by the Minister of Agriculture and Agri-Food (2022).
Photo credits
All photographs reproduced in this publication are used by permission of the rights holders.
All images, unless otherwise noted, are copyright Her Majesty the Queen in Right of Canada.
To join our distribution list or to suggest additional report topics or markets, please contact:
Agriculture and Agri-Food Canada, Global Analysis1341 Baseline Rd, Tower 5, 3rd floor
Ottawa ON K1A 0C5
Canada
Email: aafc.mas-sam.aac@agr.gc.ca
The Government of Canada has prepared this report based on primary and secondary sources of information. Although every effort has been made to ensure that the information is accurate, Agriculture and Agri-Food Canada (AAFC) assumes no liability for any actions taken based on the information contained herein.
Reproduction or redistribution of this document, in whole or in part, must include acknowledgement of agriculture and agri-food Canada as the owner of the copyright in the document, through a reference citing AAFC, the title of the document and the year. Where the reproduction or redistribution includes data from this document, it must also include an acknowledgement of the specific data source(s), as noted in this document.
Agriculture and Agri-Food Canada provides this document and other report services to agriculture and food industry clients free of charge.