

Note: This report includes forecasting data that is based on baseline historical data.
Executive summary
In 2021, the Philippine's imported a total of Can$54.2 million from the world in ice cream products. Top supplier markets were China, Indonesia, and Korea. Canada supplied a larger value of ice cream in 2020, yet was only the 14th largest provider at a value of Can$38,219 in 2021.
Retail sales of frozen dessert products in the Philippines totaled approximately US$367.2 million (8.9 million litres) in 2021. Ice cream accounted for 98.7% in sales and 1.3% in frozen yogurt sales, mostly amongst the dairy-based over water-based ice cream segments. In 2021, leading off-trade companies (and brands) were The Unilever Group (Selecta, Cornetto, Magnum), Nestlé S.A. (Nestlé, Drumstick, Lait, Pinipig) and San Miguel Corporation (Magnolia - Popsies).
In 2021, 99.8% of ice cream and frozen yogurt products were distributed through in-store grocery retailers, while 0.2% (US$0.8 million) in sales were sold through e-commerce services. Based on retailer selling prices, chocolate, strawberry, and mango ice cream types were the top flavors sold in the Philippines over the last year. Amongst the impulse ice cream category, 66.9% were served in cone format, followed by ice cream sticks at 21.6%, and 11.5% were served in another format.
Over the last year, foodservice sales of ice cream and frozen yogurt totalled US$16.0 million (2.5 million litres). In 2021, on-trade ice cream companies (and brands) served in Philippine Limited-Service Restaurants (LSRs) were the International Dairy Queen Incorporation (Dairy Queen), Kahala Corporation (Cold Stone Creamery), and Inspire Brands Incorporation (Baskin-Robbins).
Trade overview
In 2021, the Philippines imported a total of Can$54.2 million in ice cream (with or without cocoa) from the world. Top supplier markets were China (Can$29.5 million), Indonesia (Can$16.6 million), Korea (Can$2.8 million), Thailand (Can$1.9 million), and the United States (Can$1.4 million).
Canada was the 14th largest supplier of ice cream products at Can$38,219 in 2021. During COVID-19 in 2020, exports increased by 490.9% over the previous year at a value of Can$254.1 thousand with supply returning back to its average supply amount in 2021.
HS code (2105000001): Ice cream, with cocoa or not
| Markets | 2018 | 2019 | 2020 | 2021 | CAGR* (%) 2018-2021 | Market share (%) in 2021 |
|---|---|---|---|---|---|---|
| Total - imports | 18,104.3 | 30,270.8 | 32,009.3 | 54,167.0 | 44.1 | 100.0 |
| 1. China | 0.0 | 7,551.1 | 16,984.1 | 29,541.6 | 97.8 | 54.5 |
| 2. Indonesia | 7,767.3 | 13,894.9 | 8,139.3 | 16,629.1 | 28.9 | 30.7 |
| 3. Korea | 1,151.9 | 1,395.4 | 1,512.2 | 2,753.6 | 33.7 | 5.1 |
| 4. Thailand | 4,253.7 | 2,498.6 | 680.4 | 1,882.2 | −23.8 | 3.5 |
| 5. United States | 3,248.5 | 2,546.9 | 2,323.6 | 1,433.5 | −23.9 | 2.6 |
| 6. Italy | 101.9 | 219.9 | 133.9 | 592.4 | 79.8 | 1.1 |
| 7. Hungary | 0.0 | 0.0 | 471.0 | 454.3 | −3.5 | 0.8 |
| 8. Portugal | 0.0 | 0.0 | 0.0 | 269.3 | 0.5 | |
| 9. Australia | 0.0 | 28.9 | 61.8 | 202.9 | 165.2 | 0.4 |
| 10. Belgium | 0.0 | 0.0 | 0.0 | 105.7 | 0.2 | |
| Subtotal - top 10 | 16,523.3 | 28,135.7 | 30,306.2 | 53,864.8 | 48.3 | 99.4 |
| 14. Canada | 43.7 | 43.0 | 254.1 | 38.2 | −4.3 | 0.1 |
|
Source: Global Trade Tracker (GTT), 2022 *CAGR: Compound Annual Growth Rate |
||||||
Retail value sales of ice cream and frozen yogurt desserts
In 2021, retail sales of frozen dessert products in the Philippines totaled approximately US$367.2 million. Sales of ice cream accounted for 98.7% (US$362.4 million) with the remaining 1.3% (US$4.8 million) of sales going towards frozen yogurt. The frozen dessert segment has been growing at a CAGR of 2.3% (2016-2021) and is expected to grow at a CAGR of 7.5% (2021-2026).
Take-home & bulk dairy ice cream had the largest sales at US$208.0 million, closely followed by dairy-based, impulse - single served ice cream (US$144.3 million) in 2021. Meanwhile over the year, sales of impulse - single portion water ice cream accounted for 2.2% (US$7.9 million), followed by take-home & bulk - water ice cream at 0.6% (US$2.0 million), and plant-based ice cream totaled US$0.2 million. Between 2016 and 2021, plant-based ice cream had the largest growth at a CAGR of 14.9% with sales lost from within the impulse - single portion water ice cream segment (−1.2%). However, possibly due to lack of supply for specialty ice cream products early in the pandemic, there was 0% annual growth for plant-based ice cream with the largest growth amongst take-home - bulk water ice cream products (5.3%) over the 2021/2020 period.
| Category | 2016 | 2017 | 2018 | 2019 | 2020 | 2021 |
|---|---|---|---|---|---|---|
| Frozen desserts - grand total | 328.5 | 358.1 | 389.6 | 394.2 | 356.9 | 367.2 |
| Subtotal - take-home ice cream | 200.5 | 217.8 | 238.6 | 233.5 | 204.1 | 210.0 |
| Bulk dairy ice cream | 198.6 | 215.9 | 236.6 | 231.4 | 202.2 | 208.0 |
| Bulk water ice cream | 1.8 | 1.9 | 2.0 | 2.0 | 1.9 | 2.0 |
| Subtotal - impulse ice cream | 123.7 | 135.6 | 146.0 | 155.3 | 147.9 | 152.2 |
| Single portion dairy ice cream | 115.3 | 126.9 | 136.9 | 145.8 | 139.3 | 144.3 |
| Single portion water ice cream | 8.4 | 8.8 | 9.2 | 9.6 | 8.7 | 7.9 |
| Plant-based ice cream | 0.1 | 0.1 | 0.1 | 0.2 | 0.2 | 0.2 |
| Total - ice cream | 324.3 | 353.5 | 384.7 | 389.0 | 352.2 | 362.4 |
| Frozen yogurt | 4.2 | 4.5 | 4.9 | 5.2 | 4.7 | 4.8 |
|
Source: Euromonitor International, 2022 Note: All value is rounded up nearest million, so that food total may not equal to the sum of sub-sectors |
||||||
| Category | Annual growth (%) 2020-2021 | CAGR* (%) 2016-2021 | Total growth (%) 2016-2021 |
|---|---|---|---|
| Frozen desserts - grand total | 2.9 | 2.3 | 11.8 |
| Subtotal - take-home ice cream | 2.9 | 0.9 | 4.7 |
| Bulk dairy ice cream | 2.9 | 0.9 | 4.7 |
| Bulk water ice cream | 5.3 | 2.1 | 11.1 |
| Subtotal - impulse ice cream | 2.9 | 4.2 | 23.0 |
| Single portion dairy ice cream | 3.6 | 4.6 | 25.2 |
| Single portion water ice cream | −9.2 | −1.2 | −6.0 |
| Plant-based ice cream | 0.0 | 14.9 | 100.0 |
| Total - ice cream | 2.9 | 2.2 | 11.7 |
| Frozen yogurt | 2.1 | 2.7 | 14.3 |
|
Source: Euromonitor International, 2022 *CAGR: Compound annual growth rate |
|||
| Category | 2021 | 2022 | 2023 | 2024 | 2025 | 2026 |
|---|---|---|---|---|---|---|
| Frozen desserts - grand total | 367.2 | 379.7 | 408.8 | 442.9 | 482.4 | 526.6 |
| Subtotal - take-home ice cream | 210.0 | 216.5 | 231.4 | 248.4 | 267.6 | 288.8 |
| Bulk dairy ice cream | 208.0 | 214.5 | 229.3 | 246.1 | 265.2 | 286.3 |
| Bulk water ice cream | 2.0 | 2.0 | 2.1 | 2.2 | 2.4 | 2.5 |
| Subtotal - impulse ice cream | 152.2 | 158.0 | 171.9 | 188.7 | 208.5 | 231.2 |
| Single portion dairy ice cream | 144.3 | 150.1 | 163.4 | 179.5 | 198.6 | 220.3 |
| Single portion water ice cream | 7.9 | 7.9 | 8.5 | 9.2 | 10.0 | 10.9 |
| Plant-based ice cream | 0.2 | 0.3 | 0.3 | 0.3 | 0.4 | 0.4 |
| Total - ice cream | 362.4 | 374.8 | 403.6 | 437.4 | 476.5 | 520.4 |
| Frozen yogurt | 4.8 | 4.9 | 5.2 | 5.5 | 5.9 | 6.3 |
|
Source: Euromonitor International, 2022 Note: Base year for growth rate is 2021, which is actual retail value sales. Data for 2022 to 2026 is forecast by Euromonitor International. |
||||||
| Category | Annual growth (%) 2021-2022 | CAGR* (%) 2016-2021 | Total growth (%) 2021-2026 |
|---|---|---|---|
| Frozen desserts - grand total | 3.4 | 7.5 | 43.4 |
| Subtotal - take-home ice cream | 3.1 | 6.6 | 37.5 |
| Bulk dairy ice cream | 3.1 | 6.6 | 37.6 |
| Bulk water ice cream | 0.0 | 4.6 | 25.0 |
| Subtotal - impulse ice cream | 3.8 | 8.7 | 51.9 |
| Single portion dairy ice cream | 4.0 | 8.8 | 52.7 |
| Single portion water ice cream | 0.0 | 6.6 | 38.0 |
| Plant-based ice cream | 50.0 | 14.9 | 100.0 |
| Total - ice cream | 3.4 | 7.5 | 43.6 |
| Frozen yogurt | 2.1 | 5.6 | 31.3 |
|
Source: Euromonitor International, 2022 *CAGR: Compound annual growth rate |
|||
Foodservice and retail volume sales (on/off-trade)
In 2021, on/off trade sales volume of frozen dessert products in the Philippines totaled approximately 92.0 million litres. Retail sales of ice cream in volume terms accounted for 97.3% (89.5 million litres) with the remaining 2.7% (2.5 million litres) of volume sales coming from within the foodservice industry. Most of the sales came from retail bulk take-home and impulse dairy ice cream types, followed by retail water ice cream, frozen yogurt, and other foodservice unpackaged ice cream segments.
| Category | Data type | 2016 | 2017 | 2018 | 2019 | 2020 | 2021 |
|---|---|---|---|---|---|---|---|
| Ice cream | Total volume | 100.6 | 106.1 | 112.0 | 108.8 | 91.8 | 92.0 |
| Retail | 94.8 | 100.1 | 105.9 | 102.5 | 89.4 | 89.5 | |
| Foodservice | 5.8 | 5.9 | 6.1 | 6.2 | 2.3 | 2.5 | |
| Take-home ice cream | Total volume | 74.1 | 78.3 | 83.4 | 79.6 | 65.7 | 66.1 |
| Retail | 69.6 | 73.7 | 78.7 | 74.8 | 63.9 | 64.2 | |
| Foodservice | 4.5 | 4.6 | 4.7 | 4.8 | 1.8 | 1.9 | |
| Bulk take-home dairy ice cream | Total volume | 73.3 | 77.5 | 82.6 | 78.8 | 65.1 | 65.5 |
| Retail | 69.0 | 73.1 | 78.1 | 74.2 | 63.4 | 63.7 | |
| Foodservice | 4.3 | 4.4 | 4.5 | 4.6 | 1.7 | 1.8 | |
| Bulk take-home water ice cream | Total volume | 0.8 | 0.8 | 0.8 | 0.8 | 0.6 | 0.6 |
| Retail | 0.6 | 0.6 | 0.6 | 0.6 | 0.5 | 0.5 | |
| Foodservice | 0.2 | 0.2 | 0.2 | 0.2 | 0.1 | 0.1 | |
| Impulse ice cream | Total volume | 24.5 | 25.7 | 26.5 | 27.1 | 24.8 | 24.7 |
| - Dairy ice cream | Retail | 21.7 | 22.8 | 23.5 | 23.9 | 22.0 | 22.1 |
| - Water ice cream | Retail | 2.8 | 2.9 | 3.0 | 3.1 | 2.8 | 2.6 |
| Unpackaged ice cream | Total foodservice | 1.1 | 1.1 | 1.1 | 1.2 | 0.5 | 0.5 |
| Frozen yogurt | Total volume | 0.9 | 0.9 | 1.0 | 1.0 | 0.7 | 0.7 |
| Retail | 0.7 | 0.7 | 0.7 | 0.7 | 0.6 | 0.6 | |
| Foodservice | 0.2 | 0.2 | 0.2 | 0.3 | 0.1 | 0.1 | |
| Source: Euromonitor International, 2022 | |||||||
| Category | Data type | Annual growth (%) 2020-2021 | CAGR* (%) 2016-2021 | Total growth (%) 2016-2021 |
|---|---|---|---|---|
| Ice cream | Total volume | 0.2 | −1.8 | −8.5 |
| Retail | 0.1 | −1.1 | −5.6 | |
| Foodservice | 8.7 | −15.5 | −56.9 | |
| Take-home ice cream | Total volume | 0.6 | −2.3 | −10.8 |
| Retail | 0.5 | −1.6 | −7.8 | |
| Foodservice | 5.6 | −15.8 | −57.8 | |
| Bulk take-home dairy ice cream | Total volume | 0.6 | −2.2 | −10.6 |
| Retail | 0.5 | −1.6 | −7.7 | |
| Foodservice | 5.9 | −16.0 | −58.1 | |
| Bulk take-home water ice cream | Total volume | 0.0 | −5.6 | −25.0 |
| Retail | 0.0 | −3.6 | −16.7 | |
| Foodservice | 0.0 | −12.9 | −50.0 | |
| Impulse ice cream | Total volume | −0.4 | 0.2 | 0.8 |
| - Dairy ice cream | Retail | 0.5 | 0.4 | 1.8 |
| - Water ice cream | Retail | −7.1 | −1.5 | −7.1 |
| Unpackaged ice cream | Total foodservice | 0.0 | −14.6 | −54.5 |
| Frozen yogurt | Total volume | 0.0 | −4.9 | −22.2 |
| Retail | 0.0 | −3.0 | −14.3 | |
| Foodservice | 0.0 | −12.9 | −50.0 | |
|
Source: Euromonitor International, 2022 *CAGR: Compound annual growth rate |
||||
| Category | Data type | 2021 | 2022 | 2023 | 2024 | 2025 | 2026 |
|---|---|---|---|---|---|---|---|
| Ice cream | Total volume | 92.0 | 92.8 | 95.9 | 100.1 | 104.9 | 110.1 |
| Retail | 89.5 | 90.0 | 92.7 | 96.5 | 101.0 | 105.8 | |
| Foodservice | 2.5 | 2.8 | 3.2 | 3.6 | 3.9 | 4.3 | |
| Take-home ice cream | Total volume | 66.1 | 66.7 | 68.8 | 71.6 | 74.7 | 78.0 |
| Retail | 64.2 | 64.6 | 66.3 | 68.7 | 71.6 | 74.6 | |
| Foodservice | 1.9 | 2.2 | 2.5 | 2.8 | 3.1 | 3.4 | |
| Bulk take-home dairy ice cream | Total volume | 65.5 | 66.1 | 68.1 | 70.9 | 74.0 | 77.3 |
| Retail | 63.7 | 64.0 | 65.7 | 68.2 | 71.0 | 74.0 | |
| Foodservice | 1.8 | 2.1 | 2.4 | 2.7 | 3.0 | 3.3 | |
| Bulk take-home water ice cream | Total volume | 0.6 | 0.6 | 0.7 | 0.7 | 0.7 | 0.7 |
| Retail | 0.5 | 0.5 | 0.6 | 0.6 | 0.6 | 0.6 | |
| Foodservice | 0.1 | 0.1 | 0.1 | 0.1 | 0.1 | 0.1 | |
| Impulse ice cream | Total volume | 24.7 | 24.8 | 25.7 | 27.1 | 28.7 | 30.6 |
| - Dairy ice cream | Retail | 22.1 | 22.2 | 23.1 | 24.3 | 25.8 | 27.4 |
| - Water ice cream | Retail | 2.6 | 2.6 | 2.7 | 2.8 | 3.0 | 3.1 |
| Unpackaged ice cream | Total foodservice | 0.5 | 0.5 | 0.6 | 0.6 | 0.6 | 0.7 |
| Frozen yogurt | Total volume | 0.7 | 0.8 | 0.8 | 0.8 | 0.8 | 0.8 |
| Retail | 0.6 | 0.6 | 0.6 | 0.6 | 0.7 | 0.7 | |
| Foodservice | 0.1 | 0.1 | 0.1 | 0.1 | 0.2 | 0.2 | |
|
Source: Euromonitor International, 2022 Note: Base year for growth rate is 2021, which is actual retail value sales. Data for 2022 to 2026 is forecast by Euromonitor International. |
|||||||
| Category | Data type | Annual growth (%) 2021-2022 | CAGR* (%) 2016-2021 | Total growth (%) 2021-2026 |
|---|---|---|---|---|
| Ice cream | Total volume | 0.9 | 3.7 | 19.7 |
| Retail | 0.6 | 3.4 | 18.2 | |
| Foodservice | 12.0 | 11.5 | 72.0 | |
| Take-home ice cream | Total volume | 0.9 | 3.4 | 18.0 |
| Retail | 0.6 | 3.0 | 16.2 | |
| Foodservice | 15.8 | 12.3 | 78.9 | |
| Bulk take-home dairy ice cream | Total volume | 0.9 | 3.4 | 18.0 |
| Retail | 0.5 | 3.0 | 16.2 | |
| Foodservice | 16.7 | 12.9 | 83.3 | |
| Bulk take-home water ice cream | Total volume | 0.0 | 3.1 | 16.7 |
| Retail | 0.0 | 3.7 | 20.0 | |
| Foodservice | 0.0 | 0.0 | 0.0 | |
| Impulse ice cream | Total volume | 0.4 | 4.4 | 23.9 |
| - Dairy ice cream | Retail | 0.5 | 4.4 | 24.0 |
| - Water ice cream | Retail | 0.0 | 3.6 | 19.2 |
| Unpackaged ice cream | Total foodservice | 0.0 | 7.0 | 40.0 |
| Frozen yogurt | Total volume | 14.3 | 2.7 | 14.3 |
| Retail | 0.0 | 3.1 | 16.7 | |
| Foodservice | 0.0 | 14.9 | 100.0 | |
|
Source: Euromonitor International, 2022 *CAGR: Compound annual growth rate |
||||
Competitive landscape of ice cream and frozen yogurt products
A few select ice cream and frozen yogurt companies report sales within retailer outlets in the Philippines. In 2021, top ice cream companies (and brands) found in the Philippines were The Unilever Group (Selecta, Cornetto, Magnum) at a 69.5% market share sales value, Nestlé S.A. (Nestlé, Drumstick, Lait, Pinipig) at 17.5%, and San Miguel Corporation (Magnolia - Popsies) at 6.9%. The BTIC Incorporation supplied 96.8% of the frozen yogurt products throughout the Philippines in 2021.
| Company | Brand(s) | Retail sales (US$ millions) | Market share (%) |
|---|---|---|---|
| Total - ice cream companies | 367.2 | 100.0 | |
| Unilever Group | Selecta, Cornetto, Magnum | 255.4 | 69.5 |
| Nestlé SA | Nestlé, Drumstick, Lait, Pinipig | 64.2 | 17.5 |
| San Miguel Corporation | Magnolia (Popsies) | 25.4 | 6.9 |
| Arcefoods Corporation | Arce | 7.1 | 1.9 |
| The Food People Incorporation | Fruits in Ice Cream | 4.8 | 1.3 |
| BTIC Incorporation | BTIC | 4.6 | 1.3 |
| Others | Others | 5.8 | 1.6 |
| Total - frozen yogurt companies | 4.8 | 100.0 | |
| BTIC Incorporation | BTIC | 4.6 | 96.8 |
| Others | Others | 0.2 | 3.2 |
| Source: Euromonitor International, 2022 | |||
In 2021, top foodservice ice cream companies and brands served by Limited-Service Restaurants (LSRs) found in the Philippines registering a total value of US$16.0 million in sales were the International Dairy Queen Incorporation (Dairy Queen) at a 23.4% market share value, the Kahala Corporation (Cold Stone Creamery) at 7.2%, and Inspire Brands Incorporation (previously Dunkin' Brands Group Inc.) by Baskin-Robbins at 5.8%.
| Company | Brand | Retail sales (US$ millions) | Market share (%) |
|---|---|---|---|
| Total - foodservice ice cream limited-service restaurants | 16.0 | 100.0 | |
| International Dairy Queen Incorporation | Dairy Queen | 3.7 | 23.4 |
| Kahala Corporation | Cold Stone Creamery | 1.1 | 7.2 |
| Inspire Brands Incorporation (previously Dunkin' Brands Group Inc.) | Baskin-Robbins | 0.9 | 5.8 |
| Subtotal - other (chained, independent) limited-service restaurants | 10.2 | 63.6 | |
| Other - chained limited-service restaurants | Other - chained limited-service restaurants | 2.7 | 16.9 |
| Other - independent limited-service restaurants | Other - independent limited-service restaurants | 7.5 | 46.9 |
| Source: Euromonitor International, 2022 | |||
Distribution of ice cream and frozen yogurt (on-trade/off-trade)
In 2021, a retail sales total of US$366.4 million (99.8%) of ice cream and frozen yogurt products were distributed through in-store grocery retailers, while US$0.8 million (0.2%) in sales were ordered through online e-commerce services. Leading distributors were from modern supermarkets (59.6%), followed by traditional small local grocers (23.0%), and modern hypermarkets (12.6%) over the last year.
| Outlet Type | 2016 | 2021 | ||
|---|---|---|---|---|
| Actual | Share (%) | Actual | Share (%) | |
| Total - store-based grocery retailing: | 328.5 | 100.0 | 366.4 | 99.8 |
| Modern supermarkets | 197.2 | 60.0 | 218.9 | 59.6 |
| Traditional small local grocers | 77.7 | 23.7 | 84.3 | 23.0 |
| Modern hypermarkets | 38.1 | 11.6 | 46.2 | 12.6 |
| Modern convenience stores | 12.6 | 3.8 | 14.1 | 3.8 |
| Modern forecourt retailers | 2.2 | 0.7 | 2.3 | 0.6 |
| Traditional food/drink/tobacco specialists | 0.6 | 0.2 | 0.7 | 0.2 |
| Total - non-store retailing (e-commerce): | n/c | n/c | 0.8 | 0.2 |
| Retail distribution channels - grand total | 328.5 | 100.0 | 367.2 | 100.0 |
|
Source: Euromonitor International, 2022 n/c: not calculated |
||||
Based on retailer selling prices, chocolate, strawberry, mango, chocolate chip and vanilla ice cream types were the top five flavors sold in the Philippines in 2021. Amongst the impulse ice cream category, these same statistics indicated that 66.9% were served in cone format, followed by ice cream sticks at 21.6%, and 11.5% were served in another format.
| Flavour type | Unit | 2016 | 2017 | 2018 | 2019 | 2020 | 2021 |
|---|---|---|---|---|---|---|---|
| Chocolate | Ranking | 1.0 | 1.0 | 1.0 | 1.0 | 1.0 | 1.0 |
| Strawberry | Ranking | 5.0 | 5.0 | 3.0 | 3.0 | 2.0 | 2.0 |
| Mango | Ranking | 3.0 | 3.0 | 2.0 | 2.0 | 3.0 | 3.0 |
| Chocolate Chip | Ranking | 8.0 | 8.0 | 4.0 | 4.0 | 4.0 | 4.0 |
| Vanilla | Ranking | 2.0 | 2.0 | 7.0 | 7.0 | 5.0 | 5.0 |
| Coffee | Ranking | 7.0 | 7.0 | 8.0 | 8.0 | 6.0 | 6.0 |
| Halo Halo | Ranking | 6.0 | 6.0 | 5.0 | 5.0 | 7.0 | 7.0 |
| Double Dutch | Ranking | 4.0 | 4.0 | 6.0 | 6.0 | 8.0 | 8.0 |
| Source: Euromonitor International, 2022 | |||||||
| Category | Format type | 2016 | 2017 | 2018 | 2019 | 2020 | 2021 |
|---|---|---|---|---|---|---|---|
| Impulse ice cream | Cones | 61.9 | 62.7 | 64.6 | 66.1 | 66.4 | 66.9 |
| Impulse ice cream | Sticks | 26.5 | 25.3 | 23.7 | 22.4 | 22.1 | 21.6 |
| Impulse ice cream | Others | 11.6 | 12.0 | 11.7 | 11.5 | 11.4 | 11.5 |
| Impulse ice cream | Total | 100.0 | 100.0 | 100.0 | 100.0 | 100.0 | 100.0 |
| Source: Euromonitor International, 2022 | |||||||
In the Philippine foodservice industry, chained ice cream LSRs distributed total sales of $8.5 million (127 outlets), while sales of independent LSRs totalled US$7.5 million (166 outlets) in 2021. Notably, the number of chained LSRs increased by 3 outlets (2016-2021), however, the number of independent Philippine ice cream LSRs decreased from 198 to 166 (closure of 32 outlets) during this period.
| Outlet Type | 2016 | 2021 | ||
|---|---|---|---|---|
| On-trade sales | Number of outlets | On-trade sales | Number of outlets | |
| Total - ice cream limited-service restaurants | 33.3 | 321 | 16.0 | 293 |
| Chained ice cream limited-service restaurants | 16.3 | 123 | 8.5 | 127 |
| Independent ice cream limited-service restaurants | 17.0 | 198 | 7.5 | 166 |
| Source: Euromonitor International, 2022 | ||||
New product launch and trend analysis of frozen desserts
Mintel indicates that there were 221 new frozen dessert products (including new variety/range extension, packaging, formulation or relaunched) launched into Philippine retail stores over the last 5.6 years (January 2017 - June 22, 2022). As reported, the Philippines domestically manufactured 5 of these frozen desserts, while the top three other manufacturers were South Korea (8), Australia (4), Italy (4), Malaysia (4), and Sweden (3). Canada did not manufacture any of these products.
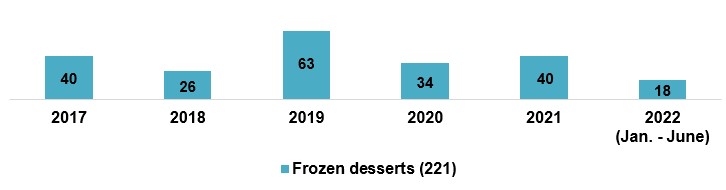
Description of above image
| 2017 | 2018 | 2019 | 2020 | 2021 | 2022 (January to June) | |
|---|---|---|---|---|---|---|
| Products launched | 40 | 26 | 63 | 34 | 40 | 18 |
Source: Mintel, 2022
Top parent companies to launch new products in the Philippines over the last 5.6 years were Unilever - RFM Ice Cream (145), Magnolia (33), San Miguel Corporation (33), Nestlé (28), and Froneri (10). Out of 49 new products launched [Q2-2021/2022], leading companies included Unilever (25), San Miguel Corporation (8), Pan de Manila (4), Nestlé (2), BTIC Corporation (2), and Laurel's Bakehouse (2). Recent new brands launched in the market included Kitchen City (frozen Leche Flan) and Selecta Cornetto Love Rose (Valentine's Day - strawberry cheesecake ice cream cone).
Most frozen ice cream, frozen yogurt or frozen desserts were distributed within supermarkets by 56.1%, mass merchandise/hypermarkets (13.1%), convenience stores (10.0%), club stores (6.3%), and traditional retail outlets (5.0%). The largest sub-category was dairy-based ice cream and frozen yogurt products (mostly ice cream based) by 85.5%, followed by frozen desserts at 10%, water-based ice lollies, pops and sorbets (2.3%), and one fruit, along with one plant-based ice cream and frozen yogurt product - dairy alternatives (0.5% each).
Among these 221 frozen dessert products within the Philippines market, ingredient-related claims were artificial (141), natural (53), fat free (32), plant based (9), fat reduced (5), and non-dairy (3). Top frozen dessert flavour or blends were chocolate, cookies and cream, mix of chocolate with vanilla/cookie/mango/ hazelnut, mango, vanilla (bourbon/Madagascar), and coffee. Other popular added flavour components consisted of salted caramel/caramelised flavouring, strawberry, purple yam, fudge, almond, cheesecake, avocado, brownie, hazelnut, coconut, and peanut butter.
These Philippine ice cream and frozen dessert products most often came in a cup/tub format type (60.2%), followed by stick format (14.5%), cone (8.1%), sandwich (3.2%), and bar format (2.3%). Top package types consisted of tub, flexible, carton, rigid box, and tray packaging standards.
| Attribute type | Top 10 attribute claims (product item count) |
|---|---|
| Launch Type | New variety/range extension (142), new product (44), new packaging (22), relaunch (10), new formulation (3) |
| Top parent companies | Unilever (77) / RFM Ice Cream (68), Magnolia (33), San Miguel Corporation (33), Nestlé (28), Froneri (10), Binggrae (8), Myimport (7), Mars (5), Pan de Manila (4), The Blissful Story Creamery (4) |
| Top brands launched | Selecta- Cornetto Disc (Bestsellers, Christmas, Summer Collection, Boom Boom!) (49), Magnolia (Gold Label, Best of the Philippines Collection) (24), Nestlé Temptations (16), Magnum (6), BTIC Better Than Ice Cream (4), Adriano Food (4), The Blissful Story (4), Pan de Manila (4), Bulla (4), Almondy (3), Ben & Jerry's (3) |
| Store launch type | Supermarket (124), mass merchandise/hypermarket (29), convenience store (22), club store (14), traditional retail outlet (11), department store (9), drug store/pharmacy (8), specialist retailer (4) |
| Sub-category | Dairy-based ice cream (181) and frozen yogurt, custard or ice cream (8), frozen desserts (22), water-based ice lollies, pops and sorbets (5), fruit (1), plant-based ice cream & frozen yogurt - dairy alternatives (1) |
| Ingredient claim | Artificial (141), palm oil derived (102), coconut oil derived (87), natural (53), fatty (44), fat free (32), vegetable based (31), coconut derived (25), for baking (12), plant based (9), fat reduced (5), non-dairy (3), no animal source (3), active (3) |
| Flavours (incl. blends) | Chocolate (57), cookies and cream (15), mix of chocolate with vanilla, cookie, mango, hazelnut (9), mango (8), vanilla/vanilla bourbon/vanilla Madagascar (8), coffee (5), avocado (4), rocky road (4), unflavored/plain (4), black forest (3), red velvet (3), orange/sweet (3), strawberry (3), peanut butter (2), hazelnut (2) |
| Flavour as a component | Chocolate (828), vanilla/vanilla bourbon/vanilla Madagascar (25), cookies and cream (19), mango (16), caramel/caramelized (14), strawberry (12), purple yam (11), biscuit/cookie (10), fudge (9), almond (8), cheesecake (7), avocado (6), coffee (6), brownie (6), hazelnut (6), coconut (5), peanut butter (5) |
| Format type | Cup/tub (133), stick (32), cone (18), sandwich (7), bar (5) |
| Package type | Tub (137), flexible (69), carton (8), rigid box (4), tray (1), clam pack (1) |
| Total sample size | 221 |
| Source: Mintel, 2022 | |
Product examples - Philippines
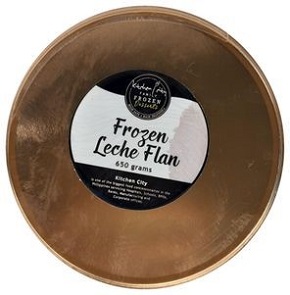
Frozen Leche Flan
Source: Mintel, 2022
| Company | Kitchen City, Philippines |
|---|---|
| Brand | Kitchen City |
| Sub-category | Desserts and ice cream, frozen desserts |
| Market | Philippines |
| Store name / type | Landmark Metro, department store |
| Launch type | New product |
| Date published | February 2022 |
| Price in US dollars | 6.83 |
This product is said to be safe and delicious and retails in a 650 gram pack.
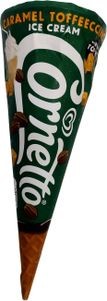
Caramel Toffeeccino Ice Cream
Source: Mintel, 2022
| Company | Unilever RFM Ice Cream |
|---|---|
| Brand | Selecto Cornetto |
| Sub-category | Desserts, dairy based ice cream and frozen yogurt, cone |
| Market | Philippines |
| Store name / type | Robinsons supermarket |
| Launch type | New variety / range extension |
| Date published | June 2022 |
| Price in US dollars | 0.47 |
The product comprises coffee ice cream topped with coffee sauce and toffee crunch pieces. It is made with real toffees, is said to be creamy and crunchy, and retails in a 110 millilire pack.
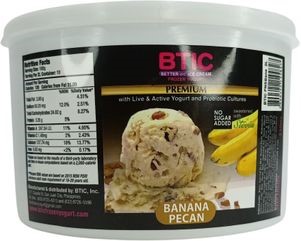
Premium Banana Pecan Frozen Yogurt
Source: Mintel, 2022
| Company | BTIC Incorporated |
|---|---|
| Brand | BTIC – Better Than Ice Cream |
| Sub-category | Desserts, dairy based ice frozen yogurt, cub/tub |
| Market | Philippines |
| Store name / type | Landmark Metro, department store |
| Launch type | New variety / range extension |
| Date published | June 2022 |
| Price in US dollars | 12.23 |
The product is sweetened with stevia, contains live and active yogurt and probiotic cultures, and is free from added sugar. It retails in a 2 litre pack.
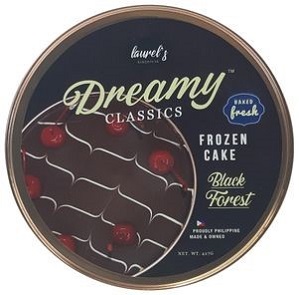
Black Forest Frozen Cake
Source: Mintel, 2022
| Company | Laurel's Bakehouse Dreamy |
|---|---|
| Brand | Laurel's Bakehouse Dreamy Classics |
| Sub-category | Desserts and ice cream, frozen desserts |
| Market | Manufactured in Philippines, not imported |
| Store name / type | Marketplace by Rustan's, supermarket |
| Launch type | New variety / range extension |
| Date published | August 2021 |
| Price in US dollars | 9.91 |
The product is said to be freshly baked, and retails in a 427 gram pack. Also, available includes Mascarpone Tiramisu frozen cake.
For more information
The Canadian Trade Commissioner Service:
International Trade Commissioners can provide Canadian industry with on-the-ground expertise regarding market potential, current conditions and local business contacts, and are an excellent point of contact for export advice.
More agri-food market intelligence:
International agri-food market intelligence
Discover global agriculture and food opportunities, the complete library of Global Analysis reports, market trends and forecasts, and information on Canada's free trade agreements.
Agri-food market intelligence service
Canadian agri-food and seafood businesses can take advantage of a customized service of reports and analysis, and join our email subscription service to have the latest reports delivered directly to their inbox.
More on Canada's agriculture and agri-food sectors:
Canada's agriculture sectors
Information on the agriculture industry by sector. Data on international markets. Initiatives to support awareness of the industry in Canada. How the department engages with the industry.
For additional information on upcoming trade shows, please contact:
Ben Berry, Deputy Director
Trade Show Strategy and Delivery
Agriculture and agri-food Canada
ben.berry@agr.gc.ca
Resources
- Euromonitor International, 2022
- Global Trade Tracker, 2022
- Mintel Global New Products Database, 2022
Sector Trend Analysis – Frozen dessert trends in the Philippines
Global Analysis Report
Prepared by: Erin-Ann Chauvin, Senior Market Analyst
© Her Majesty the Queen in Right of Canada, represented by the Minister of Agriculture and Agri-Food (2022).
Photo credits
All photographs reproduced in this publication are used by permission of the rights holders.
All images, unless otherwise noted, are copyright Her Majesty the Queen in Right of Canada.
To join our distribution list or to suggest additional report topics or markets, please contact:
Agriculture and Agri-Food Canada, Global Analysis1341 Baseline Rd, Tower 5, 3rd floor
Ottawa ON K1A 0C5
Canada
Email: aafc.mas-sam.aac@agr.gc.ca
The Government of Canada has prepared this report based on primary and secondary sources of information. Although every effort has been made to ensure that the information is accurate, Agriculture and Agri-Food Canada (AAFC) assumes no liability for any actions taken based on the information contained herein.
Reproduction or redistribution of this document, in whole or in part, must include acknowledgement of agriculture and agri-food Canada as the owner of the copyright in the document, through a reference citing AAFC, the title of the document and the year. Where the reproduction or redistribution includes data from this document, it must also include an acknowledgement of the specific data source(s), as noted in this document.
Agriculture and Agri-Food Canada provides this document and other report services to agriculture and food industry clients free of charge.