Set up an interview
Media Relations
Agriculture and Agri-Food Canada
1-866-345-7972
aafc.mediarelations-relationsmedias.aac@agr.gc.ca
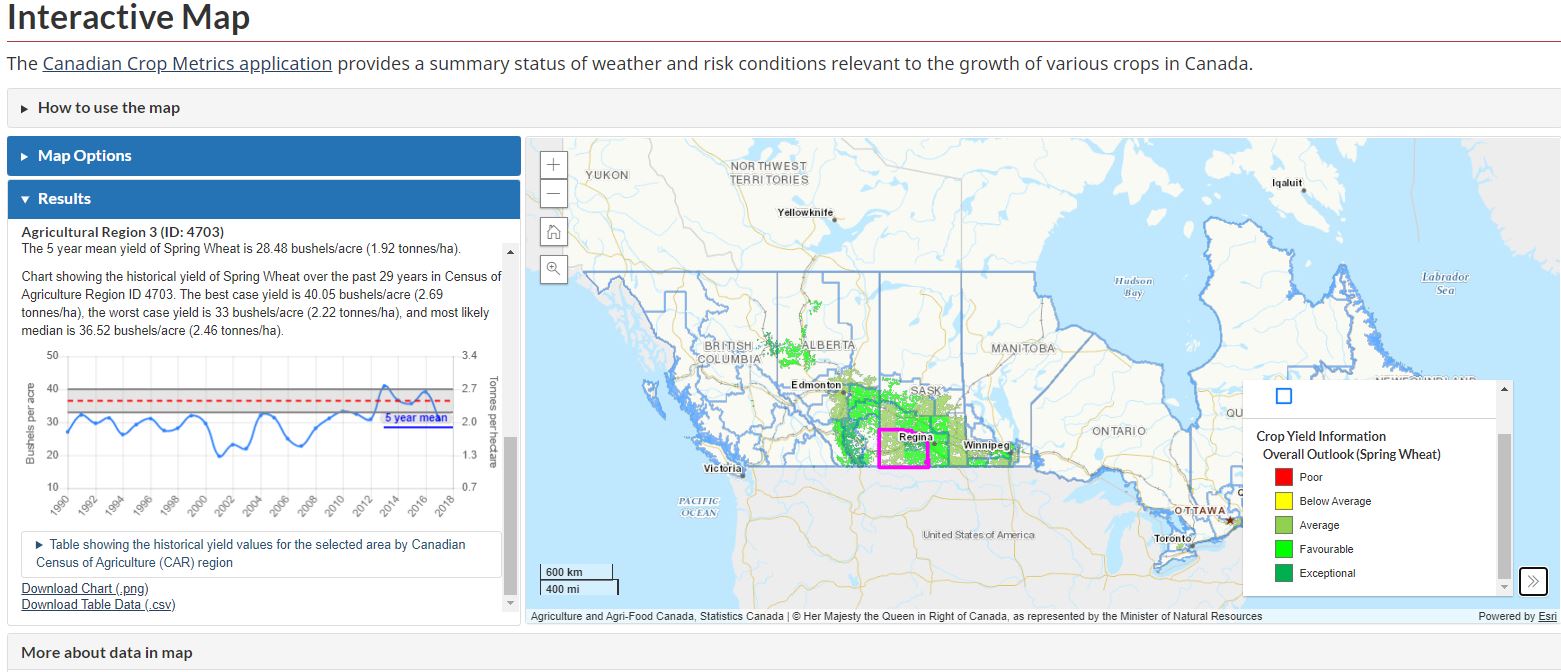
Agriculture and Agri-Food Canada recently launched a new web application that allows people to get accurate yield forecasts in one place for in-season crops based on the most recent statistics.
This user-friendly tool brings together key data on interactive maps in an easy to understand way. Information on weather, pests and risk conditions (drought, diseases and other factors), from reliable sources show how these conditions affect crop growth. The application features crop yield estimates for barley, canola, corn, durum wheat, flaxseed, lentil, oat, pea, soybean, spring wheat and winter wheat.
“Producers can look at production trends for the previous years to evaluate where their operation stands. If they are not meeting local production averages, it could provide impetus to evaluate their practices. Researchers, policy makers and others in the ag industry can also take this data and use it to make more accurate decisions, such as in the creation of a new environmental policy or purchasing decisions based on where bumper crops are located.”
- Dr. Catherine Champagne, Lead, Agroclimate Applications of Earth Observation
This tool compares production to previous years and local production averages but does not contain farm specific information.
Yield forecasts are adjusted throughout the growing season, taking into account changing environmental conditions. It is a great tool for farmers, agronomists and economists wanting to know:
- current harvest yield forecasts, including local production averages;
- historical yields; and
- production trends from previous years.
Armed with this knowledge, users will have the power to determine if they need to tweak their practices or shift resources to reduce inefficiencies and minimize losses. It is also a great planning tool for those involved in transportation or brokering commodities.
The data is compiled from Agriculture and Agri-Food Canada (including the Prairie Pest Monitoring Network), Environment and Climate Change Canada, Statistics Canada and provincial governments.
Dr. Champagne notes that the creation of this tool was very much an interdisciplinary team effort - it brought together experts in climate, yield forecasting, pest modelling and online mapping applications.
Key Discoveries/Benefits
- The new crop metrics tool brings together information on weather, pests and risk conditions such as drought or disease to show how these conditions affect crop growth.
- Users of this tool include everyone from farmers to agrologists to policy makers to researchers, who are provided with near time information and data to answer emerging questions.
- Yield forecasts are adjusted throughout the growing season, taking into account changing environmental conditions.
Photo gallery


