
Description de l'image ci-dessus (1 de 2)
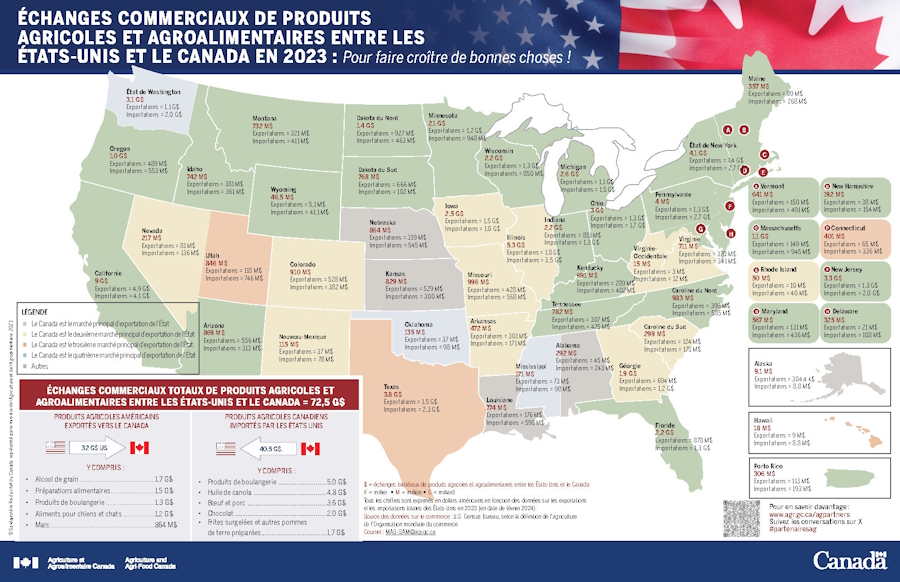
Échanges commerciaux totaux de produits agricoles et agroalimentaires entre les États‑Unis et le Canada = 72.5 G$
Produits agricoles américains exportés vers le Canada = 32 G$ US, y compris :
- Alcool de grain : 1,7 G$
- Préparations alimentaires : 1,5 G$
- Produits de boulangerie : 1,3 G$
- Aliments pour chiens et chat> : 1,2 G$
- Maïs : 864 M$
Produits agricoles canadiens importés par les États-Unis – 40,5 G$ US y compris :
- Produits de boulangeri> : 5,0 G$
- Huile de canola : 4,8 G$
- Bœuf et porc : 3,6 G$
- Chocolat : 2,0 G$
- Frites surgelées et autres pommes de terre préparées : 1,7 G$
| État | Exportations | Importations | Total |
|---|---|---|---|
| Alabama | 45 m$ | 243 m$ | 292 m$ |
| Alaska | 304,4 k$ | 8,8 m$ | 9,1 m$ |
| Arizona | 556 m$ | 313 m$ | 869 m$ |
| Arkansas | 301 m$ | 171 m$ | 472 m$ |
| Californie | 4,9 g$ | 4,1 g$ | 9 g$ |
| Colorado | 528 m$ | 382 m$ | 910 m$ |
| Connecticut | 65 m$ | 336 m$ | 401 m$ |
| Delaware | 217 m$ | 108 m$ | 325 m$ |
| Floride | 878 m$ | 1,3 g$ | 2,2 g$ |
| Géorgie | 694 m$ | 1,2 g$ | 1,9 g$ |
| Hawaï | 9 m$ | 8,8 m$ | 18 m$ |
| Idaho | 381 m$ | 361 m$ | 742 m$ |
| Illinois | 1,8 g$ | 3,5 g$ | 5,3 g$ |
| Indiana | 851 m$ | 1,3 g$ | 2,2 g$ |
| Iowa | 1,5 g$ | 1,0 g$ | 2,5 g$ |
| Kansas | 529 m$ | 300 m$ | 829 m$ |
| Kentucky | 289 m$ | 402 m$ | 691 m$ |
| Louisiane | 176 m$ | 598 m$ | 774 m$ |
| Maine | 89 m$ | 268 m$ | 357 m$ |
| Maryland | 131 m$ | 436 m$ | 567 m$ |
| Massachusetts | 149 m$ | 945 m$ | 1,1 g$ |
| Michigan | 1,1 g$ | 1,5 g$ | 2,6 g$ |
| Minnesota | 1,2 g$ | 948 m$ | 2,1 g$ |
| Mississippi | 73 m$ | 98 m$ | 171 m$ |
| Missouri | 428 m$ | 568 m$ | 996 m$ |
| Montana | 321 m$ | 411 m$ | 732 m$ |
| Nebraska | 319 m$ | 545 m$ | 864 m$ |
| Nevada | 81 m$ | 136 m$ | 217 m$ |
| New Hampshire | 38 m$ | 154 m$ | 192 m$ |
| New Jersey | 1,3 g$ | 2,0 g$ | 3,3 g$ |
| Nouveau Mexique | 37 m$ | 78 m$ | 115 m$ |
| État de New York | 1,4 g$ | 2,7 g$ | 4,1 g$ |
| Caroline du Nord | 398 m$ | 585 m$ | 983 m$ |
| Dakota du Nord | 927 m$ | 463 m$ | 1,4 g$ |
| Ohio | 1,3 g$ | 1,7 g$ | 3 g$ |
| Oklahoma | 37 m$ | 98 m$ | 135 m$ |
| Oregon | 489 m$ | 553 m$ | 1,0 g$ |
| Pennsylvanie | 1,3 g$ | 2,7 g$ | 4 g$ |
| Porto rico | 113 m$ | 193 m$ | 306 m$ |
| Rhode Island | 10 m$ | 40 m$ | 50 m$ |
| Caroline du Sud | 124 m$ | 175 m$ | 299 m$ |
| Dakota du Sud | 666 m$ | 102 m$ | 768 m$ |
| Tennessee | 307 m$ | 475 m$ | 782 m$ |
| Texas | 1,5 g$ | 2,3 g$ | 3,8 g$ |
| Utah | 118 m$ | 746 m$ | 864 m$ |
| Vermont | 150 m$ | 491 m$ | 641 m$ |
| Virginie | 370 m$ | 341 m$ | 711 m$ |
| État de Washington | 1,1 g$ | 2,0 g$ | 3,1 g$ |
| Virginie Occidentale | 3 m$ | 12 m$ | 15 m$ |
| Wisconsin | 1,3 g$ | 850 m$ | 2,2 g$ |
| Wyoming | 5,1 m$ | 41,1 m$ | 46,5 m$ |
k = Milliers
m = Millions
g = Milliards
Tous les montants sont indiqués en dollars américains et basés sur les données de 2023 (en date de février 2024) pour les exportations et les importations des États‑Unis et du Canada.
Source des données sur le commerce : Bureau du recensement des États‑Unis et Statistique Canada, selon la définition de l'agriculture par l'Organisation mondiale du commerce.
Courriel : aafc.mas‑sam.aac@agr.gc.ca
Pour en savoir davantage : www.agr.gc.ca/partenairesag
Suivez le fil de la conversation sur X : #partenairesag
Description de l'image ci-dessus (2 de 2)
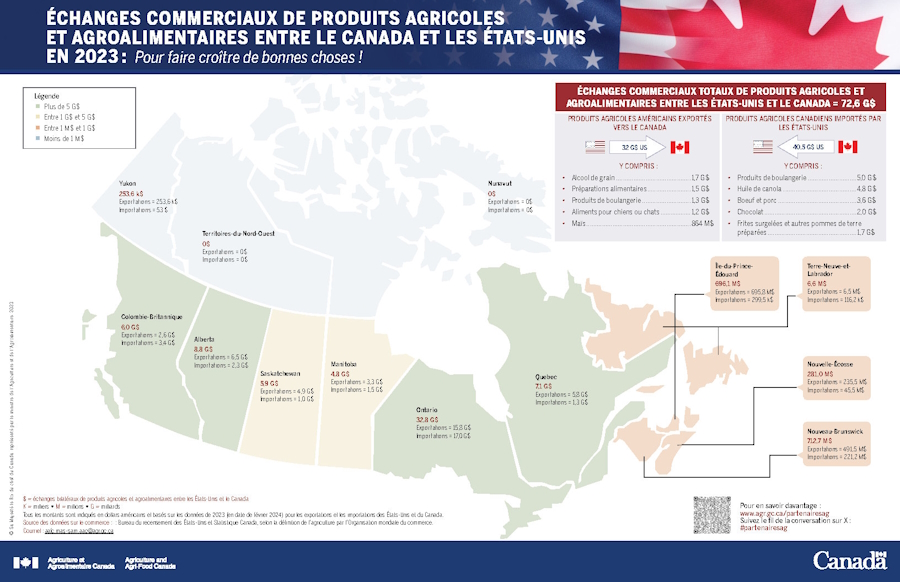
Échanges commerciaux totaux de produits agricoles et agroalimentaires entre le Canada et les États-Unis = 72.5 G$
Produits agricoles américains exportés vers le Canada = 32 G$ US, y compris :
- Alcool de grain : 1,7 G$
- Préparations alimentaires : 1,5 G$
- Produits de boulangerie : 1,3 G$
- Aliments pour chiens et chats : 1,2 G$
- Maïs : 864 M$
Produits agricoles canadiens importés par les États-Unis – 40,5 G$ US y compris :
- Produits de boulangerie : 5,0 G$
- Huile de canola : 4,8 G$
- Bœuf et porc : 3,6 G$
- Chocolat : 2,0 G$
- Frites surgelées et autres pommes de terre préparées : 1,7 G$
| Province/territoire | Exportations | Importations | Total |
|---|---|---|---|
| Alberta | 6,5 g$ | 2,3 g$ | 8,8 g$ |
| Colombie‑Britannique | 2,6 g$ | 3,4 g$ | 6,0 g$ |
| Manitoba | 3,3 g$ | 1,5 g$ | 4,8 g$ |
| Nouveau-Brunswick | 491,5 m$ | 221,2 m$ | 712,7 m$ |
| Terre‑Neuve‑et‑Labrador | 6,5 m$ | 116,2 k$ | 6,6 m$ |
| Territoires du Nord‑Ouest | 0 $ | 0 $ | 0 $ |
| Nouvelle‑Écosse | 235,5 m$ | 45,5 m$ | 281,0 m$ |
| Nunavut | 0 $ | 0 $ | 0 $ |
| Ontario | 15,8 g$ | 17,0 g$ | 32,8 g$ |
| Île‑du‑Prince‑Édouard | 695,8 m$ | 299,5 k$ | 696,1 m$ |
| Québec | 5,8 g$ | 1,3 g$ | 7,1 g$ |
| Saskatchewan | 4,9 g$ | 1,0 g$ | 5,9 g$ |
| Yukon | 253,6 k$ | 53 $ | 253,6 k$ |
k = Milliers
m = Millions
g = Milliards
Tous les montants sont indiqués en dollars américains et basés sur les données de 2023 (en date de février 2024) pour les exportations et les importations des États‑Unis et du Canada.
Source des données sur le commerce : Bureau du recensement des États‑Unis et Statistique Canada, selon la définition de l'agriculture par l'Organisation mondiale du commerce.
Courriel : aafc.mas‑sam.aac@agr.gc.ca
Pour en savoir davantage : www.agr.gc.ca/partenairesag
Suivez le fil de la conversation sur X : #partenairesag