
What are we talking about?
Variable rate nutrient application (VRNA) means applying different rates of fertilizer or manure to different parts of a field growing the same crop, based on a pre-determined prescription. The rate can be controlled manually by the equipment operator or automatically by a computer in communication with a global positioning system (GPS). This page deals with computer / GPS controlled VRNA.
Summary
The information below is not intended to prescribe detailed recommendations on how to implement the practice. Rather it is meant to provide an outline of various approaches and methods, and an awareness of the resources required to properly implement VRNA and the potential risks associated with not realizing an economic benefit from the efforts and investments. The objective is to help producers make an informed decision on whether to invest in VRNA on their farm.
What is the key issue impacting the success of variable rate nutrient application?
Many fields may have potential to benefit from VRNA. This is because soils and landscapes vary spatially within a field. Therefore, different parts of a field have varying requirements for nutrients to achieve optimum crop growth and yield. However, the ability to properly determine how nutrients should be managed in different parts of the field is often very challenging. While GPS technology is an important requirement for VRNA, attaining geographic accuracy and control is not the most difficult issue to resolve. This publication does not focus on GPS technology, but rather the more complex key issue of properly determining nutrient requirements in different parts of the field.
Are certain types of landscapes and soils more suited to variable rate nutrient application?
It is reasonable to assume that fields with visibly more variability in key site characteristics such as slope, soil texture, drainage, salinity, stoniness, and soil organic matter also have greater potential to benefit from VRNA. However, it has been shown that seemingly uniform flat fields may also have considerable variability. Available technology is able to identify and quantify this variability even if it is not visible.
What is the primary risk associated with variable rate nutrient application?
Determining nutrient requirement is challenging due to the interactive effects of environmental and growing conditions, such as rainfall, temperature, and pests, with the soil. A nutrient recommendation is always based on an assumed set of conditions, but often the conditions that actually occur are different. This may result in crop responses to nutrient additions being different than what was intended. This can impact the success of nutrient application, regardless if it is applied at a uniform rate or as a variable rate.
For example, some regions may experience more extreme environmental conditions than others, such as increased risk of drought or excess moisture. Under adverse environmental conditions producers often look for ways to reduce risk. VRNA may be more risky because it typically involves extra costs related to more complex application equipment and higher data collection and analysis requirements. On the other hand, VRNA may help if it involves reducing the overall amount of nutrient inputs.
What methods are used to determine nutrient requirement across a field?
While there are many different methods used to predict variable rate nutrient requirement, most fall within one of two groups. The first involves creating a nutrient prescription map based on relatively large soil management zones within a field. The second determines site specific nutrient requirement based on real time assessment of early season plant growth using optical sensing of the crop canopy.
Can I create variable rate nutrient application recommendations on my own or do I need to rely on a technical specialist?
While it may be possible for farmers to do this on their own, most rely on a consultant. Creating maps and developing recommendations requires skills with geographic information systems (GIS), access to various sources of data, and knowledge of soils and agronomy to make proper interpretations.
Option 1: How to determine nutrient requirement using soil management zones?
The simplest definition of soil management zones (SMZs) are different areas within a field that require different amounts of nutrient additions to achieve maximum economic yield. A key challenge is to delineate SMZs so that they are large enough to be effectively covered by farm scale equipment, and yet have a similar requirement for nutrients within a specific zone type. Sometimes SMZs can be easily identified based on highly visible characteristics such as slope position or major changes in soil texture. However, more often SMZs are not obvious, and must be based on additional sources of data. Multiple data sources are often required due to numerous soil and landscape factors influencing crop nutrient response and yield. Some common data sources used by consultants to help create SMZs are:
- Crop yield maps created from combine yield monitor data using GIS computer software
- Satellite images showing differences in above ground crop biomass based on indicators such as the normalized differential vegetative index (NDVI)
- Topographic surveys showing various slope positions and drainage patterns.
- Soil conductivity surveys (eg. Geonics EM38 or Veris Technologies) to identify changes in salinity, texture, and soil moisture across a field.
Once SMZs have been defined, the next step is to take representative soil samples for each of the similar and repeating SMZ types to determine current nutrient status. Finally, a recommendation for additional nutrients is developed for each SMZ based on a realistic target yield. While different consultants use different methods to determine nutrient requirement for specific zones, most rely on a number of these data sources.
Figure 1a: Near infrared satellite image
(Source: AAFC)
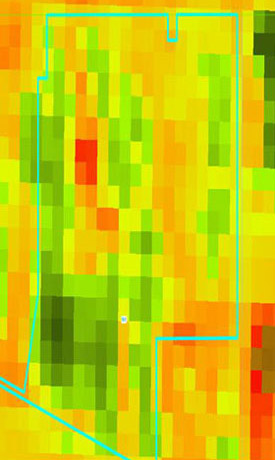
Figure 1b: Soil management zone map
(Source: AAFC)

Descriptions - Figures 1a & 1b
Figure 1a shows many small rectangular areas within an agricultural field having various shades of red, orange, yellow and green.
Figure 1b shows the same field, where larger SMZ areas have been identified based on similar colour shades from Figure 1a.
The near infrared satellite image shown in Figure 1a was taken when a crop was actively growing in a field. It was used to create the SMZ map shown in Figure 1b. Figure 1b illustrates two key features of SMZ maps. First, there are a limited number of SMZ types, in this example "4", as indicated by 4 different colors. This means there are potentially "4" different rates of nutrients being applied on this field. Second, each SMZ type occurs in a number of different areas or polygons within the field.
How reliable are soil management zones?
SMZs are more reliable or stable if they are based on consistent field patterns observed over a number of years. For example, a field that shows consistent patterns with yield maps or satellite images for a number of crop years, suggests more potential for VRNA. When these maps and images align well with other data such as topographic and conductivity surveys, this suggests that inherent soil and landscape features strongly influence crop and yield response in a consistent way. This also suggests potential for VRNA.
Inconsistent patterns between similar data sources over a number of crop years may suggest that environmental and growing conditions are variable. Interactions between soil / landscape features and variable growing conditions may result in different yield impacts in different years in the same part of the field. In this type of scenario it may be harder to identify SMZs that can be used for VRNA.
Ideally, initial implementation of the SMZ method first involves collection and interpretation of various sources of data for a number of years to identify consistent patterns. It is important to identify these patterns before deciding to implement the practice. This may involve significant costs before any economic benefits can be realized, particularly if the work is being done by a consultant. Another approach may be to use only 1 year of data from only 1 or 2 sources before implementing the practice. This may work if the farmer has a good historical knowledge of the field's crop growth and yield pattern, and that this pattern agrees closely with the data sources being collected and analyzed by the consultant.
Finally, it should be noted that even with consistent patterns and stable SMZs, success with VRNA is not guaranteed. For example, there may be other factors not related to nutrients that may be influencing these patterns.
Option 2: How to determine nutrient requirement from crop canopy optical sensors?
Crop canopy optical sensors (CCOS) aligned in front of liquid fertilizer applicators estimate above ground crop biomass early in the growing season and calculate an appropriate fertilizer application rate. This fertilizer rate is applied through the specified applicator running over the same path as the sensor. All of these processes occur during the same equipment pass over the field, meaning they happen almost instantaneously in real time. This technology is primarily used only for adding supplemental nitrogen (N).
CCOS actually measure light reflectance from various wavelengths such as near infrared and visible red. This information is used to first calculate an indicator of crop growth, such as NDVI. These indicators are then used by a formula or algorithm to calculate an optimal fertilizer rate. Algorithms have been developed through research trials for different crops in different regions. The farmer's equipment is programmed to use an algorithm matched to his/her crop and region. A non-limiting nitrogen rich strip placed in a representative part of the field at seeding time is also required as a reference.
Figure 2: Applying variable liquid fertilizer using a Greenseeker optical sensor
(Source: Indian Head Agriculture Research Foundation (IHARF))

Description - Figure 2
Photo of a moving sprayer boom on a field of growing cereal crop, with several mounted Greenseeker optical sensors capturing crop biomass data just prior to liquid fertilizer being applied through spray nozzles.
Figure 3: Typical relationship between nutrient recommendation and NDVI for spring wheat in the Canadian Prairie Region.
(Source: IHARF)

Description - Figure 3
| NDVI (x axis) | US gpa UAN* (y axis) |
|---|---|
| 0.025 | 0.00 |
| 0.050 | 0.00 |
| 0.075 | 0.00 |
| 0.100 | 0.00 |
| 0.125 | 0.00 |
| 0.150 | 0.00 |
| 0.175 | 0.00 |
| 0.200 | 0.00 |
| 0.225 | 0.00 |
| 0.250 | 0.00 |
| 0.275 | 0.00 |
| 0.300 | 0.00 |
| 0.325 | 4.82 |
| 0.350 | 5.06 |
| 0.375 | 5.30 |
| 0.400 | 5.56 |
| 0.425 | 5.83 |
| 0.450 | 6.11 |
| 0.475 | 6.41 |
| 0.500 | 6.72 |
| 0.525 | 7.05 |
| 0.550 | 7.39 |
| 0.575 | 7.75 |
| 0.600 | 8.12 |
| 0.625 | 8.52 |
| 0.650 | 8.93 |
| 0.675 | 9.37 |
| 0.700 | 8.05 |
| 0.725 | 5.95 |
| 0.750 | 3.75 |
| 0.775 | 0.00 |
| 0.800 | 0.00 |
| 0.825 | 0.00 |
| 0.850 | 0.00 |
| 0.875 | 0.00 |
| 0.900 | 0.00 |
| 0.925 | 0.00 |
| 0.950 | 0.00 |
| 0.975 | 0.00 |
| * United States (US) gallons per acre of urea ammonium nitrate | |
The above graph shows how a typical algorithm used with Greenseeker optical sensors calculates appropriate fertilizer rates based on NDVI values. In the centre part of the graph the recommended fertilizer rate increases as NDVI increases. This is based on the premise that crops with more biomass have increasing capacity to utilize additional nitrogen fertilizer. However, there are two threshold NDVI values, one at the bottom end and one at the top end of this trend. Any NDVI values below the bottom value (ie. about 0.30) receive no fertilizer based on the assumption that other factors such as drought, salinity, and flood damage are greatly restricting yield potential as evidenced by very low crop biomass. Any NDVI values above the top threshold also receive no fertilizer based on the assumption that there are already enough nutrients in the soil to achieve maximum economic yield. The non-limiting nitrogen rich strip is used to assess this top threshold.
It is important to note that algorithms will vary considerably between different crops and regions. For example, for corn in Ontario and Quebec, NDVI is more closely related to plant chlorophyll content, where lower values indicate a nitrogen deficiency and greater capacity to utilize additional nitrogen. This typically results in a declining rate of recommended nitrogen as NDVI increases, in the centre portion of the graph in Figure 3.
What are the pros and cons of using crop canopy optical sensors?
There are a number of advantages of using CCOS instead of SMZ's. First, there is a much lower requirement for data collection and analysis. Secondly, delaying part of the nitrogen application by up to one month after seeding allows one to take into account environmental conditions early in the growing season and thereby increases the ability to match fertilizer use with crop needs.
However, there are also a few disadvantages and other factors to consider. First, there is usually a very narrow window of opportunity for young plants to take up supplemental nitrogen, particularly in Canada where growing seasons are relatively short compared to many other cultivated areas of the world. If this technology is not used at the appropriate time, due to adverse weather or other factors, then potential benefits may not be realized. This window of opportunity varies for different crop types and different regions. Research has shown that this window can be expanded somewhat by applying a greater portion of the total nitrogen requirement at seeding time for cereals and canola in the Canadian prairies. However, this approach may not work for other crops and regions.
Secondly, while the algorithms used to calculate fertilizer rates are based on extensive research with various crop types in different regions, they may not account for all soil / landscape characteristics or environmental and growing conditions. Furthermore, environmental conditions that are different than normal may occur after this fertilizer application and thus impact intended results, just as with the SMZ method.
Thirdly, for algorithms based on detecting nitrogen deficiency related to plant chlorophyll content, CCOS may work most effectively where there are no other significant factors limiting plant growth. Other factors, such as topography or soil moisture, could potentially be accounted for in more complex algorithms, but this would involve additional data collection and interpretation costs, similar to the SMZ method.
Finally, there may be different equipment costs associated with implementing VRNA using CCOS versus SMZ's.
Is it possible to use both methods to apply variable rate fertilizer?
One could potentially use both methods. The SMZ method would be used to develop a variable rate prescription map for starter fertilizer, which would typically include nitrogen, phosphorus, and possibly other nutrients such as potassium and sulphur. The CCOS method would then be used later to apply supplemental nitrogen to take into account more of the actual growing season conditions.
Also, more complex algorithms could integrate previously collected data from SMZ's with real time data from CCOS to develop recommendations for applying supplemental in crop fertilizer, as noted in the previous section.
How can I know if variable rate nutrient application is economical?
The best way to determine if this technology is economical is to compare it with the traditional practice of uniform rate nutrient application. While one might be tempted to make comparisons with previous years, it is better to set up a uniform rate strip within the field that is being used for variable rate. That way one can make a proper comparison under the same environmental conditions.
The uniform rate strip should be placed so that it is representative of the entire field. For the SMZ method this means every SMZ type should be included in the strip. If one is using the CCOS method the uniform rate strip should contain a similar mix of optical sensor values as the rest of the field. A simple rule of thumb is to position the strip perpendicular to the contour of the land so that it occupies a variety of slope positions. A combine yield monitor together with yield mapping computer software are essential tools to compare yields in the uniform rate strip with other parts of the field. The strip should be wide enough for the monitor to properly assess yield in this area separately from the rest of the field. It may be necessary to overlay the SMZ's with the yield map, to make proper yield comparisons for specific SMZ types.
Other data requirements include the difference in fertilizer cost between variable rate and uniform rate, additional equipment costs involved in applying variable rate, and consultant fees for developing prescription maps. A partial budget economic analysis can then be used to compare the changes in costs and revenues between the variable rate and uniform rate.
Is it possible to apply variable rate manure?
While it is possible to apply variable rate manure, there are additional challenges to consider. First, the nutrient content of manure is not as consistent as commercial fertilizer. Secondly, typical farm equipment is less able to precisely apply variable rates of manure compared to commercial fertilizer. Therefore, it may not be as feasible to apply variable rate manure in a GPS controlled environment. Nevertheless, based on visually observable differences, many farmers have successfully applied manure to specific parts of a field that have large nutrient deficiencies. A typical example is eroded hilltops that are lacking soil organic matter.
If I decide to try variable rate nutrient application how should I proceed?
Due to considerable risk and uncertainty regarding nutrient responses and economic benefits, it may be advisable to start with one or two fields that have the most potential to benefit from this technology. This approach may work well if one is able access rental equipment or a custom operator to apply variable rate before making the commitment toward a large capital expenditure.
If using the services of a consultant make sure you understand the method(s) and options being presented to determine fertilizer requirement. Insist that the consultant assist you with establishing a uniform rate strip and conducting a partial budget economic analysis.
Based on the success of several years on these pilot fields, one can then make a decision on whether to expand the practice to the rest of the farm, including the purchase of equipment for VRNA.
How do I manage uniform rate strips in the long term?
Due to varying environmental conditions one cannot assume that economic benefits from one field will also occur on other fields. Similarly, one cannot expect that results achieved in one year will be the same in subsequent years. Therefore, it is recommended that a uniform rate strip be established in every field and be maintained every year. This is not a difficult, expensive, or time consuming task with a GPS in conjunction with a combine yield monitor and appropriate GIS software to analyze data. It is also preferable that the uniform rate strip remain in the same location year after year. This allows for a true comparison of variable rate with uniform rate over the long term.
How do I manage variable rate in the long term?
While SMZ's may not change significantly, specific fertilizer recommendations will vary from year to year. Factors that may impact fertilizer recommendation include crop type to be grown, previous crop type, previous environmental conditions, crop prices, and fertilizer cost. Also, one may expect fertilizer rates to change as a field moves from a history of uniform rate to variable rate. For example, if variable rate is successful, one may find fewer extremes involving large surpluses or deficiencies in soil nutrient status since nutrients are being utilized more efficiently. Finally, as knowledge increases on nutrient responses and yield patterns in different parts of a field, one may be better equipped to determine nutrient prescriptions designed to achieve realistic yield targets for different areas within a field.