
The following mink statistical briefer provides market information statistics including number of farms, mink production, farm cash receipts and average mink pelt price in Canada.
For your convenience, this report is available in the following format:
PDF (32 KB)
Number of mink farms
Number of mink farms
| NL | PE | NS | NB | QC | ON | MB | SK | AB | BC | Canada | |
|---|---|---|---|---|---|---|---|---|---|---|---|
| 2020* | 4 | 1 | 20 | 4 | 2 | 22 | 3 | 0 | 0 | 7 | 63 |
| 2019* | 5 | 1 | 25 | 4 | 2 | 26 | 4 | 0 | 0 | 7 | 74 |
| 2018 | 6 | 4 | 43 | 4 | 3 | 28 | 4 | 0 | 0 | 6 | 98 |
| 2017 | 13 | 5 | 79 | 6 | 3 | 40 | 6 | 0 | 0 | 13 | 165 |
| 2016 | 13 | 7 | 89 | 9 | 9 | 46 | 8 | 0 | 2 | 11 | 194 |
| 2015 | 13 | 9 | 105 | 9 | 9 | 46 | 7 | 0 | 1 | 14 | 213 |
| 2014 | 16 | 11 | 116 | 14 | 11 | 46 | 7 | 0 | 1 | 15 | 237 |
| 2013 | 15 | 12 | 115 | 14 | 11 | 45 | 7 | 0 | 1 | 16 | 236 |
| 2012 | 15 | 11 | 115 | 14 | 11 | 46 | 7 | 0 | 1 | 13 | 233 |
| 2011 | 16 | 12 | 118 | 13 | 12 | 50 | 8 | 0 | 1 | 12 | 242 |
| 2010 | 16 | 12 | 108 | 13 | 12 | 54 | 10 | 1 | 1 | 13 | 240 |
| 2009 | 16 | 11 | 98 | 11 | 12 | 59 | 10 | 0 | 1 | 12 | 230 |
| 2008 | 17 | 9 | 96 | 10 | 11 | 58 | 10 | 0 | 1 | 12 | 224 |
| 2007 | 17 | 7 | 95 | 9 | 11 | 58 | 11 | 0 | 1 | 13 | 222 |
| 2006 | 18 | 7 | 94 | 8 | 11 | 56 | 10 | 0 | 2 | 12 | 218 |
| 2005 | 18 | 9 | 98 | 6 | 12 | 56 | 11 | 0 | 2 | 11 | 223 |
| 2004 | 3 | 6 | 113 | 4 | 15 | 56 | 13 | 0 | 6 | 12 | 228 |
| 2003 | 4 | 5 | 113 | 4 | 17 | 57 | 12 | 0 | 6 | 12 | 230 |
| 2002 | 3 | 5 | 89 | 4 | 14 | 57 | 11 | 0 | 6 | 14 | 203 |
| Source: Statistics Canada (Cansim Table 003-0015) * Agriculture and agri-food Canada estimate Compiled by Agriculture and agri-food Canada, Animal industry division, Market information section - updated January 2022 |
|||||||||||
Mink production
Mink production
| NL | PE | NS | NB | QC | ON | MB | SK | AB | BC | Canada | |
|---|---|---|---|---|---|---|---|---|---|---|---|
| 2020 | 196,100 | x | 259,400 | 20,000 | x | 265,000 | 25,400 | 0 | 0 | 237,700 | 1,003,600 |
| 2019 | 168,000 | x | 342,600 | 19,000 | x | 329,900 | 39,800 | 0 | 0 | 252,400 | 1,151,700 |
| 2018 | 172,400 | 58,500 | 749,000 | 20,500 | 36,600 | 413,100 | 44,300 | 0 | 0 | 269,400 | 1,763,800 |
| 2017 | x | 105,500 | 1,068,500 | 31,500 | 29,300 | 386,600 | 53,800 | 0 | 0 | 313,700 | 2,216,200 |
| 2016 | x | 98,700 | 952,700 | 34,000 | 26,100 | 424,500 | x | 0 | 0 | 309,600 | 2,143,100 |
| 2015 | 250,550 | 148,300 | 1,995,000 | 73,200 | 48,300 | 452,500 | x | 0 | x | 297,900 | 3,317,150 |
| 2014 | 286,200 | 127,400 | 1,980,000 | 67,300 | 50,700 | 492,500 | x | 0 | x | 322,700 | 3,384,000 |
| 2013 | 283,000 | 133,100 | 1,399,300 | 61,700 | 49,200 | 439,800 | x | 0 | x | 353,000 | 2,771,500 |
| 2012 | 241,900 | 135,000 | 1,493,300 | 51,800 | 54,200 | 436,800 | x | 0 | x | 342,800 | 2,804,800 |
| 2011 | 221,400 | 134,300 | 1,451,200 | 53,400 | 56,700 | 411,300 | x | 0 | x | 337,700 | 2,714,400 |
| 2010 | 180,100 | 103,800 | 1,247,700 | 54,300 | 58,800 | 405,900 | x | x | x | 200,000 | 2,297,880 |
| 2009 | 175,000 | 56,700 | 1,378,110 | 45,000 | 60,700 | 378,000 | x | 0 | x | 141,500 | 2,291,090 |
| 2008 | 120,000 | 47,000 | 1,233,450 | 41,900 | 49,500 | 350,000 | x | 0 | x | 144,200 | 2,041,000 |
| 2007 | 134,800 | x | 1,197,970 | 36,700 | 51,500 | 326,900 | x | 0 | x | 210,700 | 2,055,070 |
| 2006 | 111,100 | 36,800 | 961,500 | 39,400 | 48,200 | 311,300 | x | 0 | x | 194,700 | 1,751,300 |
| 2005 | 49,600 | 26,700 | 762,100 | 19,400 | 43,900 | 264,500 | x | 0 | x | 173,000 | 1,417,000 |
| 2004 | x | 34,300 | 764,400 | 21,900 | 42,300 | 285,900 | 47,500 | 0 | x | 240,500 | 1,470,900 |
| 2003 | x | 32,800 | 722,600 | x | 61,200 | 288,600 | 41,900 | 0 | x | 257,200 | 1,461,600 |
| 2002 | x | 42,300 | 458,700 | x | 55,500 | 282,400 | 28,600 | 0 | x | 204,200 | 1,129,600 |
| x: Suppressed to meet the confidentiality requirements of the Statistics Act Source: Statistics Canada (Cansim Table 003-0015) Compiled by Agriculture and agri-food Canada, Animal industry division, Market information section - updated January 2022 |
|||||||||||
Farm cash receipts
Farm cash receipts
| NL | PE | NS | NB | QC | ON | MB | SK | AB | BC | Canada | |
|---|---|---|---|---|---|---|---|---|---|---|---|
| 2020 * | 4,368 | x | 8,908 | 494 | x | 8,577 | 1,035 | 0 | 0 | 6,562 | 29,944 |
| 2019 | 5,284 | 275 | 19,600 | 759 | 1,133 | 10,974 | 1,495 | 1 | 0 | 4,704 | 44,224 |
| 2018 | 7,430 | 3,287 | 48,725 | 2,232 | 1,247 | 19,466 | 2,314 | 10 | 0 | 12,823 | 97,533 |
| 2017 | x | x | 29,281 | 1,605 | 1,143 | 17,562 | x | 0 | 0 | x | 75,137 |
| 2016 | 7,117 | x | 54,471 | 2,524 | 1,706 | 16,561 | x | x | x | x | 98,450 |
| 2015 | 13,916 | x | 87,042 | 3,817 | 3,410 | 33,087 | x | x | x | x | 168,418 |
| 2014 | 12,291 | x | 54,043 | 3,466 | 2,732 | 24,814 | x | x | x | x | 119,783 |
| 2013 | 22,281 | x | 128,427 | 5,559 | 5,503 | 45,296 | 4,701 | x | x | x | 255,771 |
| 2012 | 16,557 | x | 116,763 | 4,943 | 5,453 | 37,747 | 4,170 | x | x | x | 223,988 |
| 2011 | 11,562 | 7,203 | 87,716 | 4,166 | 4,604 | 29,325 | 3,264 | x | x | 13,041 | 161,052 |
| 2010 | 11,046 | 3,583 | 89,745 | 3,091 | 4,217 | 24,177 | 3,517 | x | x | 8,466 | 147,962 |
| 2009 | 5,082 | 2,105 | 56,988 | 2,012 | 2,401 | 15,315 | 2,432 | x | x | 5,811 | 92,169 |
| 2008 | 7,597 | 2,545 | 80,779 | 2,528 | 3,452 | 19,805 | 3,372 | x | 33 | x | 132,713 |
| 2007 | 5,325 | 2,151 | 55,535 | 2,373 | 2,798 | 16,312 | 2,441 | x | 49 | x | 96,392 |
| 2006 | 3,527 | 1,927 | 54,280 | 1,429 | 3,121 | 16,797 | 2,694 | 18 | 2,646 | 10,161 | 96,601 |
| 2005 | x | 1,984 | 45,307 | x | 2,549 | 16,040 | 2,830 | 8 | x | x | 85,314 |
| 2004 | x | 1,779 | 38,842 | x | 3,426 | 14,843 | 2,117 | 17 | 1,880 | x | 77,512 |
| 2003 | x | 1,735 | 21,324 | x | 2,545 | 11,865 | 1,155 | 21 | 1,608 | x | 49,914 |
| 2002 | x | 1,067 | 21,218 | x | 2,267 | 11,400 | 1,636 | 11 | 1,552 | x | 49,971 |
| x: Suppressed to meet the confidentiality requirements of the Statistics Act Source: Statistics Canada (Cansim Table 002-0001) Compiled by Agriculture and agri-food Canada, Animal industry division, Market information section - updated January 2022 |
|||||||||||
Total mink pelt production and average price
Total mink pelt production and average price
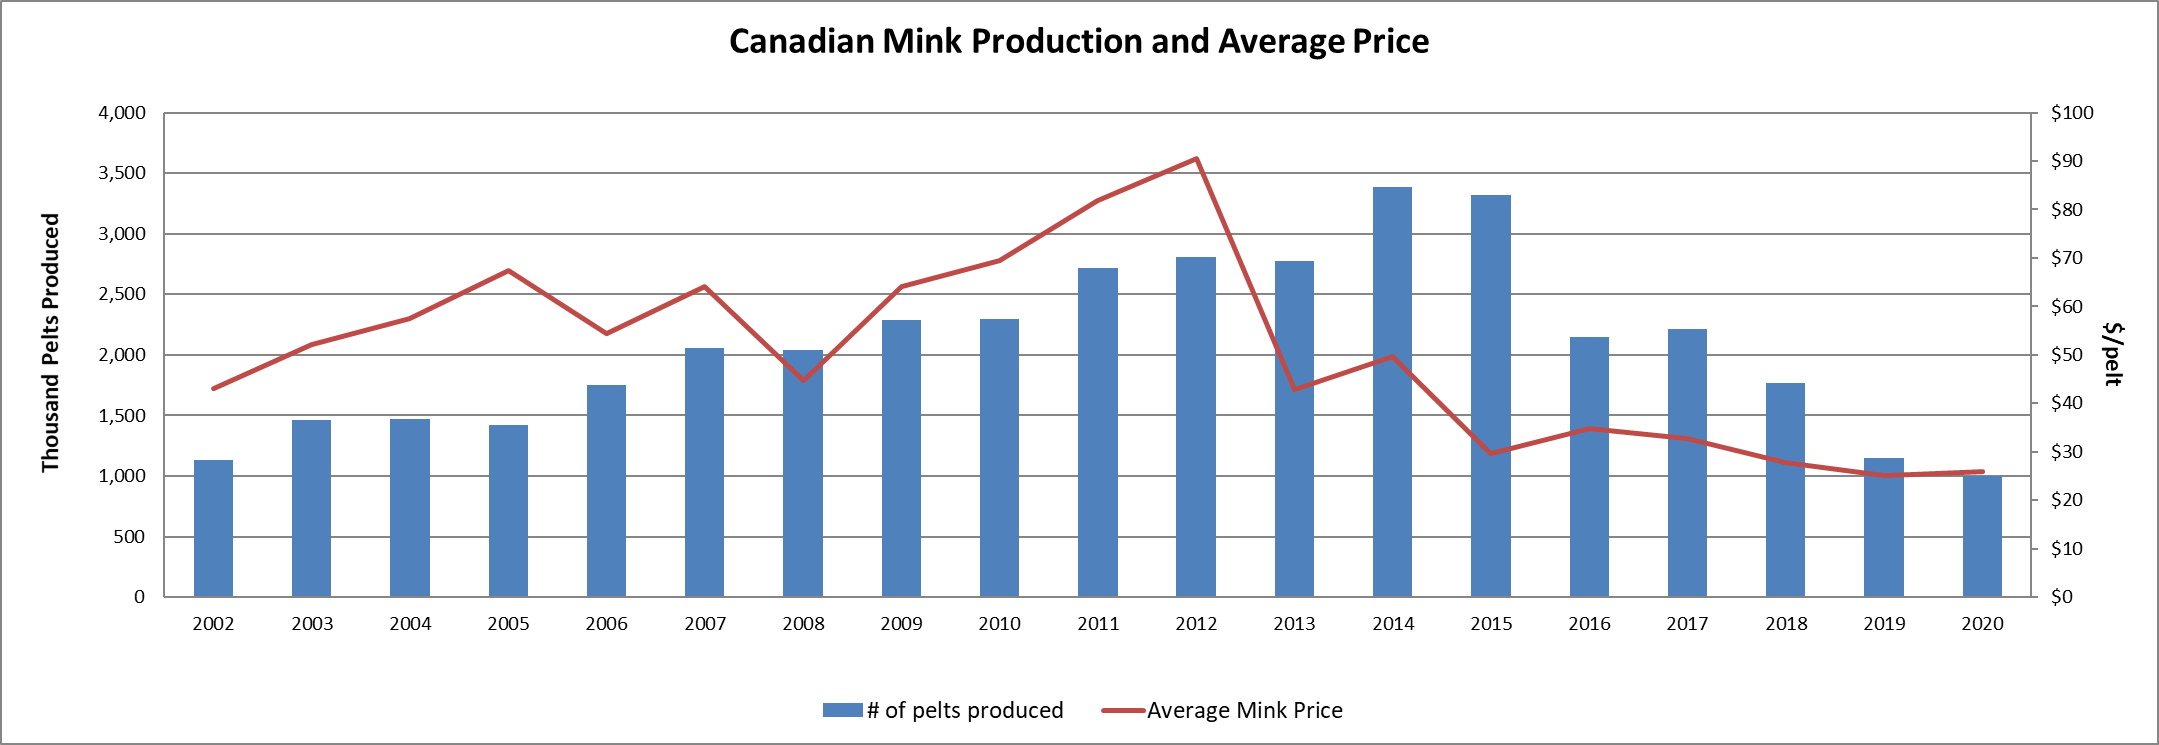
| Number of pelts produced | Value of pelts produced | Avg pelt price | |
|---|---|---|---|
| 2020 | 1,003,600 | 29,944,200 | 26 |
| 2019 | 1,151,700 | 44,095,000 | 25 |
| 2018 | 1,763,800 | 44,147,743 | 28 |
| 2017 | 2,216,200 | 97,309,785 | 33 |
| 2016 | 2,143,100 | 74,749,635 | 35 |
| 2015 | 3,317,150 | 98,091,233 | 30 |
| 2014 | 3,384,000 | 167,738,893 | 50 |
| 2013 | 2,771,500 | 118,836,752 | 43 |
| 2012 | 2,804,800 | 254,016,062 | 91 |
| 2011 | 2,714,400 | 222,214,839 | 82 |
| 2010 | 2,297,880 | 159,601,903 | 69 |
| 2009 | 2,291,090 | 147,028,298 | 64 |
| 2008 | 2,041,000 | 91,414,230 | 45 |
| 2007 | 2,055,070 | 131,692,385 | 64 |
| 2006 | 1,751,300 | 95,383,927 | 54 |
| 2005 | 1,417,000 | 95,539,741 | 67 |
| 2004 | 1,470,900 | 84,564,388 | 57 |
| 2003 | 1,461,600 | 76,251,071 | 52 |
| 2002 | 1,129,600 | 48,646,874 | 43 |
| Source: Statistics Canada (Cansim Table 003-0014) Compiled by Agriculture and agri-food Canada, Animal industry division, Market information section - updated January 2022 |
|||
If you have any questions or require additional information, please send an e-mail to aafc.redmeat-vianderouge.aac@agr.gc.ca
Our service standards
Service standards play a vital role in our market information program's commitment to planning, reporting and performance management. They clearly define the level of service that clients can expect under normal circumstances.
View the Service standards for red meat and livestock reports.