
Table of Contents
Department overview
Agriculture and Agri-Food Canada (AAFC): Overview
- AAFC is a federal organization of over 5,100 employees based across Canada who support our world-leading agriculture and agri-food sector.
- AAFC’s annual budget is over $3.6 billion with our main areas of focus being science and innovation, trade and market growth, and risk mitigation and management.
- AAFC is at the centre of the Agriculture and Agri-Food Portfolio which includes the Canadian Dairy Commission, the Canadian Grain Commission, the Farm Products Council of Canada, Farm Credit Canada, and the Canada Agricultural Review Tribunal. We also work closely with the Canadian Food Inspection Agency.
- To achieve our mandate, we must collaborate with partners and stakeholders:
- Other federal departments;
- Provinces and territories;
- Indigenous communities and organizations;
- International organizations
- Academia;
- Organizations representing:
- Producers;
- Processors;
- Consumers; and
- Civil Society.
AAFC’s national and international presence
- 5,146 total employees
- Over 2,500 employees (Not including 150 casual employees and 500 students) based in research centres across the country
- Over 2,200 at headquarters in Ottawa
- Over 400 working at headquarters in Winnipeg
- AAFC has 30 locally engaged staff and 10 Canada-based staff abroad in Canadian embassies/consulates/missions internationally through an agreement with Global Affairs Canada.

Description of the above image
Map of Canada showing locations of AAFC’s regional offices and research and development centres across Canada. They are organized in three regions : Coastal (Atlantic and Pacific), Prairies and Quebec and Ontario.
- British Columbia: Agassiz; Summerland, Burnaby
- Alberta: Lacombe, Lethbridge, Edmonton
- Saskatchewan: Saskatoon; Swift Current, Regina
- Manitoba: Brandon, Morden, Winnipeg
- Ontario: Harrow, London, Guelph, Ottawa
- Quebec: Saint-Jean-sur-Richelieu, Sherbrooke, Saint-Hyacinthe, Montréal, Québec
- New Brunswick: Fredericton
- Nova Scotia: Kentville, Truro, Halifax
- Prince Edward Island: Charlottetown
- Newfoundland and Labrador: St. John's
AAFC’s strong regional and international presence allows for high quality intelligence, analysis and engagement on regional agricultural conditions, key issues and supply capacity.
To learn more about the science and research activities conducted at each location: Facilities | Directory of scientists and professionals (science.gc.ca)
Core areas of responsibility and spending
AAFC’s annual budget is over $3.6 billion – a mix of voted and statutory funds.
- AAFC tracks plans and results in three core areas of responsibility: Market Growth, Science and Innovation and Risk Mitigation.
- More than three-quarters of the budget is dedicated to programs, which provide direct support to the sector.
- Business risk management (BRM) programs, which fall under sector risk (for example, AgriStability, AgriInvest), and Canadian Agricultural Partnership programming, which spans all areas of responsibility, are a significant expenditure.
| Core areas of responsibility | 2022-23 spending ($) |
|---|---|
Domestic and International Markets
|
892,560,711 |
Science and Innovation
|
795,759,112 |
Sector Risk
|
1,723,037,936 |
| Subtotal | 3,411,357,759 |
Internal Services
|
199,128,987 |
| Total | 3,610,486,746 |
| Amounts are from Supplementary Estimates (C) 2022-23 | |
AAFC branches and leadership team
- Deputy Minister (DM) and Deputy Minister’s Office (DMO)
- Associate Deputy Minister – Suzy McDonald
DM is main advisor to Minister and DMO is main liaison with Minister’s Office - Corporate Secretariat provides support in the areas of parliamentary affairs, portfolio coordination, appointments, correspondence, governance and administration
- Strategic Policy
Natasha Kim
Economic and environmental research and analysis, strategic planning, policy development, intergovernmental affairs, Cabinet affairs. - Programs
Liz Foster
Design and delivery of a full range of grants and contribution and other programs. - Science and Technology
Gilles Saindon and Andrew Goldstein
Wide range of agriculture and agri-food research, development and technology transfer activities at 20 research centres and sites. - Market and Industry Services
Tom Rosser
Trade negotiations, market information and analysis, sector engagement, regional intelligence, and emergency management. - International Affairs
Kathleen Donohue
Market development, implementation of trade agreements, addressing market access and regulatory trade issues.
Branch has both AAFC and CFIA employees. - Public Affairs
Mary Dila
Strategic communications, media relations, marketing, social media, public opinion research, translation, and other services. - Information Systems
Vidya ShankarNarayan
Information technology and information management support for internal and external programs and services. - Corporate Management
Marie-Claude Guérard
Finance, planning and reporting, security, assets, human resources and other corporate services. - Office of Audit and Evaluation
Kimberly Saunders
Audits and evaluations. - Legal Services
Kristine Allen
Shared between AAFC and CFIA.
- Strategic Policy
The broader agricultural portfolio
The Canadian Agriculture and Agri-Food Portfolio includes AAFC and five other organizations:
- Canadian Dairy Commission
- Canadian Grain Commission
- Farm Products Council of Canada
- Farm Credit Canada
- Canada Agricultural Review Tribunal
- Each organization provides important services to support the sector and Canadians, through legislative/regulatory functions, financial services and broader industry engagement.
- Each organization has its own Deputy Head, but the Deputy Minister is responsible for advising the Minister on all matters under the Minister’s responsibility and authority.
- Ultimately, the Minister is responsible to report to Parliament and Canadians on the activities of the department and portfolio.
The Canadian Food Inspection Agency (CFIA) reports to the Minister of Health. CFIA is not part of the Portfolio but works closely with AAFC. The Minister is responsible for the activities of CFIA that do not relate to food safety.
As part of the Corporate Management Branch, the Canadian Pari-Mutuel Agency is a special operating agency/revolving fund within AAFC that regulates and supervises pari-mutuel betting (a unique pool-betting system) in Canada on horse races. This agency ultimately benefits the public interest through ensuring pari-mutuel betting is conducted in a way that is fair to the public.
Portfolio organizations and leadership
Canadian Dairy Commission (CDC)
- Benoit Basillais, CEO
- Jennifer Hayes, Chair
- Headquartered in Ottawa, on the Central Experimental Farm, the CDC is a Crown Corporation that helps manage Canada’s dairy industry, including support prices and quota under the supply management system for dairy.
- The CDC has 73 employees and an annual budget $14.2 million.
Canadian Grain Commission (CGC)
- Doug Chorney, Chief Commissioner
- Headquartered in Winnipeg, the CGC regulates grain handling in Canada and establishes and maintains science-based standards of quality for Canadian grain.
- The CGC has 482 employees across the country and an annual budget of $74.6 million.
Farm Products Council of Canada (FPCC)
- Brian Douglas, Chair
- Headquartered in Ottawa, on the Central Experimental Farm, FPCC provides oversight of the national supply management agencies for poultry and eggs, as well as supervise national promotion and research agencies for farm products.
- The FPCC has 16 employees and annual budget of $3 million.
Farm Credit Canada (FCC)
- Justine Hendricks, CEO
- Jane Halford, Board Chair
- Headquartered in Regina, FCC is a financially self-sustaining federal Crown Corporation that provides financing to agricultural customers.
- FCC has 2,300 employees operating from 102 offices across Canada. FCC's current lending portfolio is over $44.5 billion in loans providing funds to close to 102,000 customers across Canada.
Canada Agricultural Review Tribunal (CART)
- Emily Crocco, Chair
- Headquartered in Ottawa, CART is an independent tribunal providing impartial review of cases brought by those charged with bringing animal or plant products into the country without permission, or failing to meet standards for humane transport of animals.
- CART has 8 employees and an annual budget of $1.13 million.
Legislative authorities and shared jurisdiction
AAFC and the Portfolio administer over 30 federal Acts related to agriculture and agri-food.
- The Department of Agriculture and Agri-Food Act says the Minister is responsible for: “agriculture; products derived from agriculture; and research related to agriculture and products derived from agriculture including the operation of experimental farm stations”. The Act enables the department to support the sector from the farm through all phases of producing, processing and marketing of agriculture products to consumers in Canada and in global markets.
- Some other key Acts include the: Farm Income Protection Act; Canadian Agricultural Loans Act; Agricultural Products Marketing Act; Safe Food for Canadians Act. These allow AAFC to deliver agricultural financial programs, marketing statutes, standards and regulations that ultimately contribute to the sector’s performance and safety.
Section 95 of the Constitution identifies agriculture as a shared jurisdiction in Canada. A high level of engagement is required between the department and the provincial and territorial governments in order to develop and deliver policies and programs that effectively support the sector across Canada.
Five-year federal-provincial-territorial (FPT) policy frameworks define the manner, purpose, and context in which governments work together on agricultural issues. Much of AAFC’s work and spending falls under the framework.
Looking ahead: Key departmental priorities
Sustainable Canadian Agricultural Partnership
Successfully implement the new five-year agriculture framework in collaboration with provinces and territories to achieve environmental, economic and social objectives.
Environment and climate change / Sustainable Agriculture Strategy
Support the efforts of farmers to reduce emissions (including fertilizer emissions), build resilience in the fight against climate change, and enhance sustainable agriculture.
Canada Grain Act modernization
Modernize the Canada Grain Act to ensure it protects producers and meets the needs of the sector now and in the future.
African swine fever
Continue to work with industry and provinces and territories to prevent African Swine Fever from entering Canada and prepare for a potential outbreak.
Pesticides
Support the transformation of the pesticide regulatory system and the development and adoption of alternative pest management solutions.
Business Risk Management
Continue work with provinces and territories to review and update business risk management programs.
Supply managed sectors
Continue to help drive innovation and growth in the supply-managed sectors and fulfill commitments to address the impacts of recent trade agreements — that is, Comprehensive Economic and Trade Agreement (CETA), Comprehensive and Progressive Agreement for Trans-Pacific Partnership (CPTPP) and Canada-United States-Mexico Agreement (CUSMA).
Supply chains and transportation
Work with key partners to strengthen and improve the resiliency of food supply chains.
Retail fees and Grocery Code of Conduct
Develop targeted solutions to mitigate the impact of new retail fees on the food value chain, including the development of a Grocery Industry Code of Conduct.
Agricultural Labour Strategy
In collaboration with partners, identify and implement strategies to improve the sector’s access to labour.
Market access and diversification
Continue to help Canada’s agricultural and agri-food businesses export their products and diversify into global markets.
Future of work and modernization
Implement common hybrid work model and National Headquarters Complex for the Agriculture Portfolio (NHCAP) workplace transformation project.
AAFC financial overview
Agriculture and Agri-Food Canada’s (AAFC) overall budget is a combination of statutory and voted funding, and is largely influenced by the 5 year federal, provincial, territorial (FPT) agricultural frameworks, most recently the Canadian Agricultural Partnership (CAP) 2018-23.
The following pieces are existing materials that summarize the current state of AAFC’s budget. All financial amounts involving CAP funding include the federal only components, as well as the AAFC portion of cost-shared (with provinces and territories) programming.
2023/24 Main Estimates
Corporate Management Branch (CMB) prepares summary briefing materials for the Minister ahead of all Main and Supplementary Estimates submissions.
The following information provides a snap shot of our most recent Supplementary Estimates (C) and 23/24 Main Estimates, which will be tabled in parliament shortly.
- Financial Placemat - Supplementary Estimates C and Main Estimates
- Summary of Lapses
- Gs and Cs – Use of Funds to Date
- Briefing note to the Minister on Main Estimates
2022/23 Period 8 Financial Status Report
This deck was presented to the Departmental Management Committee (DMC) in January 2023 and provides an overview of AAFC financial situation as of Period 8 (November 30, 2022).
Every year, AAFC utilizes some of its previous annual budget lapse to fund items that were not allocated any resources through the annual budget allocation. This deck also includes the current list of proposed items to be resourced in 23/24 through this unallocated funding.
AAFC Budget Trend Summary (from 2019-20 to 2022-23)
This piece was prepared for the Deputy Minister in late January and provides a snapshot of the budget fluctuations in recent years, including the impact of emergency statutory COVID-19 programs.
Agriculture and Agri-Food Canada Overview of Financial Information
| Vote | 2021-22 Estimates to Date (Main plus Supplementary Estimates) |
2021-22 Expenditures |
2022-23 Main Estimates | 2022-23 Supplementary Estimates (A) | 2022-23 Supplementary Estimates (B) | 2022-23 Supplementary Estimates (C) | 2022-23 Estimates to Date (Main plus Supplementary Estimates) |
2022-23 Treasury Board Central Votes | 2022-23 Authorities to Date (Estimates to Date plus TB Central Votes) |
2023-24 Main Estimates | |
|---|---|---|---|---|---|---|---|---|---|---|---|
| Operating expenditures (net of revenue) | Vote 1 | 628 | 630 | 608 | 3 | 32 | (7) | 636 | 33 | 668 | 464 |
| Capital expenditures | Vote 5 | 51 | 49 | 38 | 0 | 7 | 8 | 53 | 7 | 60 | 32 |
| Grants and Contributions | Vote 10 | 751 | 682 | 583 | 47 | 111 | 8 | 748 | 0 | 748 | 513 |
| Total Voted | 1,430 | 1,361 | 1,229 | 50 | 149 | 9 | 1,437 | 40 | 1,476 | 1,009 | |
| Grants and Contributions | Statutory | 2,408 | 2,030 | 1,954 | 0 | 108 | 0 | 2,062 | 0 | 2,062 | 758 |
| Employee Benefits and Other | Statutory | 69 | 71 | 70 | 0 | 1 | 0 | 72 | 0 | 72 | 61 |
| Total Statutory | 2,477 | 2,101 | 2,025 | 0 | 109 | 0 | 2,134 | 0 | 2,134 | 818 | |
| Total | 3,907 | 3,462 | 3,253 | 50 | 258 | 9 | 3,571 | 40 | 3,610 | 1,827 | |

Description of the above image
2021-22 Estimates to Date by Core Responsibililty ($ millions)
- Sector Risk 2,142 (55%)
- Science and innovation 683 (17%)
- Domestic and International Markets 919 (24%)
- Internal services 163 (4%)
Total estimates to date: $3,907 million
Sector Risk made up a little over half of the 2021-22 estimates to date, and Internal Services contributed the least to the estimates.

Description of the above image
2021-22 Estimates to Date - Grants & Contributions by Program ($ millions)
- Canadian Agricultural Partnership (CAP) 2,181 (69%)
- Supply Management 550 (17%)
- Environment & Climate Change 34 (1%)
- Other Grants & Contributions 187 (6%)
- COVID-19 207 (7%)
Total grants and contributions: $3,159 million
Vote 10: $751 million; Statutory: $2,408 million
Almost three-quarters of the 2021-22 grants and contributions estimates comes from the Canadian Agricultural Partnership (CAP) program.

Description of the above image
2021-22 Estimates to Date - Grants & Contributions Cost-shared versus. Federal ($ millions)
- Cost-shared CAP 2,061 (65%)
- Federal - CAP 120 (4%)
- Federal - Supply Management 550 (17%)
- Federal - Environment and Climate Change 34 (1%)
- Federal - Other 187 (6%)
- Federal - COVID-19 207 (7%)
Total federal: $1,098 million
Total cost-shared: $2,061 million
Total grants and contributions: $3,159 million
Vote 10: $751 million; Statutory: $2,408 million
Over half of the 2021-22 grants and contributions estimates is from Cost-shared Canadian Agricultural Partnership (CAP).

Description of the above image
2021-22 Estimates to Date - by Core Responsibility ($ millions)
- Sector Risk 1,723 (48%)
- Science and Innovation 787 (22%)
- Domestic and International Markets 891 (25%)
- Internal Services 170 (5%)
Sector Risk made up a little less than half of the 2022-23 estimates to date, and Internal Services contributed the least to the estimates.

Description of the above image
2022-23 Estimates to Date - Grants and Contributions by Program ($ millions)
- Canadian Agricultural Partnership (CAP) 1,811 (65%)
- Supply Management 574 (20%)
- Environment and Climate Change 170 (6%)
- Other Grants and Contributions 255 (9%)
More than half of the 2022-23 grants and contributions estimates comes from the Canadian Agricultural Partnership (CAP) program.
Description of the above image
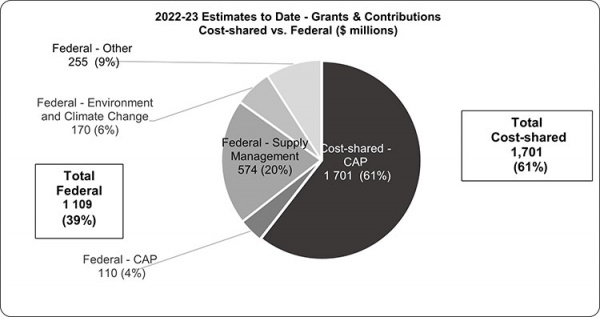
2022-23 Estimates to Date - Grants & Contributions Cost-shared vs. Federal ($ millions)
- Cost-shared CAP 1,701 (61%)
- Federal - CAP 110 (4%)
- Federal - Supply Management 574 (20%)
- Federal - Environment and Climate Change 170 (6%)
- Federal - Other 255 (9%)
Total federal: $1,109 million (39%)
Total cost-shared: $1,701 (61%)
Cost-shared Canadian Agricultural Partnership (CAP) makes up over half of the 2022-23 grants and contributions estimates.
| 2019-20Table 1 note 1 | 2020-21Table 1 note 2 | 2021-22Table 1 note 3 | ||||
|---|---|---|---|---|---|---|
| ($ millions) | (%) | ($ millions) | (%) | ($ millions) | (%) | |
| Grants and contributions | 38 | 55 | 108 | 87 | 69 | 68 |
| Capital expenditures | 17 | 24 | 5 | 4 | 7 | 7 |
| Operating expenditures | 15 | 21 | 11 | 9 | 26 | 25 |
NotesThe majority of lapses from 2019 to 2022 came from grants and contributions.
|
||||||
Grants and contributions (Gs & Cs)
| Funding Use | Initiative | 2021-22 Estimates to date ($) | 2022-23 Estimates to date ($) |
|---|---|---|---|
| Canadian Agricultural Partnership (CAP) | AgriAssurance (G&C) | 14,797,441 | 15,495,139 |
| AgriCompetitiveness (G&C) | 3,130,000 | 3,130,000 | |
| AgriDiversity (G&C) | 1,000,000 | 1,000,000 | |
| AgriInnovate (G&C) | 21,700,000 | 21,399,730 | |
| AgriInsurance | 623,000,000 | 623,000,000 | |
| AgriInvest | 139,460,000 | 139,460,000 | |
| AgriMarketing (G&C) | 24,650,487 | 25,371,909 | |
| AgriRecovery | 518,513,335 | 226,513,335 | |
| AgriRisk | 8,600,000 | 8,600,000 | |
| AgriScience (G&C) | 45,836,520 | 35,057,094 | |
| AgriStability | 539,770,760 | 483,160,380 | |
| FPT Cost-shared under CAP | 240,518,534 | 228,473,993 | |
| CAP total | 2,180,977,077 | 1,810,661,580 | |
| Covid-19 | Emergency Food Security Fund | 142,500,000 | - |
| Mandatory Isolation Support | 64,085,450 | - | |
| Covid-19 total | 206,585,450 | - | |
| Other | AgriCompetitiveness (G&C) | - | 3,544,780 |
| Agricultural Marketing Programs Act | 104,800,000 | 109,000,000 | |
| Canadian Agricultural Loans Act | 13,111,013 | 13,111,013 | |
| Canadian Agricultural Strategic Priorities program | 19,241,000 | 11,770,852 | |
| Farm Products Agencies Act | 100,000 | 100,000 | |
| Food Policy | 10,951,800 | 11,541,948 | |
| Food Waste Reduction Challenge | 3,500,000 | 7,400,000 | |
| Innovative Solutions Canada | 3,550,000 | 2,730,000 | |
| International Collaboration program | 4,643,000 | 7,743,000 | |
| Living Laboratories | 2,500,000 | 1,500,000 | |
| Youth Employment and Skills Strategy | 24,606,934 | 3,324,714 | |
| Wine Sector Support Program | - | 79,553,849 | |
| African swine fever | - | 3,500,000 | |
| Other total | 187,003,747 | 254,820,156 | |
| Supply Management Initiatives | Dairy Direct Payment Program | 469,000,000 | 468,000,000 |
| Investments in the Dairy Sector | 52,000,000 | - | |
| Market Development Program for Turkey and Chicken | 4,000,000 | 7,000,000 | |
| Poultry and Egg On-Farm Investment Program | 25,000,000 | 80,000,000 | |
| Supply Management Processing Investment Fund | - | 19,500,000 | |
| Supply Management Initiatives total | 550,000,000 | 574,500,000 | |
| Environment and Climate Change programs | Agricultural Clean Technology program | 13,928,572 | 62,816,071 |
| Agricultural Climate Solutions | 16,000,000 | 107,597,500 | |
| Agricultural Greenhouse Gases program | 4,382,000 | - | |
| Environment and Climate Change programs total | 34,310,572 | 170,413,571 | |
| Grand total | 3,158,876,846 | 2,810,395,307 |
Memorandum to the Minister
Approval Sought for Agriculture and Agri-Food Canada’s Main Estimates 2023-24
(For Decision)
Purpose:
To obtain your agreement with the content of Agriculture and Agri-Food Canada’s (AAFC) 2023-24 Main Estimates.
Summary:
- AAFC’s proposed 2023-24 Main Estimates total $1.827 billion, a net decrease of $1.426 billion in comparison to the 2022-23 Main Estimates of $3.253 billion. This significant decrease is mainly due to the sunsetting of the Canadian Agricultural Partnership and the Dairy Direct Payment programs. Once the upcoming Sustainable Canadian Agricultural Partnership (SCAP) and the renewed Dairy Direct Payment Program (DDPP) are approved, they will be reflected in Supplementary Estimates in 2023-24.
- With the SCAP funding not coming until Supplementary Estimates, in order to cash manage until full supply of Main Estimates at the end of June, AAFC has requested an additional three twelfths ($115.9 million) of Vote 1 Operating for Interim Supply. This is on top of the standard three twelfths of the voted Main Estimates amount that is issued to departments as Interim Supply until June.
- The Treasury Board Secretariat (TBS) requires a confirmation by January 31, 2023 that you have been briefed and are in agreement with the content of AAFC’s 2023-24 Main Estimates.
- Your approval is sought by January 30, 2023 in order to meet the TBS deadline.
- The 2023-24 Main Estimates are expected to be tabled in Parliament in February 2023.
Context:
The 2023-24 Main Estimates represent the first step of the 2023-24 appropriations and are based on the results of the 2023-24 Annual Reference Level Update (ARLU). Based on the proposed ARLU (Annex A), the Department’s reference levels will be approximately $1.827 billion in 2023-24 and less than $1.6 billion in each year thereafter as a result of the Canadian Agricultural Partnership (CAP) and the DDPP sunsetting. These reference levels will increase once the SCAP and the renewed DDPP are approved.
Departments are required to provide a Highlights section (Annex B) to the Treasury Board Secretariat, which provides the opportunity for departments to explain the key elements of the financial information presented in the Estimates document, including important trends, anomalies or variances and highlight new initiatives for which funding was announced and included in the Main Estimates.
When comparing the 2023-24 Main Estimates to the 2022-23 Main Estimates, there is a net decrease of $1.426 billion. Notable changes include:
- $1.217 billion decrease due to the sunsetting of CAP at the end of 2022-23;
- $471.1 million decrease due to the sunsetting of DDPP at the end of 2022-23.
Only partially offset by the following increases:
- $86.6 million for the Agricultural Clean Technology program;
- $82.4 million for the Wine Sector Support Program;
- $39.6 million for the Supply Management Processing Investment Fund;
- $35.8 million for the Agricultural Climate Solutions Program;
- $18.0 million for African Swine Fever Industry Preparedness Program (pending Treasury Board approval).
With the SCAP funding not coming until Supplementary Estimates, AAFC has requested a total Interim Supply of $368.1 million to cover the spending for the first three months of 2023-24, until full supply is received in June. This amount includes an additional three twelfths ($115.9 million) in Vote 1 Operating on top of the standard three twelfths of the voted Main Estimates amount that is issued to departments as Interim Supply until June.
The Chief Financial Officer is responsible for providing overall approval of the Main Estimates. This approval is to be provided through a formal Chief Financial Officer sign-off and also signifies that you have been briefed and are in agreement with the content of AAFC’s 2023-24 Main Estimates. The Chief Financial Officer sign-off is due to the TBS by January 31, 2023.
The 2023-24 Main Estimates are expected to be tabled in February 2023. Departmental staff will prepare a Question Period card for your use to address potential questions (if any) after the tabling and release of these Main Estimates.
Departmental officials will schedule a briefing with you and your staff at your convenience.
Recommendation:
It is recommended that you approve the proposed 2023-24 Main Estimates by January 30, 2023.
Chris Forbes
Deputy Minister
Agriculture and Agri-Food Canada
Direction:
- I concur
- I do not concur
- I concur with changes
The Honourable Marie-Claude Bibeau, PC, MP
Attachments
Annex A : 2023-24 ARLU Overall Summary
Annex B : AAFC’s 2023-24 Main Estimates Highlights
Prepared by:
- Apolline Mukandanga, CMB/FRMS/FRMD, 613-266-0965
In consultation with:
- Natalie Rosas, CMB/FRMS/FRMD, 613-266-5489
Annex B 2023-24 Main Estimates Highlights Section
Approximately $1,827 million in total funding is anticipated through the Main Estimates ($1,009 million in voted appropriations and $818 million in statutory). This excludes funding for the upcoming Sustainable Canadian Agricultural Partnership, expected to launch April 1, 2023 and funding anticipated through Budget 2023.
With the funding received in Main Estimates, Agriculture and Agri-Food will continue to work towards ensuring that the Canadian agriculture and agri-food sector takes advantage of new and emerging market opportunities, utilizes science and innovation to strengthen its competitive advantages, anticipates, mitigates and responds to risk in a manner that supports its sustainable growth.
AAFC will continue to support the implementation of the Emissions reduction plan through Agricultural Climate Solutions with the aim to use natural climate solutions to fight climate change; and through on-farm uptake of clean technologies that will enable the Canadian agricultural sector to contribute to the reduction of greenhouse gas emissions and build resilience. AAFC will support the supply managed dairy, poultry and egg producers and processors as they transition to new market realties by reducing the impact of concessions on access to the Canadian dairy, poultry and egg market as a result of the ratification of the Canada-European Union Comprehensive Economic and Trade Agreement (CETA) and the Comprehensive and Progressive Agreement for Trans-Pacific Partnership (CPTPP).
These Main Estimates also include support to licensed Canadian wineries to help them adapt to ongoing and emerging challenges they are facing as they adapt to the repeal of the excise duty exemption on 100 percent Canadian wine.
Overall (voted and statutory), Agriculture and Agri-Food total authorities for 2023-24 have a net decrease of $1,426.3 million from the previous year’s total Main Estimates.
This net decrease in funding is primarily attributable to:
- The sunsetting of services and programs under the Canadian Agricultural Partnership, the five-year (2018-2023) policy framework by federal, provincial and territorial governments for Canada's agricultural and agri-food sector and the Dairy Direct Payment program.
Financial Status Report – November 30, 2022 (Period 8)
Objectives
- Provide an overview of our financial position as of Period 8 (P8)
- Recommend the approval off-cycle Unallocated Funding Requests - $12.9 million
- Identify next steps
Financial summaries by Vote
| Item | 2022-2023 | 2021-2022 | Variance | ||||||||||
|---|---|---|---|---|---|---|---|---|---|---|---|---|---|
| 2022-23 adjusted budget ($ thousand) | 2022-23 Annual forecast ($ thousand) | 2022-23 Surplus (deficit) in BPC ($ thousand) | 2022-23 Slippage and forecast adjustments ($ thousand) | 2022-23 Expected surplus (deficit) ($ thousand) | 2022-23 Expected surplus (deficit) (%) | 2022-23 Actuals | 2022-23 percentage of P8 budget spent | 2021-22 year-end actuals ($ thousand) | 2021-22 percentage of P8 budget spent | Variance 2022-23 forecast versus 2021-22 actuals ($ thousand) | Variance P8 versus P6 expected surplus (deficit) ($ thousand) | ||
| Salary | 466,423 | 453,871 | 12,552 | 2,271 | 14,823 | 3 | 294,267 | 63 | 449,557 | 65 | 4,314 | 3,026 | |
| NPO | 259,446 | 250,505 | 8,941 | (1,087) | 7,853 | 3 | 118,534 | 46 | 212,099 | 42 | 38,406 | 2,107 | |
| Vote 1Table 7 note1 Operating | 725,869 | 704,376 | 21,493 | 1,184 | 22,677 | 3 | 412,801 | 57 | 661,656 | 57 | 42,720 | 5,133 | |
| Vote 5Table 7 note2 Capital | 57,741 | 50,073 | 7,668 | 993 | 8,661 | 15 | 24,351 | 42 | 49,362 | 30 | 711 | 4,808 | |
| Vote 10 - G&Cs | 743,051 | 731,942 | 11,109 | (5,383) | 5,725 | 1 | 214,161 | 29 | 681,734 | 31 | 50,208 | (20,345) | |
| Total Voted | 1,522,769 | 1,486,391 | 40,270 | (3,207) | 37,063 | 2 | 651,313 | 43 | 1,392,751 | 40 | 93,639 | (10,404) | |
| Statutory G&Cs | 2,154,429 | 2,154,429 | 621,156 | 29 | 2,029,786 | 33 | 124,643 | ||||||
| Total | 3,677,199 | 3,640,820 | 40,270 | (3,207) | 37,063 | 1 | 1,272,468 | 3,422,537 | 218,283 | (10,404) | |||
Notes
|
|||||||||||||
Vote 1 - Operating
- Expected Surplus up $5.1 million since P6:
- Budget up $21.5 million - mainly due to funding for WID and EX compensation as well as ADRP frozen funding, offset by Vote 1 to 5 funding transfer
- Forecast up $3.8 million - mainly related to increased spending on EX compensation and utility costs, offset by reduced spending due to staffing/contract delays
- Adjustments down $12.5 million - for the non-forecasted spending related to Off-cycle Unallocated Funding Requests & change in forecasted slippage
- Estimated Operating Budget Carry Forward (OBCF) = $30.4 million (Ceiling = $33.0 million)
- Increase of $4.4 million since P6
- Without the earmarked $13.3 million WID surplus, OBCF = $17.1 million, a decrease of $9.0 million since P6
- Mainly due to $5.5 million vote transfer and significant forecast spending related to off-cycle requests
Vote 5 - Capital
- Expected Surplus up $4.8 million since P6
- Budget up $5.5 million, due to Vote 1 to 5 funding transfer
- Forecast down $3.8 million, mainly due to PSPC backlog as well as world-wide supply chain issues
- Adjustments down $4.5 million for change in forecasted slippage
- Estimated Capital Budget Carry Forward (CBCF) = $8.7 million (Ceiling = $11.5 million)
- Increase of $4.8 million since P6, mainly due to the inclusion of $5.5 million Vote transfer
- Risk of going over CBCF ceiling is considered low
- Increase of $4.8 million since P6, mainly due to the inclusion of $5.5 million Vote transfer
Vote 10 and Statutory G&Cs
- Vote 10
- Canadian Agricultural Partnership (CAP) Cost-Shared - $8.0 million surplus cannot be re-profiled as this is the final year of CAP before transitioning to SCAP
- Statutory G&Cs
- Business Risk Management (BRM) – $1,763 million Forecast is at 110% of Maximum Envelope of $1,609 million, due to AgriInsurance increase of $323 million (PCO and TBS are aware)
- AgriInsurance up $323 million - Significant increase in commodity prices since 2020, which affects premiums and causes higher forecasts
- AgriStability up $155 million - Widespread drought conditions and high input costs
- Agricultural Disaster Relief Program (ADRP) down $399 million - Funding received to assist with drought and wildfires in 2021-22

[Description of the above image]
| Other surplus | CAP cost-shared surplus | |
|---|---|---|
| CASPP | 498 | |
| ACS and ACS - on farm | 1,321 | |
| CAP | 1,290 | 8,000 |
| Total | 3,109 | 8,000 |
Statutory 2022-23 Forecast versus 2021-22 Actuals ($ thousand)

Description of the above image
| 2022-23 | 2021-22 | Increase | |
|---|---|---|---|
| Others | (6,363) | (12,962) | 6,599 |
| ADRP | 45,133 | 443,738 | (398,605) |
| AMPA | 49,213 | 30,727 | 18,486 |
| AgriInvest | 168,865 | 156,426 | 12,439 |
| AgriStability | 386,582 | 231,752 | 154,830 |
| DDPP | 468,000 | 460,266 | 7,734 |
| AgriInsurance | 1,043,000 | 719,839 | 323,161 |
| Total | 2,154,430 | 2,029,786 | 124,644 |
Observations / Recommendation
Observations
- CBCF estimated at $8.7 million, with $5.5 million Vote transfer included ($2.8 million below the ceiling)
- OBCF estimated at $30.4 million, $2.6 million below the ceiling, assuming all the off-cycle requests approved (excluding WID funding surplus, OBCF estimated at $17.1 million)
Recommendation
Approve $12.9 million off-cycle Unallocated Funding Requests (see Annex A for listing)
Next steps
- Continue to monitor our financial position as we approach year-end
- P8 last official financial forecast
- Branches to alert Financial Management Advisors to any material changes
- Distribute approved off-cycle funding
- Return to governance for discussion and approval of initial budget, including discussion of risks such as:
- Management of Water Infrastructure Divestiture (WID)
- Increase in inflationary and non-discretionary spending
- Vote 5 Capital pressures (converted $11.9 million from Operating this year)
- External funding risks, such as Strategic Policy Review and Central Agency tightening
Annexes
- A. Off-cycle Unallocated Funding Requests
- B. Projected Slippage & Forecast Adjustments
- C. Vote 1 Operating by Branch
- D. Travel, Hospitality and Conferences (THC)
- E. Vote 5 Capital by Branch
- F. Voted G&Cs Details
- G. Statutory G&Cs Details
The following annexes can be found on SharePoint:
- H. Salary Details by Branch
- I. FTE Details by Branch
- J. 5 Year Salary & FTE Trend
- K. NPO Details by Branch
- L. Vote Netted Revenue (VNR)
- M. Requests for Unallocated Vote 1 Funding
| Item | Amount Requested | Amount Forecast in BPC | Variance | Recommended Funding Approval |
|---|---|---|---|---|
| $ thousand | ||||
| CMB Subtotal | 7,814 | 5,500 | 2,314 | 7,814 |
| Kentville soil / debris disposal | 1,300 | - | 1,300 | 1,300 |
| Integrated Services rise in fuel and electricity costs | 5,500 | 5,500 | - | 5,500 |
| Integrated Service – Priority maintenance activities | 1,014 | - | 1,014 | 1,014 |
| Legal Subtotal | 5,120 | - | 5,120 | 5,120 |
| BSE legal costs | 120 | - | 120 | 120 |
| Potential legal costs (estimated up to $5 million) | 5,000 | - | 5,000 | 5,000 |
| Total | 12,934 | 5,500 | 7,434 | 12,934 |
Annex B: Projected slippage and forecast adjustments
- Historical Slippage
- Salary: Average of last 4 years’ P8 slippages, considering unmaterialized planned staffing and other adjustments
- NPO & Vote 5: Average of last 4 years’ P8 slippages (between P8 vs year-end surpluses)
- Forecast Adjustments
- NPO: $7.4 million of the $12.9 million off-cycle requests are not forecasted in P8 BPC
- Vote 10: $5.4 million adjustment is to set Vote 10 expected surplus to $5.7 million, other lapsed funding in excess of this amount will be used to support Food Security
| Item | Branch budget | Historical slippage | Historical slippage | Slippage adjustments | Projected slippage | Forecast adjustments | Slippage and forecast adjustments |
|---|---|---|---|---|---|---|---|
| $ thousand | % | $ thousand | |||||
| Salary | 453,127 | 0.8 | 3,481 | (1,210) | 2,271 | 2,271 | |
| NPO | 264,241 | 3.6 | 9,580 | (3,233) | 6,347 | (7,434) | (1,087) |
| Vote 1 | 717,368 | 1.8 | 13,061 | (4,443) | 8,618 | (7,434) | 1,184 |
| Vote 5 Capital | 57,358 | 9.5 | 5,458 | (4,465) | 993 | - | 993 |
| Vote 10 G&Cs | 743,051 | - | (5,383) | (5,383) | |||
Annex C: Vote 1 Operating by Branch
| Branch | 2022-23 | 2021-22 | Variance | ||||||||
|---|---|---|---|---|---|---|---|---|---|---|---|
| Adjusted Budget | Annual Forecast | Surplus (Deficit) | Surplus (Deficit) | Actuals | Commit. | Free Balance | % of P8 Budget Spent | Year-End Actuals | % of P8 Budget Spent | 2022-23 Forecast vs 2021-22 Actuals | |
| $ thousand | % | $ thousand | % | $ thousand | % | $ thousand | |||||
| PAB | 21,023 | 20,239 | 785 | 4 | 11,957 | 7,487 | 1,579 | 57 | 20,066 | 49 | 173 |
| OAE | 4,837 | 4,173 | 664 | 14 | 2,369 | 1,635 | 833 | 49 | 3,936 | 48 | 237 |
| CMB | 166,390 | 158,751 | 7,639Table 3 note 1 | 5 | 92,216 | 62,229 | 11,945 | 55 | 149,740 | 57 | 9,011 |
| EO | 7,470 | 7,171 | 299 | 4 | 4,301 | 2,431 | 738 | 58 | 6,438 | 51 | 733 |
| LS | 4,925 | 4,667 | 258 | 5 | 4,378 | 222 | 325 | 89 | 5,459 | 83 | (792) |
| ISB | 106,289 | 103,085 | 3,203Table 3 note 2 | 3 | 55,868 | 41,966 | 8,455 | 53 | 87,751 | 55 | 15,335 |
| MISB | 29,312 | 29,469 | (156) | -1 | 17,576 | 10,901 | 836 | 60 | 27,354 | 62 | 2,115 |
| PB | 59,110 | 57,316 | 1,794 | 3 | 36,200 | 23,520 | (610) | 61 | 51,457 | 61 | 5,859 |
| SPB | 38,332 | 37,125 | 1,207 | 3 | 20,037 | 15,487 | 2,808 | 52 | 33,985 | 54 | 3,141 |
| IAB | 14,721 | 13,761 | 960 | 7 | 7,679 | 7,026 | 16 | 52 | 11,664 | 50 | 2,097 |
| FPCC | 2,778 | 2,943 | (164) | -6 | 1,695 | 1,145 | (62) | 61 | 2,377 | 49 | 565 |
| STB | 262,182 | 261,530 | 652 | 0 | 158,526 | 84,761 | 18,894 | 60 | 256,977 | 59 | 4,552 |
| Branch Total | 717,368 | 700,228 | 17,140 | 2 | 412,801 | 258,810 | 45,757 | 58 | 657,203 | 57 | 43,025 |
| Unallocated | 8,501 | 4,148 | 4,353 | 51 | - | - | 8,501 | - | 4,453 | - | (305) |
| Total | 725,869 | 704,376 | 21,493 | 3 | 412,801 | 258,810 | 54,258 | 57 | 661,656 | 57 | 42,720 |
Notes
|
|||||||||||
Annex D: Travel, Hospitality and Conferences (THC)
P8 THC forecasted spending over THC target by $1.4 million or 19%:
- Historically, Branches incur spending slippage around 20%, so anticipating THC expenditures to be in line with the target at year-end
| Travel | Hospitality | Conference | 2022–23 THC | ||||||||||||
|---|---|---|---|---|---|---|---|---|---|---|---|---|---|---|---|
| Branch | Target | Annual forecast | (Over)/under target | Target | Annual forecast | (Over)/under target | Target | Annual forecast | (Over)/under target | Target | Annual forecast | (Over)/under target | (Over)/under target | 2021-22 actuals | 2019-20 actuals |
| $ thousand | % | $ thousand | |||||||||||||
| PAB | 133 | 161 | (29) | 1 | 1 | 0 | 1 | (1) | 133 | 163 | (29) | (22) | 17 | 191 | |
| OAE | 36 | 26 | 11 | 1 | 1 | (0) | 1 | 1 | 38 | 27 | 12 | 31 | 0 | 55 | |
| CMB | 443 | 487 | (45) | 11 | 6 | 5 | 2 | 2 | (1) | 455 | 495 | (40) | (9) | 105 | 650 |
| EO | 141 | 355 | (215) | 1 | 50 | (49) | - | - | - | 14 | 405 | (263) | (186) | 48 | 203 |
| LS | 3 | 3 | 0 | - | - | - | - | - | - | 3 | 3 | 0 | 4 | 0 | 4 |
| ISB | 161 | 206 | (45) | - | - | - | 0 | - | 0 | 161 | 206 | (45) | (28) | 27 | 230 |
| MISB | 840 | 1,387 | (547) | 24 | 53 | (29) | 19 | 63 | (44) | 882 | 1,503 | (621) | (70) | 38 | 1,260 |
| PB | 389 | 448 | (59) | 19 | 16 | 3 | 4 | 9 | (5) | 412 | 473 | (61) | (15) | 33 | 589 |
| SPB | 387 | 388 | (2) | 19 | 25 | (5) | 0 | 7 | (7) | 406 | 420 | (14) | (3) | 21 | 580 |
| IAB | 649 | 909 | (260) | 54 | 70 | (17) | 7 | 16 | (9) | 710 | 995 | (285) | (40) | 136 | 1,015 |
| FPCC | 134 | 202 | (69) | 9 | 26 | (17) | 8 | (8) | 142 | 237 | (94) | (66) | 28 | 203 | |
| STB | 3,818 | 3,791 | 26 | 76 | 64 | 12 | 69 | 84 | (15) | 3,963 | 3,939 | 24 | 1 | 451 | 5,661 |
| Total | 7,132 | 8,364 | (1,233) | 214 | 310 | (97) | 102 | 190 | (88) | 7,448 | 8,865 | (1,417) | (19) | 904 | 10,640 |
Annex E: Vote 5 Capital by Branch
| 2022-2023 | 2021-2022 | Variance | |||||||||
|---|---|---|---|---|---|---|---|---|---|---|---|
| Adjusted Budget | Annual Forecast | Surplus (Deficit) | Surplus (Deficit) | Actuals | Commit | Free Balance | % of P8 Budget Spent | Year-End Actuals | % of P8 Budget Spent | 2022-23 Forecast vs 2021-22 Actuals | |
| $ thousand | % | $ thousand | % | $ thousand | % | $ thousand | |||||
| CMB | 30,135 | 27,305 | 2,830Table 4 note 1 | 9 | 16,654 | 10,492 | 2,989 | 55 | 26,438 | 30 | 867 |
| ISB | 9,344 | 8,452 | 892 | 10 | 3,909 | 4,025 | 1,410 | 42 | 9,550 | 43 | (1,099) |
| PB | 2,990 | 2,618 | 372 | 12 | 1,970 | 664 | 356 | 66 | 3,946 | 49 | (1,329) |
| STB | 14,888 | 11,699 | 3,190Table 4 note 2 | 21 | 1,818 | 11,719 | 1,351 | 12 | 9,428 | 16 | 2,271 |
| Unallocated | 57,358 | 50,073 | 7,285 | 13 | 24,351 | 26,900 | 6,106 | 42 | 49,362 | 31 | 711 |
| Total | 383 | - | 383 | 100 | - | - | 383 | 0 | - | - | - |
| Total | 57,74 | 50,073 | 7,668 | 13 | 24,351 | 26,900 | 6,490 | 42 | 49,362 | 30 | 711 |
Notes
|
|||||||||||
Annex F: Voted G&Cs Details
| 2022-23 | 2021-22 | Variance | |||||||
|---|---|---|---|---|---|---|---|---|---|
| Adjusted Budget | Annual Forecast | Surplus (Deficit) | Surplus (Deficit) | Actuals | % of P8 Budget Spent | Year-End Actuals | % of P8 Budget Spent | 2022-23 Forecast vs 2021-22 Actuals | |
| $ thousand | % | $ thousand | % | $ thousand | % | $ thousand | |||
| Cost Shared | |||||||||
| AgriRisk - Cost Shared | 3,269 | 3,269 | - | 0 | 467 | 14 | 3,227 | 13 | 42 |
| CAP - Cost Shared | 228,456 | 225,031 | 3,425 | 1 | 58,170 | 25 | 217,053 | 28 | 7,979 |
| CAP - Federal Attributed | 73,401 | 68,832 | 4,569 | 6 | 13,740 | 19 | 70,651 | 27 | (1,819) |
| Cost Shared Subtotal | 305,126 | 297,132 | 7,994 | 3 | 72,377 | 24 | 290,930 | 28 | 6,202 |
| Non-Cost Shared | |||||||||
| CAP Federal | 30,918 | 29,622 | 1,296 | 4 | 660 | 2 | 31,942 | 18 | (2,320) |
| A Food Policy for Canada | 21,015 | 21,015 | - | 0 | 6,007 | 29 | 22,469 | 24 | (1,454) |
| African Swine Fever | 3,500 | 3,500 | - | 0 | - | 3,500 | |||
| AgriCommunications | 4,015 | 4,015 | - | 0 | 359 | 9 | 55 | 3,959 | |
| Agricultural Climate Solutions (ACS) | 7,250 | 6,862 | 388 | 5 | 1,065 | 15 | 984 | 5,877 | |
| Agricultural Climate Solutions (ACS) - On Farm Action | 95,348 | 94,415 | 933 | 1 | 75,336 | 79 | 70 | 94,345 | |
| Agriculture Clean Tech | 62,816 | 62,816 | - | 0 | 13,597 | 22 | 14,056 | 48,760 | |
| AgriRisk - Federal | 4,831 | 4,831 | - | 0 | 713 | 15 | 2,950 | 30 | 1,881 |
| Canadian Agricultural Strategic Priorities Program (CASPP) | 10,871 | 10,373 | 498 | 5 | 2,211 | 20 | 26,292 | 33 | (15,919) |
| Dairy Farm Investment Program (DFIP) | 12,581 | 12,581 | - | 0 | 1,457 | 12 | 25,090 | 24 | (12,509) |
| Egg on Farm Investment Program | 68,419 | 68,419 | - | 0 | 37,024 | 54 | 38,419 | 30,001 | |
| Indigenous Agri-Food | 1,421 | 1,421 | 0 | 0 | 208 | 15 | 1,056 | 365 | |
| Innovative Solution | 2,730 | 2,730 | - | 0 | - | 3,485 | 49 | (755) | |
| International Collaboration | 1,433 | 1,433 | - | 0 | 330 | 23 | 1,388 | 23 | 45 |
| Living Lab Initiative | 2,400 | 2,400 | - | 0 | 1,140 | 48 | 2,400 | 33 | 0 |
| Market Development - Poultry & Egg | 6,000 | 6,000 | - | 0 | - | 3,500 | 2,500 | ||
| Processing Investment Fund | 19,500 | 19,500 | - | 0 | 1,153 | 6 | - | 19,500 | |
| Wine Industry Support | 79,554 | 79,554 | - | 0 | - | - | 79,554 | ||
| Youth Employment Strategy - Career Focus Program | 3,325 | 3,325 | - | 0 | 526 | 16 | 21,289 | 8 | (17,964) |
| 2021-22 Sunset Programs | - | - | - | - | 195,360 | 51 | (195,360) | ||
| Non-Cost Shared Subtotal | 437,925 | 434,810 | 3,114 | 1 | 141,784 | 32 | 390,804 | 33 | 44,006 |
| Total Cost-Shared and Non-Cost Shared | 743,051 | 731,942 | 11,109 | 1 | 214,161 | 29 | 681,734 | 31 | 50,208 |
Annex G: Statutory G&Cs details
| 2022-23 | 2021-22 | Variance | ||||||
|---|---|---|---|---|---|---|---|---|
| Adjusted Budget | Annual Forecast | Surplus (Deficit) | Actuals | % of P8 Forecast Spent | Year-End Actuals | % of P8 Forecast Spent | 2022-23 Forecast vs 2021-22 Actuals | |
| $ thousand | % | $ thousand | % | $ thousand | ||||
| ADRP BC Floods | 52,000 | 15,926 | 36,074 | 11,114 | 70 | 9,468 | 6,459Table 5 note 1 | |
| ADRP Drought & Wildfires | 31,000 | 29,207 | 1,793 | 25,677 | 88 | 417,784 | 37 | (388,578)Table 5 note 1 |
| ADRP Frozen and Other Programs | 143,513 | - | 143,513 | - | 16,486 | 47 | (16,486)Table 5 note 1 | |
| Agricultural Marketing Program Act (AMPA) | 109,000 | 49,213 | 59,787 | 21,686 | 44 | 30,727 | 38 | 18,486 |
| AgriInsurance | 1,043,000 | 1,043,000 | - | 472,413 | 45 | 719,839 | 53 | 323,161Table 5 note 2 |
| AgriInvest Contribution | 16,550 | 24,541 | (7,991) | 403 | 2 | 21,223 | 59 | 3,318 |
| AgriInvest Grant | 122,910 | 144,324 | (21,414) | 108,389 | 75 | 135,203 | 78 | 9,120 |
| AgriStability Contribution | 434,939 | 372,292 | 62,647 | (11,731) | (3) | 201,679 | (2) | 170,612Table 5 note 3 |
| AgriStability Grant | 48,221 | 14,290 | 33,932 | 774 | 5 | 30,072 | 5 | (15,782)Table 5 note 3 |
| Canadian Agricultural Loans Act (CALA) | 13,111 | 506 | 12,605 | (696) | (137) | 113 | (9) | 393 |
| Dairy Direct Payment Program | 468,000 | 468,000 | - | (5) | (0) | 460,266 | 7,734 | |
| Others | 100 | (6,869) | 6,969 | (6,869) | 100 | (13,075) | 100 | 6,206 |
| Total Statutory Gs & Cs | 2,482,345 | 2,154,429 | 327,915 | 621,156 | 29 | 2,029,786 | 33 | 124,643 |
Notes
|
||||||||
AAFC Budget Trend Summary (from 2019-20 to 2022-23)
January 26, 2023

Description of the above image
| Budget ($ million) | 2019-20 | 2020-21 | 2021-22 | P10 2022-23 |
|---|---|---|---|---|
| Vote 1 Operating | 670 | 673 | 704 | 724 |
| Vote 5 Capital | 63 | 53 | 56 | 60 |
| Vote 10 G&Cs | 477 | 620 | 751 | 748 |
| Statutory G&Cs | 1,697 | 2,168 | 2,550 | 2,512 |
| Total | 2,907 | 3,514 | 4,062 | 4,043 |
| FTE | 4,796 | 4,835 | 4,954 | 5,004 |
New COVID Funding (from 2019-20 to 2022-23)

Description of the above image
| New funding ($ million) | 2019-20 | 2020-21 | 2021-22 | P10 2022-23 |
|---|---|---|---|---|
| Vote 1 Operating | 2 | 3 | ||
| Vote 5 Capital | 0 | 0 | ||
| Vote 10 G&Cs | 119 | 207 | ||
| Statutory G&Cs | 280 | 0 | ||
| Total | 401 | 209 |
Vote 1 Operating
AAFC Vote 1 budget increased year-over-year mainly due to new funding associated with collective bargaining agreements’ renewal ($26.8 million in 2020-21, $5.5 million in 2021-22, $6.3 million in 2022-23), with the remaining increase related to new program funding such as Supply Management Initiative, Agricultural Climate Solutions, Agricultural Clean Technology Program, Canadian Wine Industry Support Program. New COVID funding was insignificant ($2.1 million in 2020-21 and $2.9 million in 2021-22)
- Salary budget increase of $45.0 million was mainly attributed to 3 branches: Information Systems Branch (ISB; increase of $12.2 million), Programs Branch (PB; increase of $10.0 million), Corporate Management Branch (CMB; increase of $8.4 million), which account for $30.6 million or 68% of budget increase
- Non Pay Operating (NPO) budget increase of $8.9 million was mainly attributed to ISB’s budget increase ($12.3 million) for various information management/information technology (IM/IT) related spending. Significant budget decrease in 2020-21 was due to one-time funding transfer to Vote 10 ($30 million+)
- Full Time Equivalent (FTE) increase of 208 was mainly attributed to ISB (increase of 106), PB (increase of 82), CMB (increase of 60), offset by FTE decrease in Science and Technology Branch (STB; decrease of 91), on average 69 FTEs or 1.4% per year, with a significant increase of 120 FTEs in 2021-22. In PB, COVID programs were mainly operated by redirecting existing FTEs, and FTE increase was primarily due to onboarding of new non-COVID programs.
Vote 5 Capital
AAFC Capital budget varied year-over-year mainly due to one-time funding such as Vote transfers in 2019-20 and 2022-23, as well as funding received from the Sale of Regina Farm in 2021-22; without one time funding, AAFC’s Capital budget has been gradually decreasing. New COVID funding was insignificant ($0.1 million in 2020-21).
Grants and Contributions (G&C)
- AAFC Voted G&C: Budget increased by $273.8 million or 57% from 2019-20 to 2021-22 mainly due to new COVID funding ($118.8 million in 2020-21 and $206.6 million in 2021-22). While COVID funding was phased out in 2022-23, this funding reduction was offset by increased funding from various programs in 2022-23, such as $85.3 million for the Agricultural Climate Solutions (ACS) on Farm Action, $79.6 million for Wine Industry Support Program, $30.0 million for Egg on Farm Investment Program, etc.
- AAFC Statutory G&C: Budget increased by $471.0 million or 28% from 2019-20 to 2020-21 mainly due to new COVID funding of $279.6 million in 2020-21 and funding increase of $123.0 million in Dairy Direct Payment Program (DDPP). While COVID funding was phased out in 2021-22, BRM program funding increased by $623.2 million from 2020-21 to 2022-23, resulting in a net budget increase of $343.5 million or by 16%.
Annexes
Vote 1 Operating by Branch
| Vote 1 - Operating ($ thousand) |
2019-20 | 2020-21 | 2021-22 | P10 2022-23 | ||||||||
|---|---|---|---|---|---|---|---|---|---|---|---|---|
| Sal | NPO | FTE | Sal | NPO | FTE | Sal | NPO | FTE | Sal | NPO | FTE | |
| PAB | 11,939 | 6,894 | 129 | 13,025 | 9,483 | 127 | 12,577 | 11,604 | 131 | 13,522 | 7,775 | 136 |
| OAE | 3,222 | 1,086 | 30 | 3,383 | 1,116 | 29 | 3,374 | 1,274 | 30 | 3,637 | 1,302 | 32 |
| CMB | 71,847 | 71,488 | 898 | 78,144 | 78,594 | 915 | 78,278 | 74,828 | 943 | 80,267 | 86,890 | 973 |
| EO | 6,149 | 1,520 | 53 | 6,542 | 1,414 | 61 | 6,341 | 959 | 59 | 6,633 | 1,049 | 63 |
| LS | 451 | 5,736 | 6 | 527 | 4,394 | 7 | 538 | 5,159 | 7 | 566 | 4,358 | 7 |
| ISB | 34,919 | 47,633 | 387 | 39,436 | 53,351 | 410 | 43,322 | 52,671 | 448 | 47,147 | 59,927 | 501 |
| MISB | 24,348 | 3,898 | 239 | 25,194 | 3,592 | 247 | 25,317 | 3,184 | 247 | 26,161 | 3,644 | 250 |
| PB | 38,832 | 8,485 | 518 | 42,095 | 8,824 | 539 | 48,926 | 9,720 | 584 | 48,782 | 10,873 | 610 |
| SPB | 21,716 | 8,995 | 211 | 22,011 | 9,387 | 223 | 24,224 | 11,305 | 226 | 26,357 | 12,465 | 241 |
| IAB | 8,520 | 5,281 | 79 | 8,726 | 3,912 | 81 | 8,796 | 4,342 | 79 | 8,959 | 6,024 | 82 |
| FPCC | 1,946 | 758 | 19 | 2,035 | 1,077 | 20 | 2,008 | 665 | 17 | 2,090 | 755 | 19 |
| STB | 195,075 | 74,731 | 2,226 | 206,704 | 67,108 | 2,175 | 196,997 | 67,696 | 2,184 | 193,733 | 68,979 | 2,169 |
| Branch Total | 418,965 | 236,505 | 4,796 | 447,824 | 242,251 | 4,835 | 450,698 | 243,406 | 4,954 | 453,127 | 264,241 | 5,083 |
| Unallocated and Frozen | 2,436 | 11,704 | 1,327 | (18,556) | 454 | 9,871 | 8,678 | (7,085) | (79) | |||
| Total | 421,401 | 248,209 | 4,796 | 449,151 | 223,696 | 4,835 | 451,151 | 253,277 | 4,954 | 466,423 | 257,156 | 5,004 |
Vote 5 Capital by Branch
| Vote 5 - Capital ($ thousand) | 2019-20 | 2020-21 | 2021-22 | P10 2022-23 |
|---|---|---|---|---|
| PAB | - | 88 | - | - |
| CMB | 27,546 | 28,799 | 27,644 | 30,135 |
| ISB | 8,512 | 7,847 | 10,002 | 9,344 |
| PB | 3,048 | 3,993 | 4,985 | 2,990 |
| STB | 14,343 | 12,150 | 13,030 | 14,888 |
| Branch Total | 53,448 | 52,877 | 55,660 | 57,358 |
| Unallocated and Frozen | 9,588 | - | 630 | 2,383 |
| Total | 63,036 | 52,877 | 56,290 | 59,741 |
Vote 10 G&Cs by Program
| Vote 10 G&Cs ($ thousand) | 2019-20 | 2020-21 | 2021-22 | P10 2022-23 |
|---|---|---|---|---|
| New COVID funding | 118,768 | 206,585 | ||
| Emergency Processing Fund | 15,000 | - | ||
| MISTFWP | 44,825 | 64,085 | ||
| On-Farm Support | 30,004 | - | ||
| Emergency Food Banks (LFIF) | 20,000 | 142,500 | ||
| Youth Employment Strategy | 7,482 | - | ||
| Surplus Food Rescue program | 1,457 | - | ||
| Major New Non-COVID funding | 53,419 | 248,321 | ||
| Wine Industry Support | 79,554 | |||
| Egg on Farm Investment Program | 38,419 | 68,419 | ||
| ACS- On Farm Action | 15,000 | 100,348 | ||
| Other Programs | 477,341 | 501,731 | 491,118 | 499,730 |
| Total | 477,341 | 620,499 | 751,122 | 748,051 |
Statutory G&Cs by Program
| Statutory G&Cs ($ thousand) | 2019-20 | 2020-21 | 2021-22 | P10 2022-23 |
|---|---|---|---|---|
| New COVID funding | - | 279,636 | - | - |
| Emergency Food Banks (LFIF) | 125,000 | |||
| Emergency Processing Fund | 62,500 | |||
| MISTFWP | 36,875 | |||
| Surplus Food Rescue program | 48,543 | |||
| On-Farm Support | 5,000 | |||
| Youth Employment Strategy | 1,718 | |||
| ADRP | 108,906 | 118,513 | 530,513 | 226,513 |
| AMPA | 87,300 | 90,300 | 104,800 | 109,000 |
| AgriInsurance | 668,000 | 654,000 | 733,000 | 1,043,000 |
| AgriInvest | 161,857 | 159,408 | 159,793 | 168,865 |
| AgriStability | 303,361 | 385,150 | 539,771 | 483,160 |
| CALA | 13,111 | 13,111 | 13,111 | 13,111 |
| DDPP | 345,000 | 468,000 | 469,000 | 468,000 |
| Other | 9,707 | 100 | 100 | 100 |
| Total | 1,697,243 | 2,168,218 | 2,550,089 | 2,511,749 |
MISTFWP – Mandatory Isolation Support for Temporary Foreign Workers Program
LFIF – Local Food Infrastructure Fund
ADRP – Agricultural Disaster Relief Program or AgriRecovery
AMPA – Agricultural Marketing Programs Act
CALA – Canadian Agricultural Loans Act
DDPP – Dairy Direct Payment Program
Future of work and modernization
Purpose
Provide an overview of Agriculture and Agri-Food Canada (AAFC) plans and anticipated results of the return to work policy related to:
- People
- Digital
- Space
- Booking tool
- Communications
Readiness - People
Ready by March 31
- Completion of all hybrid telework agreements
- Clarify Duty to Accommodate (DTA)/Ergonomics/ Telework and how they intersect
- Review and approval of full-time telework agreements
- Guidance to employees and managers regarding recourse
- Implementation of individual accommodation plans and ergonomic assessment needs
- Guidance on equipment
- Regularize any outstanding issues – position location, anomalies in data…
- Create Frequently Asked Questions (FAQ)
Post March 31
- Grievance process
- Completion of DTA requests (all prohibited grounds)
- Review process for any short term accommodations put it place
- Guidance and support for managers for insubordination
Readiness – Digital
Ready for March 31
Ready for March 31 implementation:
- Bandwidth / Wi-Fi testing and monitoring (for example, the Big Experiment and site health dashboards)
- Dashboard to monitor onsite presence
- Additional Wi-Fi sites (Agassiz, Guelph, Sherbrook, Charlottetown)
- Boardrooms
- 200+ boardrooms equipped across Canada (for example, surface, Cerebral Visual Impairment and polycoms) with an additional 85 by March 31
- Employee training sessions (February 2023)
- New weekly Quality Assurance process to ensure tech is working properly
- New National Headquarters Complex for the Agriculture Portfolio (NHCAP) service kiosks
- Configured unassigned spaces Information Technology (IT) configured
- Bot for telework agreements automating communications with employees, processing forms and logging of information
- Launch of M365 self-learning portal (February 2023)
- Government of Canada Secret Infrastructure (GCSI) readiness (that is, 75 active stations at NHCAP)
In Development
- Innovation Hub and Integrated Service Centre (NHCAP)
- Wi-Fi and GCSI expansion
- Accessibility of tools and services
Readiness – Space (NHCAP and Regions)
Where we are today
NHCAP
- Branch Neighbourhoods are complete
- Mice and keyboards have been added to workstations
- Regular replenishing cleaning supplies
- Contract in place to change locks on all boardrooms
Regions/RDCs
See Annex for details on regional offices (RO)
Ready by March 31
NHCAP
- An additional 383 workstations for a total of 995
- 91 closed offices
- Archibus rollout NHCAP – February 20
- Working with Public Services and Procurement Canada (PSPC) on temporary cafeteria services
- Building Emergency Evacuation Plan (BEEP)
Regions/RDCs
- Complete unassigned spaces in ROs
- Archibus rollout Winnipeg, Burnaby and Edmonton by March 31
Post March 31
NHCAP
- NHCAP Workplace Transformation
Regions/RDCs
- Unassigned spaces in Research Centres
Readiness – NHCAP Workplace Transformation Project
What is the Workplace Transformation Project (WTP)
- The WTP will efficiently provide AAFC with a modernized workplace that supports the hybrid working model.
- WTP is an office accommodation project based on GCworkplace standards. Designed to deliver activity-based workplaces via furniture-first solutions and repurposing existing constructed elements. The projects are delivered in a shorter timeframe and are more cost-effective than full fit-ups.
- It is base on the implementation of Activity Based Working (ABW), which is a concept that offers all employees shared use to a variety of workpoints, allowing them to choose the optimal setting to perform their tasks and functions.
What is included
What is included in the WTP?
- New furniture solutions (with re-use of existing furniture deemed re-usable);
- Refresh of paint and replacement or repair\cleaning of flooring;
- Accessibility upgrades;
- Audio-visual (A\V) equipment included in the GCworkplace standard bundle of goods.
Construction is expected to take between 12 and 18 months – the goal for completion is March 2023. The project is likely to take place in 2 phases:
- Phase 1 of the project includes the refit of T7-2 through T7-6
- Phase 2 will include T7 remainder (minus T7-9)
Readiness – Booking tool Archibus
Risks
Archibus current version is not fully accessible
Mitigation measures
- Some accessibility features planned for future Archibus rollouts for PSPC cluster (of which AAFC is part)
- Investigating option to accelerate AAFC accessibility features if availability to cluster too slow
- In meantime, proposed mitigation:
- IT Centre can book on behalf of any employee
- Booking can be done by team member or manager on behalf of others
- Employees significantly impacted likely have designated workspace
- Can consider temporary full time (FT) remote work for accessibility barriers
- AAFC to consult with Diversity Equity and Inclusion (DEI) community and unions prior to implementation
Readiness - Communications
Where we are today
Communications
- Managers Toolkit
- Team Charters
- Etiquette document
- Question of Week
- AgriSource updated
- Microsoft Teams channel
Engagement
- Pulse survey results
- Quick Response (QR) code to capture onsite feedback
Ready by March 31
Ongoing engagement: Drop-in sessions for all-staff, Branch Executive Committees (BEC), Regional Managers Committee (RMC), DEI community, union engagement.
DMs
- All staff townhall
- EX1 townhall
- Coffee Conversations – Return to Office (RTO) focus
Key Files: FT telework/exemptions, booking tool, monitoring, NHCAP transformation
Post March 31
Pulse survey – round 2
Ongoing re NHCAP Transformation project
Deploy Chatbot for basic questions
Hybrid days @AAFC – video vignettes of AAFC employees living hybrid
Risks/considerations
- WTP
- Equipment to provide employees in consideration of different policy instruments
- FT telework exceptions
- Departmental approach to hiring employees located more than 125 kilometres from AAFC designated site
- Accessibility
Regional Offices
Burnaby
- PSPC led GC Workplace project underway – Project completion date is sept 2023. Will consist of spaces to accommodate 28 full time equivalent (FTE)
Calgary
- Extending lease – planning underway to equip spaces
Edmonton
- 20 docking stations and 18 monitors were deployed to local IT for the setup of shared workspaces.
Regina
- Reduction of floors from 3 to 2 and office cleanup complete. Employees have moved into workstations.
Winnipeg (167 Lombard)
- Transformation almost complete (note PSPC has requested consolidation of 500 FTEs from two offices into 1).
- 200 unassigned stations setup on 3 floors
- 18 meeting rooms equipped with Teams + Surface Hub to be installed + Archibus reservation system + indigenous meeting room
- Closed doors offices converted to private rooms, GCSI room almost complete
- Human Resources (HR)/Labor Relations (LR) and Information Services Branch (ISB) neighbourhoods set up. Fire wardens and First aid volunteers in place.
Guelph
- All workstations are equipped with ergonomic sit stands, Senior Building Officer (SBO) confirmed height adjustable desks would not be necessary.
- Equipped 25 workstations to support unassigned seating.
- ISB confirmed a Surface hub is planned for that location – date To be confirmed
Moncton
- Space has already been refitted to GC Workplace
- Office cleanup exercise complete.
- Work has begun to create unassigned seating - ISB confirmed 30 docking stations were deployed to Moncton.
Halifax
- Clean up largely completed. 7 unassigned workspaces and an equipped boardroom for hybrid.
Truro
- Looking at amalgamating this office with the Canadian Food Inspection Agency (CFIA) Truro office
Montreal
- Space has already been refitted to GC Workplace. Confirming equipment required for 40% Directive.
Diversity, equity and inclusion statistics and action plan
AAFC has been active on diversity, equity and inclusion (DEI) efforts since 2001.
A brief history of DEI advancement at AAFC

Description of the above image
A brief history of DEI advancement at AAFC
Timeline of key activities
2001: AAFC’s Inclusiveness Management Committee created as single network representing all equity-seeking employees
2011: AAFC revived networks for women, Indigenous people and visible minorities to align with Public Service-wide changes that included the creation of champions and chairs committees
2014: AAFC’s LGBT Network created (now the Gender and Sexuality Diversity Inclusion Network)
2015: AAFC’s Women in Science Network created (now Women in STEM Network); Truth and Reconciliation Commission released final report
2016: Inclusiveness Management Committee dissolved due to the success of the five individual network model, and its mandate was passed to the new DI Network Secretariat and the DI networks
2017: DM’s task force committed to implementation of Many Voices One Mind: A Pathway to Reconciliation Report Action Plan; AAFC’s Indigenous Support and Awareness Office created
2018: Act to ensure a barrier-free Canada (the Accessible Canada Act) passed; Accessibility Strategy for the Public Service mandated activities for departments; AAFC’s 2018 to 2022 Diversity and Inclusion Plan introduced
2021: Clerk issues call to action on anti-racism, equity and inclusion with mandated activities for departments; DEI Team was set up as a centre of expertise to reflect its key role supporting DEI efforts across the department
Past employment equity and diversity, equity and inclusion plans at AAFC
2003 to 2006; 2006 to 2009; 2009 to 2014; 2014 to 2017; 2018 to 2021
2022 to 2025: This strategy contains an action plan and monitoring framework to formalize tracking on the progress of the DEI objectives identified.
- AAFC’s 2022-25 DEI Strategy launched in June 2022
- more comprehensive than just an Action Plan - includes a vision statement, roles and responsibilities, a monitoring framework, and short-term hiring goals based on Work Force Availability estimates.
- Environmental scan of comparable other government departments (OGD) shows that AAFC is managing DEI similar to other departments
- Chief Human Resources Officer is AAFC’s Designated Senior Official for Employment Equity Diversity and Inclusion mandated to lead departmental DEI efforts and employment equity obligations under the employment equity legislation
- Designated team operates under Human Resources (DEI Centre of Expertise)
- All OGDs have employees’ networks for each employment equity group and Champions
- AAFC has very engaged stakeholders and committed corporate leads: Opportunity for improved strategic coordination
- 5 employee-led networks with 2-3 co-chairs for each from across AAFC
- 1-2 Director General Champions for each Network
- 2 Assistant Deputy Minister (ADM) Champions for DEI; 1 ADM Champion for Indigenous Inclusion & Reconciliation
- Corporate leads: Human Resources, Public Affairs Branch and Information Systems Branch
- Deputy Minister engagement sessions with networks through the years has proven to be beneficial to demonstrate the commitment to make diversity, equity and inclusion an integral part of AAFC’s culture.
Listen, learn, act: AAFC's 2022-25 Diversity, Equity and Inclusion Strategy
AAFC'S Diversity, Equity and Inclusion Networks

Description of the above image
AAFC’s diversity, equity and inclusion networks
Diversity, Equity and Inclusion Champions
- Natasha Kim
- Vidya ShankarNarayan
Gender and Sexual Diversity Network
EX Network Champion
- Donald Boucher
Co-chairs
- Lydia Lipic
- Shy Lawson
- Tim Schwinghamer
Persons with Disabilities Network
EX Network Champion
- Katherine MacDonald
Co-chairs
- Pamela Warburton
- Jennifer Thorgeirson
- Katherine Whybourne
Visible Minorities Network
EX Network Champion
- Ling Lee
Co-chairs
- Joanne Paolo
- Philip Soladoye
- Larina Raghbir-Manmohan
Women in Science, Technology, Engineering and Math
EX Network Champions
- Joyce Boye
- Crista-Lynn Ferguson
Co-chairs
- Debbie Lockrey-Wessel
- Debra Moreau
Indigenous Network Circle
Champion of Indigenous Network Circle and Indigenous Inclusion
- Liz Foster
ISAO Manager
- Jackie Mason
Co-chairs
- Jennifer Many Bears
- Jordan Fraser
- Orlando Blacksmith
Listen. Learn. Act.
Roles and Responsibilities (current)
We all share the responsibility for building an inclusive workplace for all employees.
Deputy Ministers
- Ensure the development and successful implementation of strategies and initiatives to achieve AAFC’s DEI and reconciliation obligations and commitments, including allocating resources.
- Commit the Department to equitable opportunities for all individuals in recruitment, promotion, training and development or in any other employment opportunity.
DEI/Reconciliation ADMs and Executive Champions
- Act as role models, responsible for promoting and celebrating diverse and inclusive actions in the Department, and supporting safe spaces where all opinions are heard, considered and valued.
ADM-CMB and DG-HRD
- Functional authority with responsibility for developing, implementing and monitoring DEI and reconciliation strategies and initiatives.
- Provide subject matter expertise, data and reporting, and support to the DEI Networks.
- Senior official designated by the DM, responsible for overseeing the administration and progress of the departmental Employment Equity, Diversity and Inclusion (EEDI) program
Diversity, Equity and Inclusion Networks
- Identify issues and barriers for their respective equity and equity-seeking group and suggest next steps.
- Support departmental initiatives through consultations at the development and implementation stages to ensure issues or potential barriers are addressed, and advocate for an inclusive workplace.
Corporate Communications
- Support the development and delivery of communications on department-wide DEI and reconciliation events and activities to improve employee awareness and encourage employee participation.
Workplace Well-Being Ombudsperson
- Provide a safe space where employees can share workplace issues and help them navigate resolution processes, and promote a workplace where all employees feel safe, respected, empowered and engaged.
Union Representatives
- Actively participate in consultation and collaboration with the Human Resources Directorate, managers and employees on the development, implementation, and monitoring of DEI strategies and initiatives.
Accessibility
Led by Workplace Wellness Programs (HRD).
Diversity, Equity and Inclusion
Led by Centre of Expertise – Diversity, Equity and Inclusion (HRD).
Indigenous Inclusion and Reconciliation
Led by Indigenous Support and Awareness Office (HRD).
Governance Framework
Delivering DEI policy and program objectives through consultation and collaboration.
Policy and Program Authority
Deputy Ministers and Senior Management
Provide strategic direction and monitor departmental progress in achieving objectives. Ensure successful implementation of strategies and initiatives.
- Departmental Management Committee (DMC)
- Director General Management Committee (DGMC)
- Branch Executive Committees (BEC)
Centre of Expertise – Diversity, Equity and Inclusion (HRD)
Provide HR policy and program leadership, and oversight of AAFC’s DEI legislative obligations and policy directives. Deliver secretariat support to the Department’s DEI Networks.
- Work collaboratively with Senior Management, Champions, Networks, Branches and Key Stakeholders, and provide advice and guidance to help achieve results.
- Actively participate in central agency and other government-wide fora, and work to integrate insights, best practices and policy directions into AAFC’s activities.
- Monitor progress on departmental DEI legislative obligations, policy directives and strategic objectives to ensure that they are clearly communicated, reported on regularly and ultimately, achieved.
- Work with various stakeholders to ensure that AAFC’s DEI objectives are reflected in new and existing policies, programs and internal services.
- Lead the implementation of departmental initiatives and work closely with the Networks and Champions to help plan and deliver their activities.
Legislative Drivers
- Employment Equity Act
- Canadian Multiculturalism Act
- Canadian Human Rights Act
- Accessible Canada Act
- Public Service Employment Act
Consultation and Collaboration
Diversity, Equity and Inclusion Networks
Create a sense of community and raise awareness by organizing activities, and creating tools and resources for employees. Ensure a DEI lens is applied to departmental strategies and initiatives.
Diversity, Equity and Inclusion
- Co-Champions: Natasha Kim | Vidya ShankarNarayan
- Gender and Sexual Diversity Inclusion Network (GSDIN)
- Persons with Disabilities Network (PwDN)
- Visible Minorities Network (VMN)
- Women in S&T, Engineering and Mathematics (WiSTEM)
Indigenous Inclusion and Reconciliation
- Champion: Liz Foster
- Indigenous Network Circle (INC)
Recent Achievements in Advancing DEI at AAFC (2021-22 to 2022-23)
Selected examples, organized by 2022-25 Diversity, Equity and Inclusion Strategy pillar.
Increase representation and belonging
Pillar 1
- 7 processes that targeted recruitment of Indigenous, Black and other racialized candidates, and Persons with disabilities, for underrepresented positions at all levels.
- Launched the Diverse Staffing Board Initiative
- Implemented a form to collect employee self-id information and the consent of interested equity group employees to participate in targeted learning and development initiatives
Create inclusive and accessible workplaces
Pillar 2
- Hosted 3 Safe Space sessions:
- How anti-Muslim hate and racism have impacted folks and their communities
- Addressing Ableism and supporting the inclusion for all
- Being your authentic self at work
- Operationalized an online DEI Managers’ Toolkit
- All 209 managers with delegated HR authority completed mandatory CSPS Unconscious Bias and Inclusive Leadership training
- Early adopter of the GoC Workplace Accessibility Passport
- Showcased Diversity Speaks from the Heart; personal stories of employees
- Published over 80 news@work articles to help raise awareness
- Held over 14 network and departmental events
Enhance accountability and monitoring
Pillar 3
- Launched AAFC's 2022-25 DEI Strategy, Action Plan and Monitoring Framework to track commitments and monitor progress
- Provided quarterly reports on Branch employment equity plans that seek to address gaps in representation by 2024
- More than 550 employees signed the new PwDN Inclusion Pledge to demonstrate their commitment to DEI
- Responded to remedial actions requested in the CHRC Audit Report of AAFC for Racialized People in Managerial and Executive positions (70% complete)
Key employment equity and DEI metrics
AAFC regularly monitors progress in increasing representation and achieving DEI objectives.
Current employment equity representation (%)
(September 30, 2022)
| AAFC representation | Workforce availability | Gap between AAFC representation and workforce availability | |
|---|---|---|---|
| Indigenous Peoples | 3.5 | 4.0 | Gap |
| Persons with disabilities | 5.4 | 9.0 | Gap |
| Visible minorities | 18.8 | 15.3 | Exceeds workforce availability |
| Women | 42.6 | 52.7 | Slight gap |
| 2sLGBTQI+ | N/A | N/A | Table 6 note 1 |
NotesWorkforce availability estimates are based on the 2016 Census and the 2017 Canadian Survey on Disability.
|
|||
Diversity and Inclusion Index
(2021 update)
- Diversity Index Score
- 43/80
- Inclusion Index Score
- 48/90
- Progress is being made but there is more work to be done.
Resources committed to DEI at AAFC
Direct resources as of December 2022.
Centre of Expertise – DEI (HRD)
1 – Manager
4 – Policy / Program
3 – Network Secretariat
$69K NPO Budget (2022-23)
Indigenous Support Awareness Office (HRD)
1 – Manager
7 – Program / INC
$315K NPO Budget (2022-23)
Note: Networks allocated $5,000 annually to fund activities. Additional HRD, Champions and Branch resources also support DEI initiatives. The use of financial coding is being explored to improve tracking.
| Network | Champions | Co-chairs | Members | |
|---|---|---|---|---|
| ADM | Network | |||
| GSDIN | 2 | 2 | 3 | 114 |
| PwDN | vacant | 3 | 50 | |
| VMN | 1 | 3 | 115 | |
| WiSTEM | 2 | 2 | 200 | |
| INC | 1 | 1 | 3 | 107 |
Note: ADM DEI Co-Champions share all DEI networks, and the network champions are generally DG-level, except for INC.
Department snapshot
Total AAFC Employees 5,146
(43% work in National Capital Region)
Approximate annual budget $3.6 billion
2022-2023 Budget
- Operating: $668.4 million
- Capital: $59.7 million
- Voted Grants and Contributions: $748.1 million
- Statutory: $2,134.3 million
- Total:$3,610.5 billion
AAFC research and development centres and offices

[Description of the above image]
Map of Canada showing locations of AAFC’s regional offices and research and development centres across Canada. They are organized in three regions : Coastal (Atlantic and Pacific), Prairies and Quebec and Ontario.
- British Columbia: Agassiz; Summerland
- Alberta: Lacombe, Lethbridge, Calgary, Edmonton
- Saskatchewan: Saskatoon; Swift Current, Regina
- Manitoba: Brandon, Morden, Winnipeg
- Ontario: Harrow, London, Guelph, Jerseyville, Ottawa
- Quebec: Saint-Jean-sur-Richelieu, Sherbrooke, Saint-Hyacinthe, Montréal, Québec
- New Brunswick: Fredericton, Moncton
- Nova Scotia: Kentville, Truro, Halifax
- Prince Edward Island: Charlottetown
- Newfoundland and Labrador: St. John's
Improving food systems through the food policy for Canada
Advance the Food Policy by coordinating efforts across the food system to improve social, health, environmental, and economic food-related outcomes
Domestic and international markets
- Support sector competitiveness at home and abroad
- Increase export opportunities for the sector by maintaining and expanding access in key markets
Science and innovation
- Conduct collaborative scientific research with industry, Indigenous groups, other governments and departments, industry, academia, and international partners
- Develop new knowledge/technologies and transfer them to the sector
- Work with industry and other partners to strengthen the sector’s capacity to develop and adopt innovative practices, products and processes
- Enhance environmental performance and sector resiliency to the effects brought on by climate change
Sector risk
- Work to mitigate production risks, environmental impacts, and financial/market issues
- Support the sector to develop systems, standards and tools to manage risks
Portfolio partners
The Minister of Agriculture and Agri- Food is responsible for all organizations in the Agriculture and Agri-Food Portfolio.
- Canadian Dairy Commission
- Canadian Grain Commission
- Farm Credit Canada
- Farm Products Council of Canada
- Canada Agricultural Review Tribunal
While not part of the portfolio, the Minister of Agriculture and Agri-Food is responsible for the Canadian Food Inspection Agency’s non-food safety activities, including economic and trade issues, and protecting consumer, animal, and plant health.
Program snapshot
Sustainable Canadian Agricultural Partnership programming (2023-2028)
The Sustainable Canadian Agricultural Partnership (Sustainable CAP) is a $3.5 Billion investment including:
- $1 Billion in federal programs and activities
- $2.5 Billion in cost-shared programs and activities by federal, provincial and territorial governments (FPT)
Federal only programs | $1 billion (5 year)
Science, research and innovation
- AgriScience | $325 million (5 Year)
Supports leading-edge innovation, discovery and applied science- AgriScience Projects
Support to short- term projects - AgriScience Clusters
Partnerships to address priorities that are national in scope
- AgriScience Projects
- AgriInnovate | $95.4 million (5 Year)
Supports the commercialization, adoption, and/or demonstration of innovative agri-based products, technologies, processes or services
Building sector capacity, growth and competitiveness
- AgriDiversity | $5 million (5 Year)
Helps underrepresented groups (e.g. Indigenous Peoples, youth, women, persons with disabilities) participate in the sector - AgriCompetitiveness | $26 million (5 Year)
Assists industry to build capacity through information-sharing activities - Regional Collaborative Partnerships Program | $3 million (5 Year)
Supports, enables and encourages provinces and territories to address shared challenges and/or priorities, and further encourages regional collaboration based on the five priority areas
Market development and trade
- AgriMarketing | $130 million (5 Year)
Helps industry increase and diversify exports
Resiliency and public trust
- AgriAssurance | $64.05 million (5 Year)
Supports industry systems, standards and tools related to the health and safety of Canadian agri-food products, and how they are produced
FPT cost-shared programs | $2.5B (5 year)
Programs designed and delivered by provinces and territories tailored to meet region-specific needs, costs are shared 60% ($1.5B) by the federal government and 40% ($1B) by provincial/territorial governments
- New: Resilient Agricultural Landscape Program | $250 million (5 Year)
FPT program focusing on the adoption of on-farm land use and management practices that prioritize climate resilience, increase biodiversity and soil/water conservation, and complements activities that reduce greenhouse gas emissions
Business Risk Management programs (BRM)
Funding fluctuates with annual average of $1.7B in payments
In addition to $3.5B under Sustainable CAP, BRM programs provide agricultural producers with protection against income and production losses, helping to manage risks.
- AgriInvest
Offers cash flow to help producers manage income declines - AgriRecovery Framework
Delivers disaster recovery relief following natural disaster events - AgriInsurance
Offers cost-shared insurance against natural hazards to reduce the financial impact of production or asset losses - AgriStability
Provides support when producers experience a large margin decline
Canadian Agricultural Partnership programming (2018-2023)
The Canadian Agricultural Partnership (CAP) is a $3-billion investment including:
- $1 billion in federal programs and activities
- $2 billion in cost-shared programs and activities by federal, provincial and territorial governments (FPT)
Federal only programs | $1B (5 Year)
Growing trade and expanding markets
- AgriMarketing | $121 million (5 Year)
Helps industry increase and diversify exports - AgriCompetitiveness | $20.5 million (5 Year)
Assists industry to build capacity through information-sharing activities
Innovative and sustainable growth of the sector
- AgriInnovate | $128 million (5 Year)
Supports the commercialization, adoption, and/or demonstration of innovative agri-based products, technologies, processes or services - Regional Collaborative Partnerships Program | $3 million (5 Year)
Supports, enables and encourages provinces and territories to address shared challenges and/or priorities, and further encourages regional collaboration based on the six priority areas - AgriScience | $338 million (5 Year)
Supports leading-edge innovation, discovery and applied science- AgriScience Projects
Support to short- term projects - AgriScience Clusters
- Partnerships to address priorities that are national in scope
- AgriScience Projects
Supporting diversity and a dynamic, evolving sector
- AgriDiversity | $5 million (5 Year)
Helps underrepresented groups (e.g. Indigenous Peoples, youth, women, persons with disabilities) participate in the sector - AgriAssurance | $74 million (5 Year)
Supports industry systems, standards and tools related to the health and safety of Canadian agri-food products, and how they are produced
FPT cost-shared programs | $2B (5 Year)
Programs designed and delivered by provinces and territories tailored to meet region-specific needs, costs are shared 60% ($1.2B) by the federal government and 40% ($800 million) by provincial/territorial governments
Business Risk Management programs (BRM)
In addition to $3B under CAP, BRM programs provide agricultural producers with protection against income and production losses, helping to manage risks.
- AgriRisk | $55 million (5 Year)
Supports the development of new risk management tools
Funding fluctuates with an annual average of $1.7B in payments
- AgriInvest
Offers cash flow to help producers manage income declines - AgriRecovery Framework
Delivers disaster recovery relief following natural disaster events - AgriInsurance
Offers cost-shared insurance against natural hazards to reduce the financial impact of production or asset losses - AgriStability
Provides support when producers experience a large margin decline
Suite of AAFC programs to address business, environmental and emerging risks, and drive innovation and growth
Non-CAP risk management
- Canadian Agricultural Loans Act | $75 million (annual loan average)
Provides easier access to credit to establish, improve and develop farms, and loans to process, distribute or market the products of farming - Advance Payments Program | $2.5 billion (annual loan average)
Provides easier access to credit through cash advances to support flexible marketing decisions - Price Pooling Program | $45.9 million (annual guarantee average)
Provides a price guarantee that protects marketing agencies and producers against unanticipated declines in the market price of their products
Environmental
- Agricultural Clean Technology Program | $495.7 million (7-year program, ends March 31, 2028)
Supports research, development and adoption of clean technologies - Agricultural Climate Solutions – On-Farm Climate Action Fund | $200 million (3-year program, ends March 31, 2024)
Additional $470 million announced in Budget 2022 – Program details pending
Supports adoption of greenhouse gas reduction practices on-farm - Agricultural Climate Solutions – Living Labs Program | $185 million (10-year program, ends March 31, 2031)
Convenes stakeholders to facilitate development and application of on-farm practices with environmental benefits focused on greenhouse gas sequestration and mitigation
Supply management
- Poultry and Egg On-Farm Investment Program | $647 million (10-year program, ends March 31, 2031)
Additional $112 million announced in Fall Economic Statement 2022; Program details pending
Helps supply-managed poultry and egg producers adapt to market changes resulting from the CPTPP - Market Development Program for Turkey and Chicken | $44 million (10 -year program, ends March 31, 2031)
Helps increase domestic demand and consumption of Canadian poultry products - Dairy Direct Payment Program | $1.75 billion (4-year program, ends March 31, 2023)
Additional $1.2B announced in Fall Economic Statement 2022; Program details pending
Payments to help cow milk producers transition to new market realities from international trade agreements - Dairy Processing Investment Fund | $100 million (6-year program, ends March 31, 2023)
Provides funding to improve productivity/competitiveness in the dairy processing sector - Dairy Farm Investment Program | $250 million (6-year program, ends March 31, 2023)
Assists Canadian cow milk producers to improve productivity through upgrades to their equipment - Supply Management Processing Investment Fund | $292.5 million (6-year program, ends March 31, 2028)
Additional $105 million announced in Fall Economic Statement 2022; Program details pending
Helps processors of supply-managed commodities adapt to market changes resulting from the implementation of the CETA and the CPTPP
Innovation
- Innovative Solutions Canada | $3.9 million (annual program, ends March 31, 2023)
Federal projects to support growth of SME innovations and solutions to sector challenges (part of ISED-led +$100 million/year program) - Canadian Agricultural Strategic Priorities Program | $50.3 million (ongoing program, renews every 5 years)
Supports sector to seize opportunities, respond to emerging issues, and pilot solutions to adapt and remain competitive
Food policy
- Food Waste Reduction Challenge | $20 million (4-year program, ends March 31, 2024)
Supports solutions to food waste and loss across the supply chain, thereby reducing the associated economic, environmental and social costs of food waste - Local Food Infrastructure Fund | $60 million (5-year program, ends March 31, 2024)
Aims to strengthen food systems and facilitate access to safe/nutritious food for communities - AgriCommunication Program | $8 million (3-year program, ends March 31, 2024)
Federal initiative supporting activities which increase appreciation and pride in the contributions of farmers and the food industry and enhance public trust
Other
- Indigenous Agriculture and Food Systems Initiative | $8.5 million (5-year program, ends March 31, 2023)
Builds capacity for Indigenous Peoples to participate in the agriculture and agri-food sector. Part of the Indigenous Services Canada Strategic Partnerships Initiative. - Youth Employment and Skills Program | $1.2 million (annual program)
Additional funding of $12.3 million will be provided for 2023-24 and 2024-25
Funds agricultural work internships for youth and youth facing barriers - International Collaboration Program | $1.2 million (annual program)
Supports a range of international memberships and projects aimed at advancing AAFC’s International Strategy - Wine Sector Support Program | $166 million (2-year program, ends March 31, 2024)
Short-term support to licensed Canadian wineries to adapt to challenges impacting financial resilience and competitiveness - African Swine Fever Industry Preparedness Program| $23.4 million (2-year program, ends March 31, 2024)
Helps the pork sector prevent and prepare for potential outbreak of African Swine Fever - Farm Debt Mediation Service
Offers free financial counselling and mediation services to farmers who are having difficulties meeting their financial obligations
COVID-19 response programming
- Emergency On-Farm Support Fund | $40.3 million (ended March 31, 2021)
Helped producers cover some of the additional costs of keeping farm workers safe from COVID-19 - Emergency Processing Fund | $87.5 million (ended Spring 2021)
Helps companies implement changes to protect workers due to the COVID-19 pandemic and make investments needed to increase Canada’s food supply capacity - Mandatory Isolation Support for Temporary Foreign Workers (TFW) Program | $142 million (ended August 31, 2021)
- 14-Day Isolation Support
Assisted with some costs associated with TFW mandatory isolation under the Quarantine Act - 3-Day Hotel Quarantine Support
Assisted with some of the costs associated with TFW 3-day hotel quarantine imposed under the Quarantine Act
- 14-Day Isolation Support
- Surplus Food Rescue Program | $50 million (ended December 31, 2021)
Helped organizations distribute otherwise destroyed surplus food to populations in need - Emergency Food Security Fund | $330 million (ended March 31, 2022)
Supports access to food for food insecure Canadians due to the COVID-19 pandemic - AgriRecovery Framework (under CAP) | $125 million (ended March 31, 2022)
Provides assistance to help producers with the extraordinary costs incurred as a result of the pandemic