
Combined Evaluation Report
The evaluation was approved by the Deputy Minister in March 2017.
Agriculture and Agri-food Canada
List of acronyms
- AAFC
- Agriculture and Agri-Food Canada
- ADM
- Assistant Deputy Minister
- AMPA
- Agricultural Marketing Programs Act
- ANS
- Allowable Net Sales
- APP
- Advanced Payments Program
- ASRA
- Assurance Stabilisation des Revenues Agricoles
- BRM
- Business Risk Management
- CAIS
- Canadian Agricultural Income Stabilization
- CALA
- Canadian Agricultural Loans Act
- CANSIM
- Canadian Socio-Economic Information Management System
- FIPA
- Farm Income Protection Act
- FPT
- Federal/Provincial/Territorial
- FTE
- Full Time Equivalents
- GDP
- Gross Domestic Product
- GF
- Growing Forward
- GF2
- Growing Forward 2
- NCI
- Net Cash Income
- NOI
- Net Operating Income
- NPAC
- National Program Advisory Committee
- NPF
- Next Policy Framework
- OAE
- Office of Audit and Evaluation
- OECD
- Organisation of Economic Cooperation and Development
- PMS
- Performance Measurement Strategy
- PT
- Provincial/Territorial
- RAD
- Research and Analysis Directorate
- RML
- Reference Margin Limit
- RMP
- Risk Management Program
- SDRM
- Self-Directed Risk Management
- TAP
- Targeted Advanced Payment
- WLPIP
- Western Livestock Price Insurance Program
Executive summary
Purpose of the evaluation
The purpose of the evaluation was to examine the relevance and performance of AgriStability, AgriInvest, AgriInsurance and the Wildlife Compensation Program. These programs are offered under the Business Risk Management (BRM) suite of programs as part of Growing Forward 2 (GF2), AAFC’s five-year (2013/14-2017/18) Federal/Provincial/Territorial (FPT) Multilateral Framework Agreement for Canada's agricultural and agri-food sector.
The evaluation was conducted by the Office of Audit and Evaluation (OAE) in accordance with the Treasury Board Policy on Results (2016). The results are intended to inform planning for the next phase of policy and program development under Next Policy Framework (NPF) beginning 2018/19, the next multilateral framework agreement for agriculture.
Background
The BRM suite of programs is designed to support GF2 objectives by helping farmers manage risk due to severe market volatility and disaster situations. Within the suite are four core BRM programs: AgriStability, AgriInvest, AgriInsurance and AgriRecovery. Other BRM programs outside the core suite include the Wildlife Compensation Program, AgriRisk Initiatives Program, loan guarantees under the Canadian Agricultural Loans Act (CALA), the Advance Payments Program (APP) delivered under the authority of the Agricultural Marketing Programs Act (AMPA), and the supply-management of a number of commodities.Footnote 1
AgriStability is a margin-based program that covers large income declines in a producer’s farm income relative to previous years. AgriInvest is a self-managed savings account into which a producer deposits funds and receives matching government contributions. AgriInsurance is a cost-shared production insurance program designed to reduce the economic effects of production losses caused by severe but uncontrollable natural hazards such as drought, flood, wind, frost, hail or snow, or losses resulting from uncontrollable diseases and insect infestations.
The Wildlife Compensation Program is a separate program from AgriInsurance but is also legislated under the Farm Income Protection Act (FIPA).Footnote 2 The Wildlife Compensation Program compensates producers for losses caused by wildlife either because producers are restricted from taking direct action against wildlife as a result of federal government regulation, or because there are no effective mitigation and prevention measures available to eliminate the losses. Producers are not required to participate in AgriInsurance to be eligible for the Wildlife Compensation Program and do not have to pay premiums or administration fees. Both crops and livestock are eligible for compensation under the Program.
The four programs (AgriStability, AgriInvest, AgriInsurance and the Wildlife Compensation Program) are delivered through a mix of federal and provincial government administrations. Government contributions and costs to administer the programs are cost-shared by the federal government and provinces on a 60:40 basis. As the four programs are demand-driven, program expenditures fluctuate from year to year and payments to producers are based on program agreements. AgriStability payments fluctuate in accordance with program participation and industry conditions, increasing during sector downturns; AgriInvest payments are directly related to participation and allowable farm sales and purchases; AgriInsurance costs fluctuate based on commodity values and the number of acres insured; and Wildlife Compensation Program payments vary based on the number and value of claims. For the period from 2013/14 to 2017/18, the AgriStability budget is $1.43 billion, the AgriInvest budget is $0.81 billion, and the AgriInsurance budget is $3.23 billion, including the costs of the Wildlife Compensation Program.Footnote 3
Methodology
The evaluation was national in scope and covered the period from 2013/14 to 2016/17. It focused on understanding the effects of the changes made to the programs for GF2, both in terms of the programs meeting their objectives and also their administrative efficiency and economy.
The evaluation employed a summative, non-experimental design and gathered quantitative and qualitative data from the following lines of evidence:
- Document and literature review;
- BRM survey of a representative sample of 2,081 agricultural producers throughout Canada and from each commodity group;
- Interviews with 56 key informants including AAFC staff, provincial government representatives, agricultural industry associations and other stakeholders;
- Secondary data analysis which included analysis of various program databases maintained by AAFC; and
- Case studies of the following five sectors: hog, cattle, grains and oilseeds, supply managed commodities, and fruits and nuts.
Key findings and conclusions
The key findings and conclusions resulting from the evaluation are as follows:
Relevance
The Canadian agriculture sector has experienced positive growth on average over the past decade. Recent strong market conditions and high commodity prices led to significant growth in market revenues and profitability, particularly since 2013. Specifically:
- Total agricultural market receipts in Canada increased by over $26 billion between 2004 and 2015, growing from $31.5 billion to $57.6 billion;
- The overall profitability of Canadian farm operations (measured as total net operating income) more than doubled from $5.8 billion in 2004 to $15.2 billion in 2015 and the average net operating income per farmer more than doubled from $28,784 to $78,795; and
- The overall operating profit ratio (measured as net operating income as a percentage of operating revenues) also grew from 14 to 18 percent for an average farm-level.
While the Canadian agriculture and agri-food sector has performed very well in recent years, there is a continued need for the BRM programming as many of the risks that can threaten the viability of a farm operation or commodity group are ongoing or cyclical and beyond producers’ control. These risks include:
- Production risks (for example, weather, disease, and pests);
- Market and price risks (for example, changes in market prices due to supply and demand fluctuations, international competition, exchange rates, tariff barriers, and input price volatility);
- Business risks (for example, access to credit, inadequate cash flow, fluctuating interest and exchange rates); and
- Policy risks (for example, trade agreements, environmental and food safety regulations, and border closures).
Private sector and producer-led tools and support mechanisms are insufficient in managing these risks. No private insurers or other institutions are currently involved in the delivery of multi-peril production insurance in Canada. Only a few private insurance products for livestock/animal diseases have been developed due to a lack of significant demand for coverage on the part of producers and an overall lack of industry capacity for developing these tools. To address this, the AgriRisk Initiatives Program supports the research and development, as well as the capacity building, of private risk management products and services for the sector.
The appropriate role of the BRM programming is to protect producers against market volatility and disasters and to encourage producers and the private sector to develop tools and strategies to manage normal business risk. This is in line with best practices identified by the Organisation for Economic Co-operation and Development (OECD) and trends in government agricultural support in the United States, Australia and the European Union.
AgriInsurance, AgriStability and AgriInvest are aligned with federal roles and responsibilities legislated in FIPA. The Wildlife Compensation Program is somewhat aligned with federal responsibilities as there is a weak policy rationale for providing compensation for damages caused by non-federally protected species. AgriInvest and the Wildlife Compensation Program are less aligned with GF2 priorities and BRM principles due to their design as entitlement programs that primarily cover or compensate for normal business risks. There is evidence that some AgriInsurance products also cover some normal business risk. A 2011 OECD review of the AgriInsurance program in Canada found that crop insurance policies with deductibles of 10 percent trigger indemnities when yields are reduced below 90 percent of historical averages once every three years for the median farmer in Canada. The OECD review states that, at this frequency, these policies can be considered to cover frequently occurring losses due to normal variations in production.
Performance (effectiveness)
The evaluation findings and conclusions with regard to the effectiveness of each of the four programs evaluated are as follows:
- AgriInsurance
AgriInsurance is very effective in mitigating the financial impact of production losses for producers of eligible commodities. Participation has remained very high during Growing Forward (GF) and GF2, and producers are satisfied with the program overall. A large majority of agricultural commodities are eligible for insurance and program coverage has remained at approximately 75 percent from 2007/08 to 2014/15. The indemnities (compensation) paid have had a significant impact in mitigating the financial impact of production losses for producers of eligible commodities.
AgriInsurance is meeting most of its performance targets. The value of agricultural products eligible for AgriInsurance compared to the value of all agricultural products produced in Canada was 88 percent in 2013/14 and 87 percent in 2014/15 (target of 85%). The value of insured crop production compared to total production value was 16 percent for forage (target of 20%) and 76 percent for all other products (target of 75%). Low forage uptake has occurred because most cattle producers prefer to manage their feed risks on-farm rather than obtain insurance. Examples of on-farm management options of cattle producers include over-production and build-up of reserves; growth of annual crops (such as, greenfeed) to substitute for hay and pasture; purchase of feed from neighbors; and management of herd size relative to feed production. A federal/provincial/territorial task team has been assembled to identify options in forage insurance that could lead to increased uptake.
Other than forage insurance, AgriInsurance plans have not been developed and implemented for the cattle and hog sectors. Some progress has been made to implement a previous evaluation recommendation for AAFC to continue working with industry to develop livestock insurance plans where appropriate, and to explore the viability of alternatives outside of AgriInsurance. Using AgriRisk Initiatives, price insurance for cattle and hogs has been provided through a pilot of the Western Livestock Price Insurance Program (WLPIP). As WLPIP is not considered production insurance, it is therefore not under the AgriInsurance umbrella. However, WLPIP does appear to be a good example of an insurance program that allows producers to manage risks through premiums that are fully producer-paid and not subsidized by governments. Production insurance plans for hogs were investigated by an industry/government hog mortality task team; however, provinces are still considering the development of a product.
The value of agricultural production insured doubled from $7.27 billion in 2004/05 to $14.87 billion in 2014/15 as a result of increases in commodity prices, an ongoing transition to higher value crops and increases in insured acreage. Consequently, total AgriInsurance premiums paid by the federal and provincial governments almost doubled from $565.7 million in 2007/08 to $924.3 million in 2014/15.
- Wildlife Compensation Program
The Wildlife Compensation Program is effective in providing financial assistance for production losses due to wildlife damage to crops and predation of livestock. During the first two years of GF2 (2013/14 and 2014/15), an average of 11,362 claims have resulted in an average of $20 million in compensation paid to producers each year. Between 2010/11 and 2014/15, approximately 82 percent of the total compensation paid to producers was for damages to crops and 18 percent was for predation of livestock.
There is insufficient evidence as to whether producers who receive compensation make efforts to prevent a recurrence of losses. While each province that administers the Program has a requirement for producers to take mitigation measures and/or adopt best practices, the extent to which these are enforced is unknown. Requests to provincial governments for evidence regarding the types of prevention and mitigation efforts taken by producers to prevent recurring losses were not fulfilled during the evaluation.
In most provinces, the Wildlife Compensation Program has expanded beyond its original policy rationale to compensate for damages caused by federally protected waterfowl species and has no direct linkages to AgriInsurance. Québec is the only province that exclusively compensates producers for damages resulting from federally protected species, as originally intended, and damages from other wildlife species are only compensated as insurable perils under AgriInsurance. In all other participating provinces, the Program covers other non-federally protected wildlife species.
- AgriStability
Due to the nature of the program administration and timing of program payments, the most recent AgriStability data available for most performance indicators was for the 2013 program year, which limited the assessment to only one year of data regarding the changes made as a result of GF2. More years of program data are required to undertake a comprehensive assessment of the effectiveness of the program and the impact of the changes made in GF2 to the AgriStability program.
A majority (64%) of BRM participants surveyed who received AgriStability payments between 2013 and 2015 reported that the payments are effective in helping them recover their income losses. Surveyed participants most frequently identified the primary benefits of the program as the ability to manage income losses and to even out income flow, the mitigation of impacts beyond their control, and the provision of a safety net.
Even though AgriStability did not meet all its performance targets, related payments have been effective in mitigating the financial impacts of large short-term income losses as evidenced by the BRM survey result. The declining participation has limited the number of AgriStability beneficiaries while the number and value of payments have been further reduced by the GF2 changes. The number of producers participating in AgriStability has consistently declined over the past seven years, and has exceeded the decline in the number of farms in the industry. Under GF, the participation rate declined from 57 percent of producers in the 2007 program year to 43 percent in 2012, missing the performance target of 55 percent of producers participating in AgriStability. Under GF2, the participation rate further declined to 37 percent in 2013 and 33 percent in 2014, significantly below than the target of 50 percent. While declining participation has been consistent across all commodity groups, cattle producers have seen the most significant decline from 59 percent in 2007 to 34 percent in 2013. As of 2013, AgriStability program participation rates were highest among hog (75%), fruit, vegetable and potato (49%) and grains and oilseeds (48%) producers and lowest among producers of supply managed commodities (27%) and cattle (34%). Key informants attribute the decline in participation to the program’s complexity in how it functions, lack of transparency and predictability, lack of timeliness, the strength of recent prices/market conditions and GF2 changes to reduce coverage.
The participation rate in AgriStability, when measured as the percentage of market revenues covered by AgriStability participants, has not declined as dramatically (such as, from 75% in 2007 to 63% in 2013 and 55% in 2014) as the proportion of producers participating in the program. This can be explained by the fact that a higher proportion of larger producers participate in AgriStability compared to the proportion of smaller producers that participate in the program. The decrease in participation rate and coverage of the AgriStability program exposes the industry to more risk of significant losses and increases the potential demand for ad-hoc support.
- AgriInvest
AgriInvest is somewhat effective in affording producers greater flexibility in managing financial risks and increasing producers’ capacity to deal with income losses. Participation and coverage of total market sales of AgriInvest participants are high and producers are setting aside funds. In 2013, 73 percent of producers participated in the program and 89 percent of all allowable market sales were covered. Account balances have grown to approximately $2 billion but are beginning to level out due to an increase in withdrawals and reduced contributions as a result of GF2 program changes, namely the reduced government contribution.
The program is considered by participants and key informants to be a somewhat effective tool for managing financial risk. Surveyed participants reported using the funds for cash flow (51%), farm related expenses (28%), to offset a decline in income (24%), to make on-farm investments (24%) or reduce debts (22%). Producers indicated that the main benefits of AgriInvest are the ability to manage income losses (40%), increase savings (36%), manage cash flow (35%), and make on-farm investments (21%).
Many key informants, including producer association representatives, indicated that with a limit of $15,000, the AgriInvest matching contribution is not large enough to support a significant risk management investment or address an income loss as intended, especially given the increasing dominance of the agriculture sector by large farms and the fact that the majority of the $2 billion in AgriInvest account balances are held by large producers. Between 2008/09 and 2013/14, over one half (58%) of AgriInvest contributions were made by producers with sales revenues greater than $500,000 while producers with less than $100,000 in revenues accounted for only eight percent of total contributions.
Because the AgriInvest program guidelines do not stipulate that the funds withdrawn must be used to offset income losses, it is difficult to ensure that these funds are being used to manage financial risks and deal with income losses. The percentage of AgriStability participants that received an AgriStability payment and also made an AgriInvest withdrawal averaged 42 percent during GF and 44 percent during GF2, well below the performance target of 60 percent. Given strong market conditions and profitability in recent years, AgriInvest’s effectiveness in helping producers manage financial risks has not been tested.
Performance (efficiency and economy)
The evaluation findings and conclusions with regard to the economy and efficiency in which the four programs are delivered are as follows:
- AgriInsurance
AgriInsurance is delivered efficiently and economically compared to other production insurance programs in other countries. However, increases in administrative costs combined with a decline in the number of insured contracts have resulted in a 23 percent increase in the administrative cost per contract, from $397 in 2010/11 to $487 in 2014/15. In recent years, AAFC has devoted efforts to control cost increases (for example, by examining the potential for sharing of IT development costs by provincial production insurance programs). - Wildlife Compensation Program
The administrative costs per claim of the Wildlife Compensation Program are high due to the cost of the on-farm inspection needed to comply with the federal requirement for evidence of loss. The administrative costs as a proportion of program funding are higher for the Wildlife Compensation Program than the other programs evaluated due to the preponderance of small claims. Approximately 38 percent (23,564) of the claims paid from 2010/11 to 2014/15 were for less than $500. For most of these claims, the administrative cost is equal to or greater than the claim amount, considering that the average administrative cost per claim is $405. - AgriStability
For the most part, AgriStability is delivered as efficiently and economically as possible, given the administrative complexity of the program. The 22 percent decline in the number of AgriStability applications that occurred between 2010/11 and 2014/15 fiscal years led to a 13 percent reduction in total administrative costs from $90.3 million to $78.4 million. However, due to the resulting losses of economies of scale, the administrative cost per application increased 11 percent from $918 in 2010/11 to $1,022 in 2014/15. Because program administrative processes have not yet been adjusted sufficiently to reflect the transition from an income support program to assisting producers in dealing with market volatility and disaster events beyond their control, the reduction in the number and value of payments as a result of declining participation and GF2 program changes have led to a 42 percent increase in administrative costs as a percentage of payments to producers. While there exist some opportunities to share best practices across jurisdictions, significant gains in efficiency would require making the program administratively less complex in line with its new focus. However, the scope of the evaluation did not include an assessment of any such program design options to streamline AgriStability. AgriInvest
AgriInvest is delivered efficiently as a result of its simple design and highly streamlined and automated delivery. While the program administration is efficient, AgriInvest’s cost-effectiveness is impeded by the high proportion of participants that make very small contributions, resulting in comparatively high administrative costs for limited program benefits for small producers.Contributions ranging from $75 to $1,000 accounted for about one half (47%) of the total number of contributions processed in 2014/15. As the average administrative cost to process an AgriInvest contribution was $107 in 2014/15, many of these deposits are too small to justify the administrative expenditure to process and pay the government contribution. The ratio of administrative costs to process an AgriInvest contribution compared to the average amount of an AgriInvest contribution is approximately 25 percent for the 44,328 (47%) contributions that are less than $1,000.
The current minimum contribution for AgriInvest is $75. As a comparison, a minimum contribution value of $1,000 has been used by a similar program in Australia (such as, Farm Management Deposit Scheme) to reduce administrative costs. While some administrative cost savings could be obtained by increasing the AgriInvest minimum contribution, thereby reducing the number of AgriInvest contributions required by AAFC each year, the administrative savings would not likely be proportional to the reduction in number of applications processed, due to the highly automated nature of application processing.
Recommendations
The key issues and recommendations resulting from the evaluation findings are as follows:
AgriInsurance
- Issue #1:
In response to OECD-identified best practices in government agricultural support and the sector’s increased capacity for managing normal business risk, GF2 objectives were revised to target government support to more severe and catastrophic losses and encourage producers to manage normal business risks. As identified in the 2011 OECD thematic review of Canadian risk management and AAFC’s internal review of AgriInsurance risk coverage, some AgriInsurance products are covering some normal business risk.- Recommendation #1:
AAFC should work with the provinces to examine options to modify products identified as covering normal business risk to transfer greater responsibility to producers and better align the coverage levels provided by AgriInsurance with current GF2 objectives and BRM principles.
- Recommendation #1:
- Issue #2:
As a result of recent increases in commodity prices, an ongoing transition to higher value crops and increases in insured acreage, the total AgriInsurance premiums paid by the federal and provincial governments almost doubled from $565.7 million in 2007/08 to $924 million in 2014/15. While AgriInsurance is for the most part delivered efficiently and economically, increases in administrative costs combined with a decline in the number of insured contracts, resulted in a 23 percent increase in the administrative cost per insurance contract over the last five years.- Recommendation #2:
While some efforts to control costs have been undertaken, AAFC should work with the provinces to identify additional cost-control mechanisms to prevent significant increases in AgriInsurance administrative costs as well as in government premiums should commodity prices and the total value of agricultural production insured continue to increase.
- Recommendation #2:
- Issue #3:
There are limitations with the current AgriInsurance performance indicators for efficiency. As an illustration, one indicator is program administrative expenses as a percentage of total premiums. Because premiums have increased considerably in recent years due to increased commodity prices, this performance indicator shows a decrease in administration costs as a percentage of premiums which does not reflect changes in AgriInsurance administrative costs.- Recommendation #3:
AAFC should work with the provinces to refine the performance measures used to assess the efficiency and economy of the administrative costs to deliver AgriInsurance.
- Recommendation #3:
Wildlife Compensation Program
- Issue #4:
The administrative costs per claim of the Wildlife Compensation Program are high due to the cost of the on-farm inspection needed to comply with the federal requirement for evidence of loss. Due to the preponderance of small claims, administration costs as a proportion of program funding are higher for the Wildlife Compensation Program than the other programs evaluated.- Recommendation #4:
AAFC should work with the provinces to reduce administrative costs by adopting a minimum claim amount (for example, $1,000) or charging an application processing fee. Additional opportunities to save on administrative costs should be investigated including reducing federal requirements for on-farm inspection and verification of loss, eliminating payments for recurrent losses, pooling of small claims until they reach the minimum amount, and promoting initiatives to enhance producer preventative efforts to reduce or eliminate the need for compensation.
- Recommendation #4:
- Issue #5:
The Wildlife Compensation Program has expanded beyond its original policy rationale to only compensate for federally protected waterfowl species and has no direct linkages to AgriInsurance outside of Québec. Québec is the only province that exclusively compensates producers for damages resulting from federally protected species, as originally intended, while damages from other wildlife species are compensated as insurable perils under AgriInsurance. In all other participating provinces, the Wildlife Compensation Program covers federally protected waterfowl species as well as a wide variety of non-federally protected wildlife species.- Recommendation #5:
AAFC should work with the provinces to continue to investigate the feasibility of including wildlife damages as an insurable peril under AgriInsurance and restricting eligible wildlife to those species protected under federal legislation to better align with government mandates and responsibilities.
- Recommendation #5:
AgriStability
- Issue #6:
AgriStability’s design, which includes the calculation of payments based on individual farm finances, requires a very extensive set of benchmarks and indicators that impedes the program’s administrative efficiency, timeliness and transparency. Due to the transition from an income support program to assisting producers in dealing with market volatility and disasters in GF2, the number and value of AgriStability payments to producers has decreased in 2013 and will likely continue at this level in subsequent years. However, the administrative costs to process the AgriStability applications have not been reduced proportionately because similar program delivery processes are still being employed. Consequently, administrative costs as a percentage to the payments to producers have increased from 15 percent in 2010/11 to 21 percent in 2014/15. While there appear to exist opportunities to reduce administrative costs by streamlining existing processes and sharing best practices across the provinces, significant gains in efficiency would require a major change in the design of the program or administrative approach to reduce administrative complexity and costs in line with its new focus under GF2.- Recommendation #6:
AAFC should work with the provinces to examine options to reduce AgriStability complexity and, in turn, decrease administrative costs. This will require a re-design of the program to reflect the transition from an income support program to providing producers assistance under severe situations. This could potentially decrease the frequency and amount of information that must be collected from producers as well as reduce program administrative costs.
- Recommendation #6:
- Issue #7:
The number of producers participating in AgriStability has consistently declined over the past seven years from 57 percent in the 2007 program year to 33 percent in 2014. However, the percentage of market revenues covered by AgriStability participants (another measure of participation rate) has not declined as dramatically (such as, from 75% in 2007 to 55% in 2014) as a result of high participation rates among large producers. The decrease in participation rate and coverage of the AgriStability program exposes the industry to more risk and increases the potential demand for ad hoc support. Producer participation is expected to remain low (as forecast by AAFC and provincial Ministries of Agriculture) if significant steps are not taken to make the program more predictable and less complex, expensive and cumbersome to apply.- Recommendation #7:
AAFC and the provinces should monitor the participation rate of producers in AgriStability to ensure that the program provides coverage to producers in need to avert the need for ad-hoc programming and payments. Analysis should be undertaken to determine what participation rate would assure a meaningful coverage for the industry, and strategies to facilitate a sufficient number of producers participating in the program should be developed.
- Recommendation #7:
AgriInvest
- Issue #8:
AgriInvest contributions are based on one percent of a producer’s allowable net sales rather than an income loss. Because AgriInvest is an entitlement program that primarily covers or compensates producers for normal business risks, it is not well aligned with GF2 objectives and demand-driven BRM programming that are based on need. In recent years, approximately $260 million in government contributions per year have been deposited in AgriInvest savings accounts despite account balances of about $2 billion in 2014/15 and reduced need as a result of strong market conditions, record profitability, low interest rates and positive farm financial conditions.- Recommendation #8:
AAFC should work with the provinces to clarify AgriInvest objectives and linkages within the context of the BRM suite of programs. The assessment should inform AAFC and the provinces regarding program design options to support flexibility in risk management while strengthening the program’s linkages to GF2 priorities and BRM principles. For example, a potential role of AgriInvest could be to offset a decline in coverage by AgriStability. An option to be explored is to clarify and exercise the cross compliance clause in the GF2 FPT Multilateral Framework Agreement in conjunction with the provinces to implement conditions for producer participation in AgriInvest.
- Recommendation #8:
- Issue #9:
Many AgriInvest producer deposits are too small to justify the $107 average administrative expenditure to process and pay the matching government contribution. In 2014/15, contributions ranging from $75 to $1,000 accounted for approximately one half (47%) of the total number of contributions processed while contributions less than $500 accounted for about 30 percent. The ratio of administrative costs to process an AgriInvest contribution compared to the average amount of an AgriInvest contribution was approximately 41 percent for contributions less than $500. Due to the high ratio of administrative costs to AgriInvest contribution for these smaller amounts, savings in administration costs could be obtained by increasing the minimum contribution amount of $75 and/or producers share in the program administration costs. As a comparison, a similar program in Australia uses a minimum contribution of $1,000. To address the concern that smaller producers would not be able to participate if the minimum contribution were increased, some options could be considered such as allowing a producer to pool revenues for several years until they are sufficient to allow participation in the AgriInvest program or to develop a tax credit program which can more efficiently address small contributions.- Recommendation #9:
AAFC should work with the provinces to increase the minimum contribution that will justify the administrative expenses to process the AgriInvest contribution and/or producers share in the program administration costs.
- Recommendation #9:
1.0 Introduction
The Office of Audit and Evaluation (OAE) conducted an evaluation of AgriStability, AgriInvest, AgriInsurance and Wildlife Compensation Programs. These programs are offered under the Business Risk Management (BRM) suite of programs as part of Growing Forward 2 (GF2), AAFC’s five-year (2013/14-2017/18) Federal/Provincial/Territorial (FPT) Multilateral Framework Agreement for Canada's agricultural and agri-food sector. The evaluation fulfills a requirement and commitment under AAFC’s Five-Year Departmental Evaluation Plan and the Financial Administration Act. With the GF2 policy framework expiring at the end of 2017/18, the results are intended to inform planning for the next phase of policy and program development under the next multilateral framework agreement for agriculture, Next Policy Framework (NPF), after GF2 ends.
As the four programs have common BRM objectives and are designed with numerous linkages to provide a complementary suite of programming, the programs were evaluated together. Other BRM programs were subject to separate evaluations but are included in the BRM suite of programming:
- AgriRecovery was evaluated in 2015/16;
- The Advanced Payments Program was evaluated in 2015/16; and
- The Canadian Agricultural Loans Act Program was evaluated in 2013/14.
1.1 Evaluation scope
The evaluation was conducted in accordance with the Treasury Board Policy on Results (2016). As per the Directive on Results, the evaluation assessed the relevance and performance of the following programs: AgriStability, AgriInvest, AgriInsurance and the Wildlife Compensation Program. Specifically, the evaluation examined the following: continued need for the programs; alignment with government priorities, departmental strategic outcomes, and federal roles and responsibilities; achievement of intended outcomes; and the extent to which the programs demonstrate efficiency and economy.
The evaluation was national in scope and covered the period from 2013/14 to 2015/16. Data collection started in January 2016 and concluded in July 2016. It focused on understanding the effects of the changes made to the programs for GF2, both in terms of the programs meeting their objectives and also their administrative efficiency and economy. Some other objectives of the evaluation were to determine what have been the short and long-term economic outcomes associated with these programs, and how they have contributed to the adaptability of the agricultural sector.
1.2 Evaluation approach
The evaluation was conducted by the AAFC Office of Audit and Evaluation (OAE). It employed a summative, non-experimental design and incorporated both primary and secondary data. Multiple lines of evidence were used to address evaluation issues and questions that were developed in collaboration with program managers.
1.3 Methodology
The evaluation consisted of the following lines of evidence:
- A document and literature review was conducted to gather information relevant to the evaluation questions and issues of relevance, effectiveness and efficiency. The review examined foundational documents on policy rationale and the design and operation of the programs; program documents on performance and accomplishments; federal policies, branch and departmental documents and reports; and peer reviewed articles as well as other relevant literature. A complete list of documents and literature reviewed can be found in Annex B.
- A BRM survey of producers was conducted between February and March 2016 and included data on 2,081 producers across Canada which was obtained through a random sampling of Canadian producers. The survey was conducted jointly by OAE and the BRM Programs Directorate.
- An analysis of secondary data was undertaken which included the following: Farm Income Programs Directorate program administrative and financial data; program data from the PINSS AgriInsurance database, AgriInvest National Program Database and Québec database; AgriStability National Program Database and the Wildlife Compensation Program National Program Database; and Statistics Canada Farm Financial Survey Data. The data gathered through these analyses were used to examine issues related to the relevance and effectiveness of the BRM programs.
- Semi-structured interviews with 56 key informants were conducted between February and April, 2016 to gather perspectives on the programs from key stakeholder groups. Interviewees included 11 AAFC executives, managers and staff; 23 provincial government program representatives; and 22 representatives of agricultural commodity groups, the National Program Advisory Committee (NPAC) and farm financial advisors.
- Commodity group case studies were completed to analyze differences in need across various commodity groups, the responsiveness of the programs to these needs, and how the programs impact incomes and the management of risks. Case studies were undertaken of the following five commodity groups: cattle, hogs, grains and oilseeds, supply-managed commodities and fruits and nuts. The case studies involved a document review and an analysis of secondary data on program participation and the impact of government programming on each commodity group.
1.4 Methodological considerations
The considerations or limitations to note for this evaluation are as follows:
- It was difficult to conduct a detailed assessment of the combined impact and interrelationships of BRM programs at the producer level because of the lack of an integrated database of all BRM program participants. As a result, the evaluation relied on external data at a summary level to assess the combined impact of all federal and provincial government programs on the net income of program participants.
Due to the nature of the program administration and timing of program payments, the most recent AgriStability data available for most indicators was for the 2013 program year, which limited the assessment to only one year of data regarding the changes made as a result of GF2. One year of data is not sufficient to undertake a comprehensive assessment of the impact of the changes made in GF2 to the AgriStability program.
2.0 Profile of the programs
2.1 Background
Growing Forward 2 (GF2) is the current FPT agricultural policy framework from 2013/14 to 2017/18. Under GF2, governments agreed to work together to achieve three strategic outcomes:
- A competitive and innovative sector;
- A sector that contributes to society’s priorities; and
- A sector that is proactive in managing risk.Footnote 4
The BRM suite of programs is intended to support GF2 strategic outcomes by helping farmers manage risk due to severe market volatility and disaster situations. The objectives of GF2 reflect a shift towards encouraging producers to manage more normal business risks with government support being targeted more towards severe and catastrophic losses. A market-oriented focus on adaptability and competitiveness is a new addition to intended outcomes under this framework. The BRM program suite end outcomes have been updated to reflect the objectives of competitiveness and adaptability.
GF2 includes four core BRM programs:
- AgriStability is a margin-based program that covers declines of more than 30 percent in a producer’s program margin relative to their reference margin.
- AgriInvest is a self-managed savings account into which a producer deposits funds and receives matching government contributions. The funds can be used to cover small income declines or to make investments in risk management or to help improve market income.
- AgriInsurance is a cost-shared production insurance program designed to minimize the economic effects of production losses caused by uncontrollable natural hazards (for example, drought, flood, wind, frost, hail or snow) or losses resulting from uncontrollable diseases, insect infestations and wildlife.
- AgriRecovery is a disaster-relief framework that provides a coordinated process for FPT governments to respond rapidly when disasters strike, assisting with extraordinary costs not covered by the existing programs.Footnote 5
Other BRM programs outside the core suite include the Wildlife Compensation Program, AgriRisk Initiative Program, loan guarantees under the Canadian Agricultural Loans Act, the Advance Payments Program (APP) delivered under the authority of the Agricultural Marketing Programs Act and the supply-management of a number of commodities (for example, dairy, poultry and eggs).
AgriStability and AgriInvest were implemented in 2007 to replace the Canadian Agricultural Income Stabilization (CAIS) program, which operated from 2003/04 to 2006/07 under the predecessor to Growing Forward (GF), the Agricultural Policy Framework. AgriStability and AgriInvest are governed under the provisions of Section 4(1) of the Farm Income Protection Act (FIPA), which authorizes the Minister to establish programming with the provinces to stabilize net income.
Federal support for production insurance was first formalized by the Crop Insurance Act (1959). AgriInsurance was subsequently legislated under Section 4 of FIPA, which authorizes the Minister to enter into an agreement with one or more provinces for the establishment of a crop insurance program.
The Wildlife Compensation Program, a separate program from AgriInsurance, compensates producers for losses caused by wildlife either because producers are restricted from taking direct action against wildlife as a result of federal government regulation or because there are no effective mitigation and prevention measures available to eliminate the losses. Both crops and livestock are eligible for protection under the program. Because the predecessor Waterfowl Program was included in the provinces’ crop insurance agreements under FIPA in 1991, the Program is legislated under Section 4 of FIPA. Producers are not required to participate in AgriInsurance to be eligible for the Wildlife Compensation Program and are not required to pay premiums or administration fees.
Annex B provides more details on all four programs.
3.0 Evaluation findings
3.1 Relevance
The following section outlines the key findings and conclusions resulting from the evaluation related to the relevance of, and continued need for the four programs.
3.1.1 Continued need for the programs
While the Canadian agriculture and agri-food sector has performed very well in recent years, there is a continued need for the BRM programs to help producers manage risks associated with severe market volatility and disaster situations. Many of the risks that can threaten the viability of a farm operation or commodity group are ongoing or cyclical and beyond producers’ control. On their own, private sector and producer-led tools and support mechanisms are not broad enough to manage these risks.
Current state of the agricultural sector
Over the past five years, the Canadian agriculture sector has enjoyed strong market conditions and high commodity prices, partly due to positive macroeconomic factors including the depreciation of the Canadian dollar vis-à-vis the United States dollar, which has significantly improved the competitiveness of Canadian agricultural commodities in international markets.Footnote 6 Total farm market receipts have increased by over 80 percent from $31.5 billion in 2004 to $57.6 billion in 2015. The most significant gains occurred in grains and oilseeds production, which experienced a 163 percent growth in revenues from $7.6 billion in 2004 to $20.1 billion in 2015 (Table 1). Likewise, pulse and special crop production has experienced double digit growth in five of the past 10 years.
| Year | Grains and Oilseeds | Cattle | Hog | Fruit, Vegetable and Potato | Supply Managed Commodities | Greenhouse Nursery and Floriculture |
|---|---|---|---|---|---|---|
| 2004 | $7.9 | $6.4 | $4.7 | $2.2 | $8.1 | $2.7 |
| 2005 | $7.3 | $8.2 | $4.6 | $2.2 | $8.6 | $2.9 |
| 2006 | $7.9 | $9.1 | $4.2 | $2.4 | $8.8 | $3.3 |
| 2007 | $10.9 | $9.0 | $4.1 | $2.6 | $9.4 | $3.3 |
| 2008 | $14.8 | $9.2 | $3.8 | $2.8 | $10.2 | $3.3 |
| 2009 | $15.4 | $8.4 | $3.6 | $2.9 | $10.6 | $3.3 |
| 2010 | $14.4 | $8.5 | $3.8 | $3.0 | $10.6 | $3.5 |
| 2011 | $17.4 | $9.8 | $4.5 | $3.2 | $11.1 | $3.7 |
| 2012 | $21.0 | $10.4 | $4.3 | $3.4 | $11.7 | $3.7 |
| 2013 | $23.0 | $10.1 | $4.4 | $3.6 | $12.0 | $4.0 |
| 2014 | $21.4 | $13.5 | $5.0 | $3.5 | $12.0 | $4.0 |
| % Change | 171% | 111% | 6% | 59% | 48% | 48% |
| Source: Statistics Canada CANSIM Table 002-0044 Agricultural Taxation Data (unadjusted) | ||||||
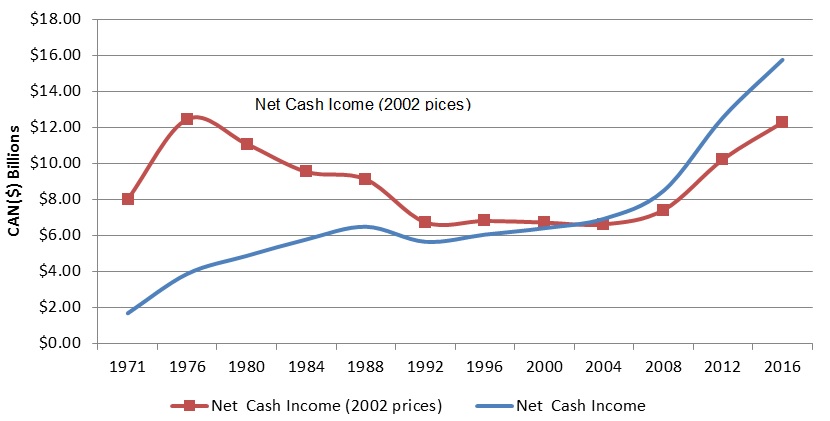
Gains in revenues have contributed to record levels of profitability of farmers. Net Cash Income (NCI), a measure of the aggregate profitability of the agriculture sector, reached a record of $15.2 billion in 2015, the highest level in real terms since the 1970s (Figure 1). Producers were protected by the rapidly depreciating Canadian dollar but this situation is not expected to continue over the short term. Net cash income is forecast to decline by two percent in 2016 and by another seven percent in 2017, led by an expected drop in commodity prices.
Description of above image
Figure 1 illustrates the historical trends for net cash income in $billions both in general and in 2002 prices for the years 1976 to 2016.
| 1971 | 1976 | 1980 | 1984 | 1988 | 1992 | 1996 | 2000 | 2004 | 2008 | 2012 | 2016 | |
|---|---|---|---|---|---|---|---|---|---|---|---|---|
| Net Cash Income | 8.02 | 12.46 | 11.08 | 9.54 | 9.12 | 6.73 | 6.81 | 6.72 | 6.62 | 7.41 | 10.23 | 12.28 |
| Net Cash Income (2002 prices) | 1.68 | 3.87 | 4.87 | 5.78 | 6.49 | 5.65 | 6.05 | 6.41 | 6.93 | 8.48 | 12.56 | 15.76 |
Source: AAFC (2016). 2016 Canadian Agricultural Outlook, Chart 3a.
Total Net Operating IncomeFootnote 8 (NOI), a measure of the profit or loss of an average farm operation, more than doubled from $5.8 billion in 2004 to $15.2 billion in 2015. The average NOI per producer grew by just over 170 percent from $28,784 in 2004 to $78,795 in 2015 and is forecasted to decline to a record high of $77,923 in 2016 and to $73,486 in 2017.Footnote 9
Net Operating Income as a percentage of total operating revenues, a measure of a farm operation’s profitability ratio, grew from 14 percent in 2004 to 18 percent in 2015 as market revenues increased faster than operating expenses. As illustrated in Figure 2, profitability ratios were highest among grains and oilseeds, supply managed commodities and fruit, vegetable and potato producers and lowest for cattle and hog producers.

Description of above image
Figure 2 illustrates the operating profit margins by major commodity from 2004 to 2014
| Year | Grains and Oilseeds | Cattle | Hogs | Fruit, Vegetable and Potato | Supply Managed Commodities | Greenhouse Nursery and Floriculture | Total |
|---|---|---|---|---|---|---|---|
| 2004 | 17.3% | 7.9% | 9.0% | 12.4% | 18.9% | 8.9% | 13.7% |
| 2005 | 15.4% | 6.8% | 11.5% | 14.2% | 20.9% | 9.2% | 13.4% |
| 2006 | 17.1% | 4.8% | 6.2% | 15.3% | 19.4% | 10.0% | 12.6% |
| 2007 | 20.5% | 5.4% | 6.5% | 15.4% | 19.1% | 8.4% | 13.8% |
| 2008 | 24.3% | 6.2% | 2.3% | 14.3% | 17.9% | 8.7% | 15.1% |
| 2009 | 24.6% | 5.0% | 2.8% | 14.1% | 17.8% | 10.8% | 15.5% |
| 2010 | 23.7% | 5.3% | 5.5% | 14.3% | 20.7% | 110% | 16.1% |
| 2011 | 27.9% | 4.9% | 5.4% | 14.9% | 21.0% | 9.6% | 17.6% |
| 2012 | 27.1% | 5.7% | 6.2% | 15.1% | 20.0% | 9.0% | 18.0% |
| 2013 | 26.4% | 4.4% | 6.0% | 15.3% | 19.8% | 11.9% | 17.8% |
| 2014 | 23.9% | 7.3% | 11.9% | 15.4% | 20.6% | 12.2% | 17.9% |
Source: Statistics Canada Agricultural Taxation Data Canadian Socio-economic Information Management Table 002 0044
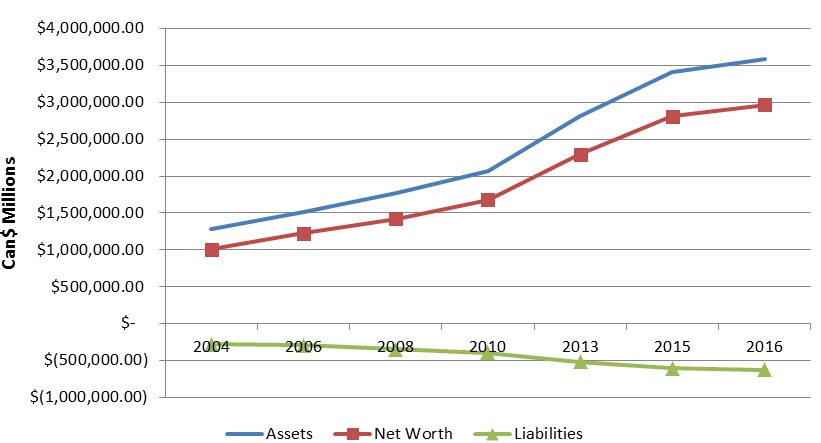
As a result of recent increased revenues and profitability, farm financial measures have been positive. Balance sheets are strong with net worth increasing year over year. In 2015, the average Canadian farm is forecasted to have $3.2 million in assets and $580 thousand in debt, for an overall net worth of $2.3 million.Footnote 10 The average net worth of a Canadian farm is forecasted to increase to $2.7 million in 2016 (Figure 3).Footnote 11
Description of above image
Figure 3 illustrates the trend in average assets, liabilities and net worth of Canadian farms in millions of dollars per year for the years 2004 to 2016
| 2004 | 2006 | 2008 | 2010 | 2012 | 2014 | 2016 | |
|---|---|---|---|---|---|---|---|
| Assets | 1,283,878 | 1,517,909 | 1,773,501 | 2,073,377 | 2,806,584 | 3,413,185 | 3,585,876 |
| Net Worth | 1,005,704 | 1,224,009 | 1,423,532 | 1,681,253 | 2,293,605 | 2,809,426 | 2,963,230 |
| Liabilities | −278,174 | −293,900 | −349,964 | −392,124 | −512,975 | −603,759 | −622,646 |
Source: AAFC (2016). 2016 Canadian Agricultural Outlook, Chart 6a.
Farmers have access to capital to meet short-term financial obligations and make investments in their farming operations. For example, in 2014/15, Farm Credit Canada approved 47,178 new loans with an average loan value of $178,825 and the Canadian Agricultural Loans Act Program approved 1,569 new loans.Footnote 12 According to the interest coverage ratio, a measure of how many times a farm could pay its current interest payment with its available earnings, the average Canadian farm operation is capable of paying its interest payments 11 times over.Footnote 13 The 2013 Farm Financial Survey reported that 83 percent of farms with revenues of $250,000 or greater, responsible for 88 percent of all agricultural sales, were under no financial stress (Figure 4).Footnote 14

Description of above image
Figure 4 illustrates the financial stress levels of farms with revenues greater than $250,000 in 2013
| Cash Flow Categories | Less than 50% | 50% to 75% | Greater than 75% | All equity |
|---|---|---|---|---|
| Less than $30,000 | 3% or 4% of total agricultural sales (significant financial stress) | 4% or 3% of total agricultural sales (significant financial stress) | 7% or 4% of total agricultural sales (moderate financial stress) | 14% or 10% of total agricultural sales |
| $30,000 to $60,000 | 1% or 1% of total agricultural sales (significant financial stress) | 2% or 1% of total agricultural sales (moderate financial stress) | 3% or 2% of total agricultural sales (no financial stress) | 6% or 4% of total agricultural sales |
| Greater than $60,000 | 6% or 11% of total agricultural sales (no financial stress) | 18% or 21% of total agricultural sales (no financial stress) | 56% or 42% of total agricultural sales (no financial stress) | 80% or 74% of total agricultural sales |
| All Cash Flow | 10% or 15% of total agricultural sales | 24% or 25% of total agricultural sales | 66% or 48% of total agricultural sales | 100% or 88% of total agricultural sales |
Source: AAFC (2016). Overview of Farm Financial Situation in Canada (2013 Farm Financial Survey, AAFC calculations)
Ongoing and cyclical risks facing the agriculture sector
Despite the strong performance of the Canadian agriculture sector in recent years, the sector continues to face a wide range of production, marketing and business risks:
- Production risks can negatively impact planting and harvesting of crops, farm yields and crop quality, and producers’ ability to raise livestock. For example, crop producers face weather-related risks associated with unseasonably cold weather, drought or excess moisture and lack of heat, as well as long-term risks associated with global warming including changing weather patterns and insect and disease ranges pushing north. Livestock producers also experience production risks through weather-related impacts on forage and pasture production and animal health risks. These major weather events and animal and plant diseases are an ever-present reality and are generally beyond the control of producers and severely impact farm production and income.
- Market and price risks can negatively impact production levels and/or profit margins. As Canada is a major exporter of many agricultural commodities, prices are determined in large part by the global market. Producers are subject to changes in market prices resulting from supply and demand fluctuations including the emergence of competition from agricultural producers in other countries and changing consumer preferences, variable transportation costs and currency exchange rates. Transportation barriers and tariff and non-tariff barriers can also have a very detrimental impact. Examples include loss of trade due to animal health risks such as foot and mouth disease and avian influenza; delayed transportation of grain to domestic and export customers or delayed transportation of perishable horticulture commodities; public resistance leading to market closures for genetically modified foods; and border/market closures due to food-borne contaminants.
- Producers face input cost volatility, due to fluctuating fuel, fertilizer, feed and labour costs and land prices.
- Business risks include insufficient access to credit and inadequate cash flow. These can force producers to market at depressed prices to make interest payments or meet operating expenses and make them particularly vulnerable to short-term income losses and market and price risks.
- Lastly, policy risks associated with changing government policies and programs and regulations are only imperfectly predictable by farmers. Examples include changing levels of coverage or support provided by government programs, and changes in environmental and food safety regulations requiring capital investments.
Many of these price and market risks are cyclical in nature and the production risks associated with weather, diseases and pests are ongoing. For example, the 2016 BRM Survey findings show that during the next five years, two-thirds of surveyed producers expect to face risks associated with weather (63%), almost one half expect risks due to rising input prices (48%), and approximately one third anticipate risks associated with changing government policies and programs (33%), currency fluctuations (32%), decreasing output prices (28%) and market disruptions (26%). Nearly a quarter anticipate risks due to disease or pests (21%) and 10 percent expect credit risks.
The findings of the literature review and interviews with some key informants also suggest factors such as climate change, increased trade and export dependence, border closures, greater competition from developing export countries, and increased specialization may intensify the risks faced by producers in coming years.
Inadequacy of private and producer-led tools and supports
Available private sector and producer-led tools and support mechanisms are insufficient on their own to help producers manage the above listed risks and to remain competitive nationally and internationally:
- No private insurers or other institutions are currently involved in the delivery of multi-peril production insurance in Canada. The inability of the private sector to provide multi-peril production insurance at reasonable premiums is attributed to insufficient information related to the risk, which prevents a probable distribution function from being accurately calculated and actuarial odds established, and the limited ability of private insurers to pool risk across individuals. The unavailability of accurate information can occur for a variety of reasons such as lack of data on rare non-systematic risks or inability of producers to share information with insurance agents. The inability to pool risk across individuals is the result of production risks which are likely to impact a large percentage of individuals, such as a weather related disaster that will impact the yield of all or a large number of producers resulting in large losses. In these instances, the size of the expected loss results in high premiums.
- Few private insurance products for livestock/animal disease have been developed. This is the result of a lack of significant demand for coverage on the part of producers; a lack of knowledge/data for analyzing the risks inherent in agricultural activity; and a lack of capacity for developing tools. In addition, the lack of involvement by the financial sector has been attributed to the recognition that the costs associated with researching livestock insurance risks outweigh the expected gain of developing a livestock insurance product.
- Futures, forward contracts and marketing contracts are used by fewer than 25 percent of Canadian producers.Footnote 15 The resources and level of investment expertise required for dedicated product marketing using these tools makes them inaccessible to many smaller producers. Availability also varies by sector.
- Expansion of farm operations can help mitigate risk but often requires large-scale investments which may be outside the reach of smaller farms or those with high debt to asset ratios.
- Diversification can be effective in mitigating risk, particularly price risk, but is increasingly expensive due to the capital intensive nature of modern farming and benefits from economies of scale, making it uncommon among large producers. Diversification strategies also do not adequately protect households in a major disaster that affects all sources of farm incomes, as households are likely to experience losses to both cash crops and subsistence crops.
- Off-farm employment income is an effective risk mitigation strategy, particularly for smaller farms; however, this is primarily seen by the majority of farm households as a way of increasing household cash flow rather than a risk management strategy.
3.1.2 Role of the Business Risk Management programming
Due to the inadequacy of private sector and producer-led tools and support mechanisms, there is a continued need for the BRM programs to help producers manage exceptional risks associated with severe market volatility and disaster situations. Positive market conditions, record profitability and structural transformations resulting in the dominance of the sector by larger, more sophisticated farms have all significantly contributed to greater capacity among producers for managing normal business risk. The appropriate role of the BRM programming is to provide disaster level support and encourage producers and the private sector to develop tools and strategies to manage normal business risk. This is in line with best practices identified by the Organisation for Economic Co-operation and Development (OECD).
Evidence of producers’ capacity to manage normal business risks
The capacity of Canadian agricultural producers to manage normal business risks (such as, small or frequently occurring losses due to normal variations in production, prices and weather) has increased significantly. This is due in part to recent positive market conditions and record profitability that have prevailed for much of the past decade. As described previously, the recent economic state of the Canadian agriculture and agri-food sector is very positive. Producers, on average, are enjoying robust balance sheets and high profitability, have access to capital to meet short-term financial obligations and to make on-farm investments, and are not experiencing financial stress. As a result, there has been less need for BRM programming to assist producers in managing small, frequently occurring losses.
Structural transformations have also led to the domination of the Canadian agriculture and agri-food sector by larger, more sophisticated farms with greater capacity for managing normal business risk:
- Technological and genetic advancements including more sophisticated monitoring and measuring technology, the development of sophisticated seeding equipment, guidance and auto-steering equipment and larger planting and harvesting equipment are all contributing to increased crop yields and productivity. Livestock productivity has also increased as a result of genetics, technological improvements, improved feed formulations and other improved management practices.Footnote 16
- The number of large, highly specialized operations has increased to capture economies of scale in response to competition from low-cost exporters, rising input prices and declining operating margins. Between 1951 and 2011, the number of farms in Canada declined by almost two-thirds from over 600,000 to approximately 206,000 while the number of acres farmed remained approximately the same.Footnote 17
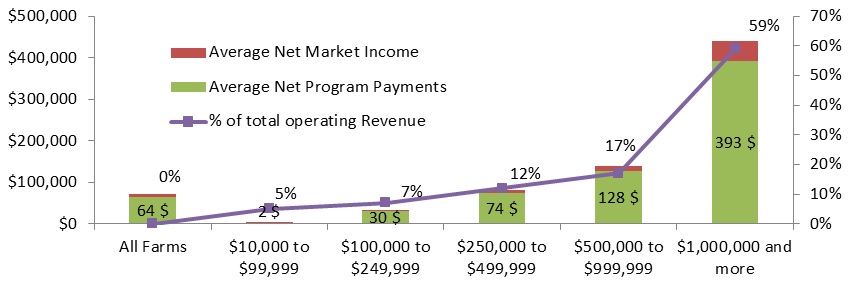
Large farms have a greater capacity for managing normal business risks. Farms with revenues of $500,000 or more have considerably higher net incomes than smaller farms (Figure 5). The average net market income (such as, before program payments) of farms with revenues of $1 million or more was about $393,000 compared to an average net income of $30,000 for farms with revenues between $100,000 and $249,999.
Description of above image
Figure 5 illustrates the net market incomes of Canadian farms by revenue class in 2014
| Revenue Class | Average Net Program Payments | Average Net Market Income | % of total operating Revenue |
|---|---|---|---|
| All Farms | $7,000 | $64,000 | N/A |
| $10,000 to $99,999 | $1,000 | $2,000 | 5% |
| $100,000 to $249,999 | $4,000 | $30,000 | 7% |
| $250,000 to $499,999 | $7,000 | $74,000 | 12% |
| $500,000 to $999,999 | $12,000 | $128,000 | 17% |
| $1,000,000 and more | $48,000 | $393,000 | 59% |
Source: AAFC (2015). Farm Financial Conditions and Government Assistance Data Book 2014
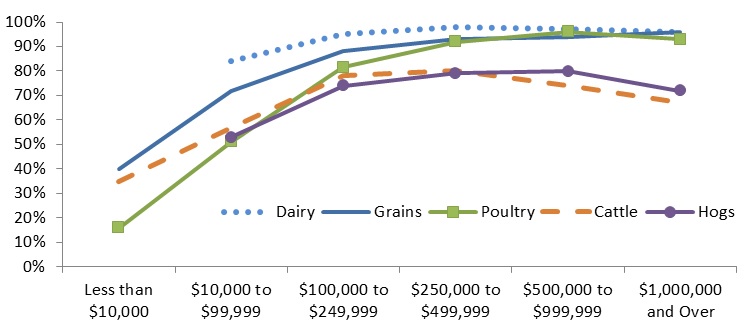
Large farms are also more consistently profitable. For most commodities, farms need to reach at least $250,000 in sales to have a high probability of being profitable (Figure 6).
Description of above image
Figure 6 illustrates the percentage of farms in each major sector that break even by revenue class, including program payments, for the years 2009-2013.
| Less than $10,000 | $10,000 to $99,999 | $100,000 to $249,999 | $250,000 to $499,999 | $500,000 to $999,999 | $1,000,000 and Over | |
|---|---|---|---|---|---|---|
| Dairy | 84% | 95% | 98% | 97% | 96% | |
| Grains | 40% | 72% | 88% | 93% | 94% | 96% |
| Poultry | 16% | 51% | 82% | 92% | 96% | 93% |
| Cattle | 35% | 57% | 78% | 80% | 74% | 67% |
| Hogs | 53% | 74% | 79% | 80% | 72% |
Source: Statistics Canada Census of Agriculture and AAFC Canadian Agriculture Dynamic Micro-Simulation Model (CADMS)
Large farms with revenues over $500,000 are also responsible for the majority of capital investments and are more likely to have the expertise and dedicated resources required to make use of private sector risk management tools such as futures, forward contracts and marketing contracts.
As larger farms are characterized by greater use of more sophisticated risk management technologies and practices, increased access to capital investment for risk mitigation measures, increased specialization and higher and more consistent profitability, the increasing domination of the sector by large farms has further reduced the need for the BRM programming to support coverage of normal business risks.
Appropriate role of Business Risk Management programming
The appropriate role of the BRM programming is to provide disaster level support and encourage producers and the private sector to develop tools and strategies to manage normal business risk. The role of BRM programming is to also encourage producers to adopt best practices and take actions to manage risk.
A 2011 Organisation for Economic Co-operation and Development (OECD) report examining the role of governments in agricultural risk managementFootnote 18 suggested government support should focus on infrequent but catastrophic events such as severe and widespread weather events or the outbreak of a highly damaging disease that affect many or all farmers over a wide area and will usually be beyond farmers’ or markets’ capacity to cope. According to the report, clearly defined coverage levels and procedures, and roles and responsibilities between government and producers are needed to manage pressures for ad hoc support and avoid creating moral hazard where producers fail to take precautions or risk mitigation efforts in the belief that government assistance will provide sufficient coverage or will step in following a loss. Best practices for governments identified by the OECD include facilitating good start up conditions for the development of market-based tools and supports, taking a holistic approach to risk management by assessing all risks and their relationship to one another, and not providing support for normal business risk beyond encouraging and educating producers to assess and develop their own risk management strategies.
The transition from covering normal business risks to targeting support towards disaster risk coverage is in line with trends in government agricultural support in other developed economies. The 2015 OECD Agricultural and Monitoring ReportFootnote 19 revealed that the relative cost of agricultural support, as a percentage of total gross domestic product (GDP), has declined in Canada as well as in other comparable jurisdictions (for example, the United States, Australia and the European Union); however, Canada’s support for producers, as a percentage of gross farm receipts, remains higher than that of Australia. These findings were corroborated by a 2014 comparison undertaken by the BRM working group in support of GF2, which found that Canada’s producer support is similar to the United States and that European Union (EU) reforms are narrowing the gap with Canada (Figure 7).Footnote 20
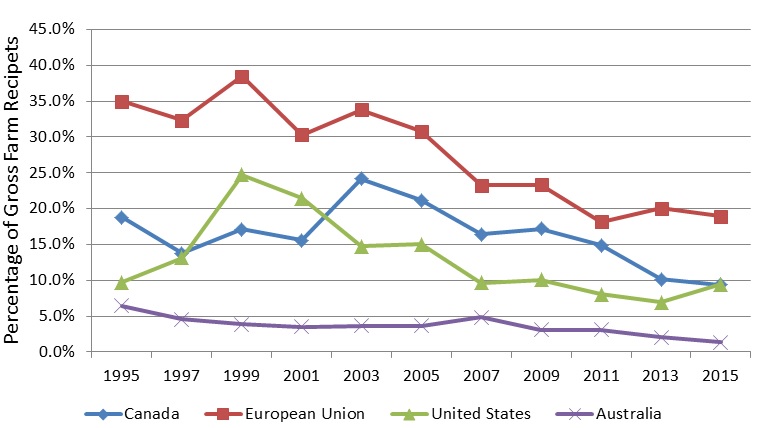
Description of above image
Figure 7 compares the producer support estimates as percentage of gross farm recipients for Canada, United States, the European Union and Australia by year for the years 1995 to 2015:
| 1995 | 1997 | 1999 | 2001 | 2003 | 2005 | 2007 | 2009 | 2011 | 2013 | 2015 | |
|---|---|---|---|---|---|---|---|---|---|---|---|
| Canada | 18.8 | 13.76 | 17.11 | 15.61 | 24.19 | 21.18 | 16.43 | 17.2 | 14.88 | 10.13 | 9.4 |
| European Union | 34.95 | 32.34 | 38.49 | 30.28 | 33.78 | 30.76 | 23.24 | 23.35 | 18.19 | 20.06 | 18.92 |
| United States | 9.74 | 13.13 | 24.73 | 21.43 | 14.74 | 15.04 | 9.67 | 10.1 | 8.01 | 6.9 | 9.44 |
| Australia | 6.43 | 4.58 | 3.86 | 3.5 | 3.66 | 3.64 | 4.83 | 3.09 | 3.12 | 2.06 | 1.34 |
Source: AAFC (2016), Business Risk Management: Considerations for the Next Policy Framework, Slide 4. 2015 numbers are forecast
3.1.3 Alignment with federal roles and responsibilities, Agriculture and Agri-Food Canada and Growing Forward 2 priorities and Business Risk Management principles
AgriInsurance, AgriStability and AgriInvest are aligned with federal roles and responsibilities legislated in the FIPA. The Wildlife Compensation Program is somewhat aligned with federal responsibilities, as there is a weak policy rationale for providing compensation for non-federally protected species. AgriInvest and the Wildlife Compensation Program are less aligned with GF2 priorities and BRM principles due to their design as entitlement programs that primarily cover or compensate for normal business risks. Some AgriInsurance products covering some normal risk are less aligned with GF2 strategic priorities and the appropriate role of BRM programming.
Alignment with federal roles and responsibilities
AgriInsurance, AgriStability and AgriInvest are aligned with federal roles and responsibilities. The programs are legislated under Section 4 of FIPA, which authorizes the Minister to enter into an agreement with one or more provinces for the establishment of a crop insurance program and to establish programming with the provinces for the protection of producers’ income.Footnote 21
Section 4 of FIPA outlines three core BRM principles:
- Compatibility with Canada’s international obligations (compliance to trade commitments and minimizing countervail risk);
- Not unduly distorting production or marketing decisions (minimizing moral hazard); and
- Providing equitable treatment across commodities and regions.Footnote 22
The Wildlife Compensation Program is only somewhat aligned with federal roles and responsibilities. Because the predecessor Waterfowl Program was included in the provinces’ crop insurance agreements in 1991, the Wildlife Compensation Program was originally legislated under Section 4 of FIPA.Footnote 23 In subsequent iterations of the agricultural risk frameworks, the Program has been administered as a compensation companion program under the Production Insurance program base in most provinces.
The Wildlife Compensation Program is aligned with federal roles and responsibilities to compensate producers for losses resulting from damage caused by waterfowl species protected under the Migratory Birds Convention Act and the Canada Wildlife Act. Québec is the only province to use the program to compensate for legislated species. There is no federal responsibility or policy rationale for the compensation provided to producers in other provinces for spot losses resulting from species other than the waterfowl species protected under federal legislation.
Alignment with Agriculture and Agri-Food Canada and Growing Forward 2 strategic outcomes, priorities and objectives
The four BRM programs support the strategic outcomes of AAFC and the GF2 policy framework for a competitive and innovative sector that contributes to society’s priorities and is proactive in managing risk.Footnote 24,Footnote 25 The programs are also aligned with key policy outcomes of GF2, which include a greater ability for producers to stabilize their enterprise income through a wide range of financial tools and effective coordinated responses to disasters, should they occur.
From GF to GF2, the objectives of the agricultural framework were revised to target government support to more severe and catastrophic losses and encourage producers to manage more normal business risks.Footnote 26 This shift in priorities was reflected in reforms to AgriStability and AgriInvest:
- AgriStability underwent three changes:
- Elimination of tiered coverage and a reduction in the coverage threshold. Under GF, producers were eligible to receive payments of 70 percent of the loss for margin declines of 15 percent to 30 percent (Tier 2), and payments of 80 percent of the loss for margin declines of 30 percent or greater (Tier 3). Under GF2, producers are eligible to receive payments covering 70 percent of the loss for margin declines of 30 percent or greater only.
- Adoption of a reference margin limiting factor (RML). To avoid compensating producers for reduced profits rather than income losses while maintaining disaster level coverage, the lower of the Olympic average reference margin or the producer’s eligible expenses for the reference years is used as the reference margin in the payment calculation.
- Increase in the negative margin payment from 60 to 70 percent. Under GF, a producer experiencing a negative margin (such as, the allowable expenses plus the value of the inventory change exceed the allowable income) was eligible to receive an AgriStability payment for 60 percent of that portion of the loss. Under GF2, producers experiencing a negative margin are eligible to receive a payment covering 70 percent of the loss.
- The AgriInvest payment rate was reduced from 1.5 to one percent of allowable net sales (ANS), thereby reducing the government maximum contribution from $22,500 to $15,000, and the maximum account balance was increased to 400 percent of ANS to allow the funds to respond to larger losses or investments.
No changes were made to AgriInsurance or the Wildlife Compensation Program under GF2:
- A 2014 AAFC examinationFootnote 27 of AgriInsurance determined that the program is a very successful tool in managing production losses for both producers and governments and that it is seen as predictable and bankable. Consequently, no changes were recommended.
- A review of the Wildlife Compensation Program was undertaken by a special federal/provincial task force in 2013 that provided an in-depth examination of possible program changes. As no national consensus was reached in time for program changes to be incorporated under GF2, discussions of the recommended changes will continue to support changes for the Next Policy Framework.
As no other changes were made to the design of AgriInvest as an entitlement program that primarily covers or compensates producers for normal business risks, the program is less aligned with GF2 priorities and objectives. Elements of the program’s design are also less aligned with BRM principles. For example, because AgriInvest matching contributions are based on one percent of a producer’s ANS, program benefits are related to sales revenues rather than income loss or need for funding.
The Wildlife Compensation Program is designed as an entitlement program providing compensation primarily for normal business risks, and is consequently less aligned with GF2 priorities and objectives and BRM principles. The program is different than AgriInsurance because producers do not pay premiums to participate in the Wildlife Compensation Program while they pay annual premiums to participate in AgriInsurance. As a result, producers do not contribute to the costs of the Wildlife Compensation Program.
Additionally, the scope of the mitigation and prevention plans in place is not well documented. While all participating provinces can demonstrate some type of program or service to assist producers in reducing their agricultural losses, or a requirement that producers use available mitigation strategies to prevent losses, mitigation or prevention strategies for particular crops or wildlife are not tracked. Thus, it is not evident to what extent producers are required to demonstrate the use of prevention or risk mitigation strategies to prevent recurring losses. Requests from provincial governments for evidence regarding the types of prevention and mitigation efforts taken by producers to prevent recurring losses were not fulfilled during the evaluation.
While AgriInsurance does provide disaster level support in line with GF2 priorities and BRM principles, there is evidence that some AgriInsurance products cover some normal business risk. For example, according to a 2011 OECD thematic review of Canadian risk management, policies with deductibles of only 10 percent that trigger indemnities when yields are reduced below 90 percent of historical averages trigger once every three years for the median farmer in a Saskatchewan sample. As a consequence, these policies can be considered to cover frequently occurring losses due to normal variations in production. An internal review of AgriInsurance similarly concluded that government subsidies do cover some normal business risk, and suggested further investigation would be required to determine the extent. In the instances where AgriInsurance products are found to cover normal business risk, transferring greater responsibility to producers would better align the program with GF2 strategic priorities and the appropriate role of BRM programming.
3.1.4 Duplication and complementarity with other programs
The four programs are designed, in combination with other GF2 BRM programs, to cover different risk types, levels, frequencies of occurrence and intended end uses. Linkages exist between programs to ensure producers are not compensated multiple times for the same loss. Although there is no direct duplication or overlap of programming, similarly designed programs are offered in Ontario and Québec that function as additional coverage to that provided by AgriInsurance, AgriStability and AgriInvest.
Complementarity of Growing Forward 2 Business Risk Management programs
The design of the GF2 BRM suite of programs is comprehensive in addressing different risk types, levels, frequencies of occurrence and intended end uses. Of the four programs included in this evaluation:
- The Wildlife Compensation Program provides compensation primarily for small and medium-sized losses resulting from wildlife damages to crops or predation of livestock;
- AgriInvest provides matching contributions to address small income losses or invest in risk mitigation strategies. The program covers normal to medium levels of risk from all sources with a relatively frequent occurrence such as fluctuations in cash flow, input and other production costs and small income declines;
- AgriInsurance provides comprehensive coverage to minimize the economic impact of production losses resulting from normal to disaster level risks depending on the level of coverage chosen; and
- AgriStability provides income stabilization assistance for disaster level risks from all sources resulting in margin declines of 30 percent or greater.
Among the other programs in the GF2 BRM suite:
- AgriRisk provides one-time project-based funding to support the development and adoption of risk management tools including insurance-based products to foster more robust private sector risk management tools and encourage producers to proactively manage normal risk; and
- AgriRecovery, an FPT framework, enables governments to assess disasters on a case-by-case basis to provide compensation to mitigate the impacts of the disaster and facilitate the resumption of business operations as quickly as possible. Coverage is restricted to rare and large disaster level risks resulting in extraordinary costs not covered by existing BRM programming.
- While not part of the BRM suite, the Advanced Payments Program (APP) provides guaranteed short-term loans to assist producers in managing normal business risk by providing sufficient cash flow and enabling producers to market when conditions and prices are favourable.
Linkages between the GF2 BRM programs exist to ensure there is no overlap or duplication of payments:
- AgriStability payments take into account AgriInsurance premiums as allowable expenses and AgriInsurance payments as allowable income, in both the current and reference years.
- AgriStability payments only compensate the negative portion of a margin decline if it was not eligible for AgriInsurance payments at the 70 percent coverage level. In the instances when a producer’s negative margin includes insurable crops that would have been in an AgriInsurance claim position, the value of the AgriInsurance net benefit (such as, the benefit minus the cost of the premium) is included in a producer’s AgriStability margin calculation, potentially reducing or eliminating negative margin AgriStability payments.Footnote 28
- The APP uses future AgriStability and AgriInsurance payments as additional security for the advances. Producers can use future payments from these programs as a guarantee to repay the APP principal. If their crop fails or there is a disaster, the payment they receive from the other BRM programs would be used to repay the APP advance.
- AgriRecovery is intended to ensure producers are not compensated twice for the same cost. All other BRM payments are taken into consideration when reviewing the situation to determine what assistance could be provided under the framework.
Complementarity with similar provincial programs
Although there is no direct overlap or duplication in programming, the following similarly designed provincial programs are available in Ontario and Québec that function as additional coverage provided by AgriInsurance, AgriStability and AgriInvest:
- Ontario’s Risk Management Program (RMP) for livestock, and grains and oilseeds stabilizes farm incomes by offering payments if the market price drops below the average cost of production. Participation in AgriInsurance is a requirement for participation.
- Ontario’s RMP for Edible Horticulture provides producers with matching provincial contributions in a Self-Directed Risk Management (SDRM) account to help mitigate risks associated with farm business. Participation in AgriStability is not a requirement. However, if a producer participates in AgriStability, their RMP payment and contribution is counted as an advance on the provincial portion of their AgriStability payment for the corresponding program year (there is no impact on the federal portion of the AgriStability payment).
- Québec’s Assurance Stabilisation des Revenues Agricoles (ASRA) is a cost-of-production based program that stabilizes farm income by guaranteeing producers a positive net income. ASRA is designed as a top-up to AgriStability, operating similar to an advance payment. Producers who participate in both programs receive the higher amount between the government contributions calculated for each program. As a way to avoid double payment for revenue declines, AgriStability payments are deducted from ASRA payments. ASRA compensation for any operation that does not participate in AgriStability may be reduced by 40 percent. ASRA program intervention is also adjusted to take into account amounts paid by the AgriInvest program.
- Québec’s Agri-Québec Plus program provides income stabilization assistance for producers of non-supply managed commodities that are not eligible under ASRA who experience an income decline of 15 percent or greater.
3.2 Performance – effectiveness
This section outlines the key findings and conclusions related to the achievement of the programs against their performance targets for effectiveness and intended program outcomes. Achievements of the programs against their performance targets related to efficiency are addressed in section 3.3.
3.2.1 AgriInsurance
AgriInsurance is very effective in mitigating the financial impact of production losses for producers of eligible commodities. Participation has remained very high during GF and GF2 and producers are satisfied with the program. While insurance products are widely available for most major commodities, they are not currently available for cattle and hogs, with the exception of forage insurance for cattle producers, which has low participation. AgriInsurance premiums paid by the federal and provincial governments more than doubled between 2007/08 and 2013/14 due to an increase in the value of agricultural production insured.
Achievement of intended outputs and outcomes
Participation in AgriInsurance has remained very high and stable during GF and GF2. While the number of participants declined 13 percent between 2007/08 and 2015/16 as a result of consolidation and increasing average farm size, the number of acres insured increased 11 percent during the same period (Figure 8).
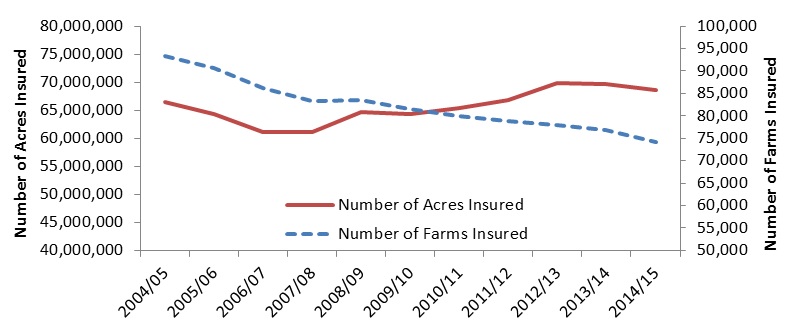
Description of above image
Figure 8 illustrates the number of farms and acres ensured by AgriInsurance by year from 2004/05 to 2014/15
| Year | Number of Farms Insured | Number of Acres Insured |
|---|---|---|
| 2004/05 | 93,441 | 66,472,052 |
| 2005/06 | 90,581 | 64,254,301 |
| 2006/07 | 86,308 | 61,166,680 |
| 2007/08 | 83,373 | 61,060,672 |
| 2008/09 | 83,534 | 64,636,746 |
| 2009/10 | 81,563 | 64,309,109 |
| 2010/11 | 80,016 | 65,475,054 |
| 2011/12 | 78,893 | 66,761,485 |
| 2012/13 | 77,901 | 69,792,566 |
| 2013/14 | 76,742 | 69,658,076 |
| 2014/15 | 74,144 | 68,584,786 |
Source: AgriInsurance program database [Production Insurance Statistical System (PINSS)]
Producers are satisfied with the program overall. On a scale of one to fiveFootnote 29, participants who completed the 2016 BRM survey rated AgriInsurance as timely (3.8), responsive (3.6), predictable in terms of the benefits to be received (3.6) and clear or easily understood (3.8).
As outlined in Table 2, AgriInsurance is meeting most of its performance targets.
| Performance Indicator | Target | 2013/14 Actual | 2014/15 Actual |
|---|---|---|---|
| Effectiveness of self-sustainability methods over time (indemnity/premiums) - multi-year moving average | Between 0.95 & 1.05 | 0.88 | 0.85 |
| Government share of total AgriInsurance premiums | 60% | 60.7% | 60.7% |
| Value of agricultural products eligible for insurance compared to the market value of all agricultural products | >=85% | 85% | 87% |
| Performance Indicator | Target | 2013/14 Actual | 2014/15 Actual |
|---|---|---|---|
| All eligible products (excluding forage) | >=75% | 76% | 76% |
| Forage | >=20% | 16% | 16% |
| Source: AgriInsurance Performance Measurement Strategy Data | |||
The value of agricultural products eligible for insurance compared to the market value of all agricultural products gradually increased during GF and GF2 and has exceeded the performance target of 85 percent in both 2013/14 (88%) and 2014/15 (87%).
Coverage remains very high with the exception of forage insurance. The value of insured production compared to the total production value of all crops excluding forage was 76 percent in 2013/14 and 2014/15, slightly exceeding the performance target of 75 percent. The value of forage insured compared to the total value of forage production was 16 percent in 2013/14 and 2014/15, falling short of the target of 20 percent. The average coverage level of the production insured by AgriInsurance has remained at approximately 75 percent from 2007/08 to 2014/15.
Interviews with representatives from the federal and provincial governments and industry associations suggest low forage uptake has occurred because most cattle producers prefer to manage their feed risks on-farm rather than obtaining forage insurance. Examples of on-farm risk mitigation options utilized by cattle producers include overproduction and the build-up of reserves; growth of annual crops (for example, greenfeed) to substitute for hay and pasture; purchase of feed from neighbours; and management of herd size relative to feed production.
AgriInsurance indemnities paid to producers have had a significant effect in mitigating the financial impact of production losses for producers of eligible commodities. As shown in Figure 9, the number of claims has fluctuated considerably from a high of 93,536 in 2004/05 to a low of 46,976 in 2013/14. The annual indemnities paid to producers have also fluctuated considerably, ranging from a low of $445.7 million in 2006/07 to a peak of $1,337.6 million in 2012/13. The recent spike in indemnities is attributed to the significant increases in commodity prices. So far during GF2 (2013/14 and 2014/15), a total of 107,811 AgriInsurance claims have resulted in $1.6 billion in indemnities paid.
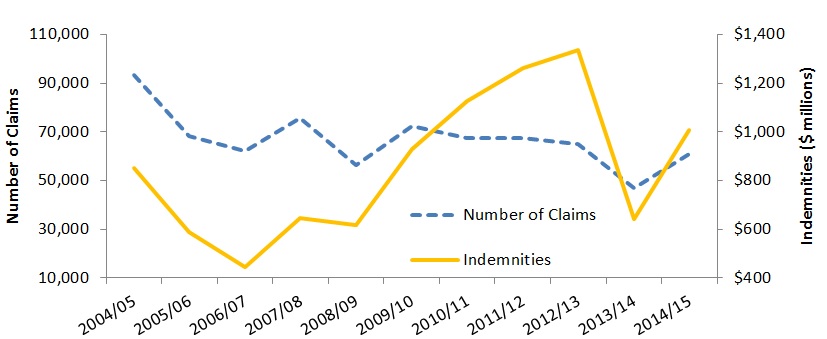
Description of above image
Figure 9 compares the number of claims per year and the value of indemnities in millions for AgriInsurance by year from 2004 /05 to 2014/15
| Year | Number of Claims | Indemnities in Millions |
|---|---|---|
| 2004/05 | 93,536 | $850.70 |
| 2005/06 | 68,489 | 586.9 |
| 2006/07 | 62,269 | 445.7 |
| 2007/08 | 75,919 | 644.6 |
| 2008/09 | 56,219 | 615.8 |
| 2009/10 | 72,330 | 928.4 |
| 2010/11 | 67,334 | 1,125.40 |
| 2011/12 | 67,472 | 1,261.50 |
| 2012/13 | 64,919 | 1,337.60 |
| 2013/14 | 46,976 | 641.9 |
| 2014/15 | 60,835 | 1,007.70 |
Source: AgriInsurance program database (PINSS)
According to the results of the 2016 BRM Producer Survey, a majority (79%) of participants that received AgriInsurance payments between 2013 and 2015 indicated that the payments helped them recover their production losses at least to a moderate extent or better. Producers were most likely to indicate that the primary benefits of the program are the ability to manage production losses (27%), protect input cost investment (19%), protect against risks (19%), and stabilize farm income (12%). All key informants interviewed rated AgriInsurance as having a significant to very significant impact in mitigating the financial impact of production losses (an average rating of 4.3 out of 5), citing the wide range of available insurance products and coverage levels available to producers.
Some progress has been made to not only implement a previous evaluation recommendation for AAFC to continue working with industry to develop livestock insurance plans where appropriate, but also to explore and report back to senior management on the viability of alternatives outside of AgriInsurance. Using AgriRisk, price insurance for cattle and hogs has been provided through a pilot of the Western Livestock Price Insurance Program (WLPIP). The WLPIP is not considered production insurance nor under the AgriInsurance umbrella, but it appears to be a good example of a producer paid insurance program as the premiums for the program are fully producer-paid and not subsidized by governments. Some uptake in WLPIP has occurred among cattle producers, but participation among hog producers has been minimal. Production insurance plans for hogs continue to be investigated by an industry and government hog mortality task team. However, a final design has yet to be developed and implemented.
The value of insured agricultural production doubled from $7.27 billion in 2004/05 to $14.87 billion in 2014/15 as a result of increases in commodity prices, an ongoing transition to higher value crops and increases in insured acreage. Consequently, total AgriInsurance premiums paid by the federal and provincial governments almost doubled from $565.7 million in 2007/08 to $924 million in 2014/15 (Figure 10). The total federal and provincial government share of premiums declined to $706.4 million in 2015/16.
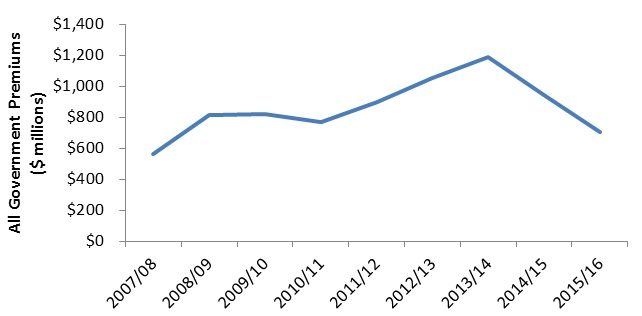
Description of above image
Figure 10 illustrates the total federal and provincial value of AgriInsurance Premiums by year from 2007-08 to 2015/16.
| Year | All Government Premiums |
|---|---|
| 2007/08 | $565.70 |
| 2008/09 | $813.40 |
| 2009/10 | $820.50 |
| 2010/11 | $767.00 |
| 2011/12 | $897.30 |
| 2012/13 | $1,055.00 |
| 2013/14 | $1,187.70 |
| 2014/15 | $941.30 |
| 2015/16 | $706.40 |
Source: AgriInsurance Performance Measurement Strategy Data
Note: 2015/16 is based on forecast information.
3.2.2 Wildlife Compensation Program
The Wildlife Compensation Program is effective in providing financial assistance for production losses due to wildlife damage of crops and predation of livestock. There is insufficient evidence on whether producers who receive compensation make efforts to prevent a recurrence. The Program has expanded beyond its original policy rationale to compensate for federally protected waterfowl species and has no direct linkages to AgriInsurance outside of Québec.
Achievement of intended outputs and outcomes
During the first two years of GF2 (2013/14 and 2014/15), there were an average of 11,362 claims and the average total value of the claims was approximately $26 million (Figure 11). The average claim amount during these two years was about $2,300. The total compensation paid by the Wildlife Compensation Program during this period was about $20 million per year.
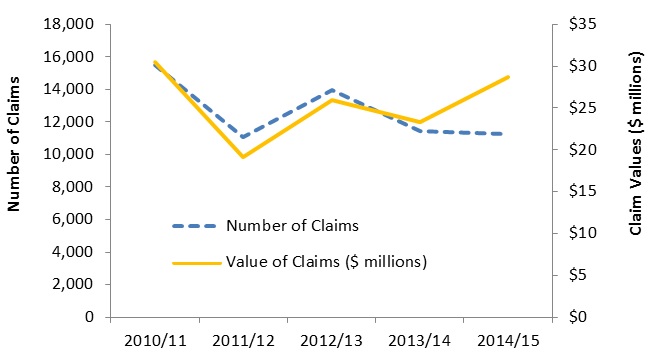
Description of above image
Figure 11 compares the claims per year and the total value of claims in millions for the Wildlife Compensation Program by year for 2010/11 to 2014/15.
| Year | Number of Claims | Value of Claims ($ millions) |
|---|---|---|
| 2010/11 | 15,530 | $30.53 |
| 2011/12 | 11,089 | $19.15 |
| 2012/13 | 13,953 | $25.94 |
| 2013/14 | 11,464 | $23.33 |
| 2014/15 | 11,260 | $28.73 |
Source: Wildlife Compensation Program database
The extent of the financial assistance provided by the Program varies widely by province. As shown in Figure 12, Alberta, Manitoba and Saskatchewan accounted for more than three-quarters of the compensation paid by the Wildlife Compensation Program over the last five years.
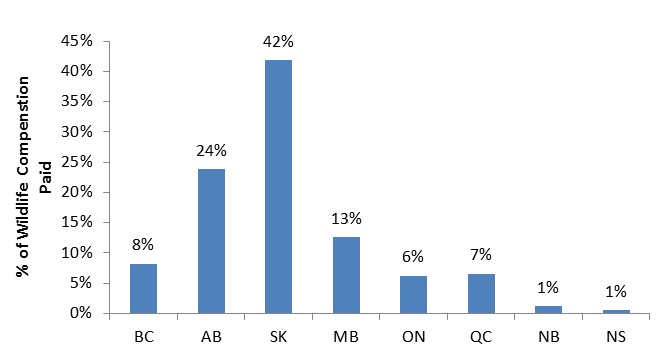
Description of above image
Figure 12 compares the percentage of wildlife compensation paid to producers by province for the years 2010/11 to 2014/15.
| Province | % of Total Compensation Paid |
|---|---|
| British Columbia | 8.20% |
| Alberta | 23.80% |
| Saskatchewan | 41.80% |
| Manitoba | 12.60% |
| Ontario | 6.20% |
| Quebec | 6.50% |
| New Brunswick | 1.20% |
| Nova Scotia | 0.50% |
Source: Wildlife Compensation Program database
The wide range in the amount of compensation paid to producers by participating provinces is the result of differences in the types and prevalence of wildlife present, the crops and livestock produced in each province and significant differences in program design. Provinces have the authority to include any wildlife species, as long as they can demonstrate there is a provincial wildlife damage mitigation strategy in place. As a result, the number of eligible species varies from highly restrictive in Québec, where compensation is provided to crop producers exclusively for damages resulting from federally-protected waterfowl species, to highly inclusive in Saskatchewan, where compensation is available to crop producers for damages caused by over 15 animal species and to livestock producers for predation from any wild animal. Provinces establish their own program criteria for eligible commodities, inspection/appraisal fees, minimum claim values and maximum compensation values. Additionally, while the federal-provincial cost-shared portion compensates producers for up to 80 percent of their production losses incurred, Alberta, Saskatchewan, Manitoba and Ontario use provincial funding to offer additional compensation up to 90 or 100 percent of the loss, depending on the province.
There is insufficient evidence on whether producers who receive compensation make efforts to prevent a recurrence. While each province that delivers the Wildlife Compensation Program has a requirement for producers to adopt best practices and available mitigation strategies, the extent to which these requirements are enforced is unknown even though the number of claims since 2010/11 has declined from 15,530 to 11,260 in 2014/15. Some provincial government and producer representatives interviewed suggested there are no effective prevention or mitigation efforts for some wildlife losses.
Expansion of the program beyond its policy rationale
The Wildlife Compensation Program has expanded beyond its original policy rationale to only compensate for federally protected waterfowl species and has no direct linkages to AgriInsurance outside of Québec. Québec is the only province that exclusively compensates producers for damages resulting from federally protected species, as originally intended. Damages from other wildlife species are only compensated as insurable perils under AgriInsurance. In all other participating provinces, the Wildlife Compensation Program covers other non-federally protected wildlife species.
Some progress has been made to implement the previous evaluation recommendations that the FPT AgriInsurance Working Group review the policy rationale for the Wildlife Compensation Program including what constitutes the definition of "eligible wildlife" and assess the feasibility of incorporating the production risks related to wildlife into existing production crop insurance plans. A review of the Wildlife Compensation Program was undertaken by a special federal/provincial task force in 2011 that provided an in-depth examination of possible program changes. As no national consensus was reached in time for program changes to be incorporated under GF2, discussions of the recommended changes will continue to support changes for the Next Policy Framework.
As an option to merge the Wildlife Compensation Program with AgriInsurance would only be applicable as crop damage due to the lack of livestock insurance plans. This is possible, as demonstrated by the Program in Québec. Crop damages account for the vast majority of payments made to producers. Between 2010/11 and 2014/15, 82 percent of the total compensation paid to producers through the Wildlife Compensation Program was for damage to crops and 18 percent was for livestock (Figure 13).Footnote 30
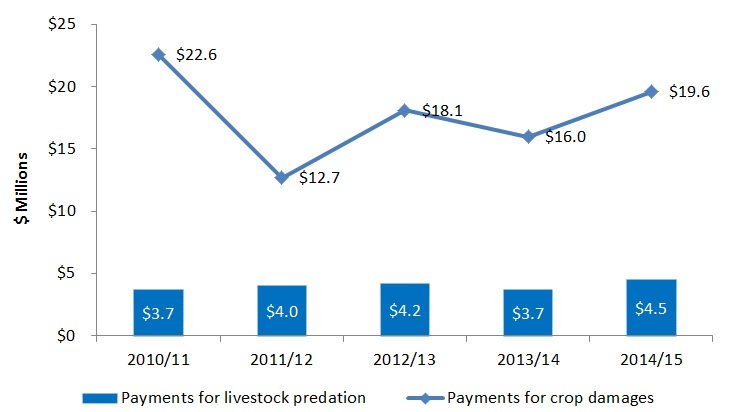
Description of above image
Figure 13 illustrates Wildlife Compensation Program Payments in millions by Loss type and year from 2010/11 to 2014/15.
| Year | Payments for crop damages | Payments for livestock predation |
|---|---|---|
| 2010/11 | $22.60 | $3.70 |
| 2011/12 | $12.70 | $4.00 |
| 2012/13 | $18.10 | $4.20 |
| 2013/14 | $16.00 | $3.70 |
| 2014/15 | $19.60 | $4.50 |
Source: Wildlife Compensation Program database
3.2.3 AgriStability
While AgriStability payments have been effective in mitigating the financial impacts of large short-term income losses, declining participation has limited the number of beneficiaries while the number and value of payments has been further reduced by the GF2 changes. The percentage of market revenues covered has not declined as significantly as the number of participants due to higher participation rates among large producers.
Achievement of intended outputs and outcomes
As outlined in Table 3, AgriStability is not meeting all of its performance targets related to program effectiveness.
| Performance Indicator | Target | 2013 Actual | 2014 Actual |
|---|---|---|---|
| Percentage of producers participating in the program | 50% | 37% | 33% |
| Percentage of market revenues covered by the program | 65% | 63% | 55% |
| Proportion of producers triggering AgriStability payments where Production Margin plus AgriStability payments returns them to 55% of their reference margin | 75% | 67% | 75% |
| Source: AgriStability Performance Measurement Strategy Data, revised program data received September 29, 2016 | |||
The number of producers participating in AgriStability has consistently declined for the last seven years. The decline in AgriStability participation has exceeded the rate of decline in the number of farms in the industry, where smaller farms are exiting the industry or getting bought out by larger farms. During GF, the participation rate declined from 57 percent of producers in 2007 to 43 percent in 2012, missing the performance target of 55 percent. Under GF2, the participation rate further declined to 37 percent in 2013 and 33 percent in 2014, significantly below the performance target of 50 percent.
While the decline in participation has been consistent across all commodity groups (Figure 14), of particular note is the 25 percent decline in the participation rate of cattle producers from 59 to 34 percent, as AgriStability represents the primary source of disaster level coverage for livestock producers. The increase in market price of cattle from 2010 to 2015 may have impacted the decline in participation rate among cattle producers.Footnote 31 Participation rates were lowest among producers of supply managed commodities (27%) and cattle (34%) and highest among hog (75%) producers.
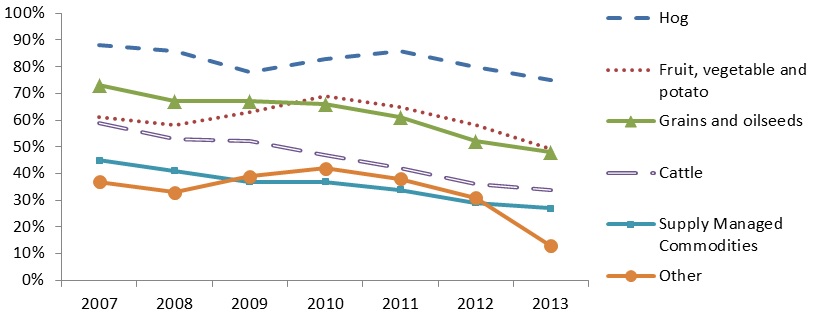
Description of above image
Figure 14 illustrates the AgriStability participation rate by major commodity group and year from 2007 to 2013.
| Program Year | Hog | Fruit, vegetable and potato | Grains and oilseeds | Cattle | Supply Managed Commodities | Other |
|---|---|---|---|---|---|---|
| 2007 | 88% | 61% | 73% | 59% | 45% | 37% |
| 2008 | 86% | 58% | 67% | 53% | 41% | 33% |
| 2009 | 78% | 63% | 67% | 52% | 37% | 39% |
| 2010 | 83% | 69% | 66% | 47% | 37% | 42% |
| 2011 | 86% | 65% | 61% | 42% | 34% | 38% |
| 2012 | 80% | 58% | 52% | 36% | 29% | 31% |
| 2013 | 75% | 49% | 48% | 34% | 27% | 13% |
Source: AgriStability program database
Evidence from the key informant interviews indicates declining participation in AgriStability is due to the program's complexity, lack of transparency or predictability, issues with the timeliness of payments, the strength of recent market conditions and commodity prices, and the GF2 program changes that reduced the number and value of the program payments. As indicated in Table 4, BRM survey participants rated AgriStability lowest (2.65 on a scale of 1 to 5) in terms of clarity, predictability, responsiveness and timeliness compared to AgriInsurance (3.67), AgriInvest (3.58) and the Advanced Payments Program (APP) (4.14).
| Element | AgriStability | AgriInsurance | AgriInvest | APP | Total |
|---|---|---|---|---|---|
| Timeliness of Benefits | 2.79 | 3.77 | 3.65 | 4.16 | 3.59 |
| Responsiveness of Program | 2.56 | 3.55 | 3.47 | 4.12 | 3.43 |
| Predictability of Benefits | 2.58 | 3.61 | 3.58 | 4.17 | 3.49 |
| Clarity of Program | 2.70 | 3.76 | 3.62 | 4.11 | 3.55 |
| Program Average | 2.65 | 3.67 | 3.58 | 4.14 | 3.51 |
| Source: Ference & Company (2016). 2016 BRM Producer Survey Findings | |||||
Most producers (70%) that participated in AgriStability between 2013 and 2015 did not know the percentage margin decline, relative to their reference margin necessary to trigger a benefit from the Program under GF2. Key informants indicated that producers are experiencing difficulties in understanding aspects of the AgriStability [for example, reference margin limit (RML)] and a substantial number rely on their accountants to complete their AgriStability application. Representatives of several provincial government administrations, in particular, have noted a lack of understanding of the program changes on the part of producers despite awareness-raising campaigns and concerns with the overall transparency of the AgriStability.Footnote 32
The percentage of market revenues covered by AgriStability has not declined as dramatically as the producer participation rate (Figure 15). During GF, the proportion of market revenues covered averaged 71 percent, missing the performance target of 75 percent. So far under GF2, the proportion of market revenues covered was 63 percent in 2013 and 55 percent in 2014, missing the target of 65 percent.Footnote 33
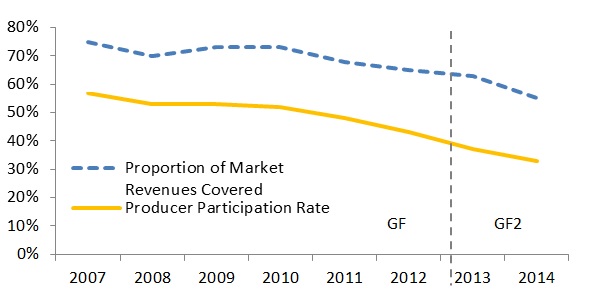
Description of above image
Figure 15 compares the proportion of farm market revenues covered by AgriStability to producer participation in the program by year from 2007-2014.
| Year | Proportion of Market Revenues Covered | Producer Participation Rate |
|---|---|---|
| 2007 | 75% | 57% |
| 2008 | 70% | 53% |
| 2009 | 73% | 53% |
| 2010 | 73% | 52% |
| 2011 | 68% | 48% |
| 2012 | 65% | 43% |
| 2013 | 63% | 37% |
| 2014 | 55% | 33% |
Source: AgriStability Performance Measurement Strategy Data, revised program data September 29, 2016
The more gradual decline in the proportion of market revenues covered by AgriStability is due to high participation rates among large producers. As shown in Table 5, there is a positive correlation between the size of a producer’s market revenues and the AgriStability participation rate. About one half (51%) of producers with revenues between $500,000 and $1 million and 56 percent of producers with revenues of $1 million or greater participated in the AgriStability in 2013. The decrease in participation rate and coverage of the AgriStability exposes the industry to more risk and increases the potential need for ad-hoc support.
| Market Revenues | Number of Participants | Total Number of Producers in Canada | Participation Rate |
|---|---|---|---|
| $10,000 - $24,999 | 4,576 | 33,095 | 14% |
| $25,000 - $49,999 | 6,772 | 28,135 | 24% |
| $50,000 - $99,999 | 9,419 | 27,350 | 34% |
| $100,000 - $249,999 | 14,843 | 32,595 | 46% |
| $250,000 - $499,999 | 11,593 | 23,190 | 50% |
| $500,000 - $999,999 | 9,126 | 17,830 | 51% |
| $1,000,000 and over | 7,896 | 14,135 | 56% |
| Canada | 64,225 | 176,330 | 36% |
| Source: AgriStability program database | |||
The benefits paid to producers through AgriStability declined from $951 million in 2009 to $297 million in 2013, but are expected to increase from 2015 to 2016 (Figure 16). The percentage of program participants who were paid benefits similarly declined from 28 percent in 2009 to 13 percent in 2013. The primary reasons for the decline include strong market conditions and high commodity prices in recent years, and the impact of GF2 program changes which have reduced the number and value of payments in line with the transition to disaster or catastrophic level coverage, as intended.
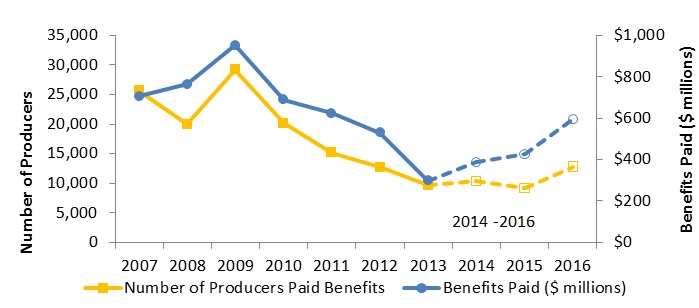
Description of above image
Figure 16 illustrates the relationship between the total value of AgriStability benefits paid in millions to producers and the number of producers who were paid benefits by year from 2007-2016.
| Program Year | Benefits Paid ($ millions) | Number of Producers Paid Benefits |
|---|---|---|
| 2007 | $704.90 | 25,648 |
| 2008 | $762.40 | 19,986 |
| 2009 | $951.20 | 29,197 |
| 2010 | $689.10 | 20,138 |
| 2011 | $624.30 | 15,123 |
| 2012 | $529.60 | 12,713 |
| 2013 | $297.00 | 9,697 |
| 2014 | $386.40 | 10,376 |
| 2015 | $428.12 | 9,191 |
| 2016 | $595.03 | 12,810 |
Source: AgriStability Performance Measurement Strategy Data
Note: 2014-2016 are estimates
The elimination of the tiered coverage has had the most significant impact in reducing AgriStability payments in 2013 (70% of the reduction), followed by the introduction of the RML factor (30%).Footnote 34 The RML was intended to reduce payments to profitable producers (such as, those with high reference margins compared to their allowable expenses). Evidence indicates that in 2013, an increased share of payments has been directed to producers who were unprofitable in the program year. However, some unprofitable farms have experienced larger reductions in payments in dollar terms.
For producers triggering AgriStability payments, the program margin compared to the reference margin during GF averaged 43 percent, and the program margin, including AgriStability payments compared to the reference margin averaged 72 percent. During 2013 under GF2, the program margin for producers triggering AgriStability payments compared to the reference margin declined to 33 percent and the program margin including AgriStability payments compared to the reference margin declined to 57 percent (Figure 17). The proportion of producers triggering a payment where the production margin plus the payment returned them to 55 percent of their reference margin was 67 percent in 2013, below the performance target of 75 percent.
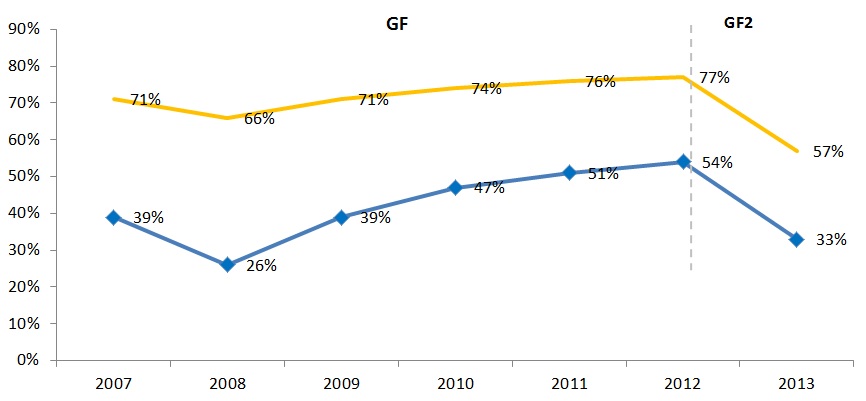
Description of above image
Figure 17 compares AgriStability Participants’ program margins to the reference margin by tear from 2007-2013.
| Program Year | Program Margin Compared to Reference Margin | Program Margin Including AgriStability Payments Compared to Reference Margin |
|---|---|---|
| 2007 | 39% | 71% |
| 2008 | 26% | 66% |
| 2009 | 39% | 71% |
| 2010 | 47% | 74% |
| 2011 | 51% | 76% |
| 2012 | 54% | 77% |
| 2013 | 33% | 57% |
Source: AgriStability program database
A majority (64%) of BRM participants surveyed who received AgriStability payments between 2013 and 2015 reported that the payments helped them recover their income losses at least to a moderate extent (with 11% indicating to a great extent). The average producer rated the effectiveness of AgriStability assistance in recovering income losses as 2.8 on a 5-point scale. Surveyed participants most frequently identified the primary benefits of the program as the ability to manage income losses and to even out income flow (46%), the mitigation of impacts beyond their control (10%), and the provision of a safety net (7%).
Key informants rated AgriStability as having a considerable impact in mitigating the financial impact of large, short-term income losses (average rating of 3.4 out of 5). Several key informants explained that features of the program’s design, including the RML, Olympic reference margin, and 70 percent trigger, work to ensure it does not impede adaptability to market signals. However, the majority of respondents suggested the impact of the payments may be diminished as a result of declining participation and lower payouts resulting from the GF2 changes.
3.2.4 AgriInvest
AgriInvest is somewhat effective in affording producers greater flexibility with managing financial risks and increasing producers’ capacity to deal with income losses. Participation in the program is high and producers are setting aside funds. Because the program does not stipulate that the funds withdrawn must be used to offset income losses, it is difficult to ensure that these funds are being used to manage financial risks and offset losses.
Achievement of intended outputs and outcomes
As outlined in Table 6, AgriInvest is meeting most of its performance targets related to program effectiveness because participation and coverage of total market sales are high. During GF2, 73 percent of producers participated in 2013, and 75 percent participated in 2014, essentially meeting the performance target of 75 percent, on average.
| Performance Indicator | Target | 2013 Actual | 2014 Actual |
|---|---|---|---|
| Percentage of producers participating in the program | 75% | 73% | 75% |
| Percentage of allowable market sales covered by the program | 85% | 89% | 88% |
| Government contributions as a percentage of maximum matchable contributions | 85% | 92% | 91% |
| Percentage of AgriInvest producers triggering AgriStability payments and making withdrawals from AgriInvest account | 60% | 47% | 42% |
| Source: AgriInvest Performance Measurement Strategy Data | |||
In 2013 and 2014, 89 and 88 percent of allowable market sales were covered, outperforming the performance target of 85 percent. While the overall number of participants declined 11 percent from 143,577 in 2007 to 127,384 in 2014, this decline was primarily due to the reduction in the number of farms in Canada because the percentage of producers participating in AgriInvest has not changed substantially during this period (Figure 18).

Description of above image
Figure 18 compares the AgriInvest participation rate and coverage rate of market sales to the number of AgriInvest participants by year from 2007-2014.
| Program Year | Number of Participants | % of Producers Participating | % of Allowable Market Sales Covered |
|---|---|---|---|
| 2007 | 143,577 | 76% | 86% |
| 2008 | 142,647 | 77% | 90% |
| 2009 | 140,672 | 78% | 91% |
| 2010 | 137,678 | 79% | 89% |
| 2011 | 136,529 | 82% | 89% |
| 2012 | 134,421 | 76% | 94% |
| 2013 | 127,989 | 73% | 89% |
| 2014 | 127,384 | 75% | 88% |
Source: AgriInvest Performance Measurement Strategy Data
As shown in Figure 19, the average annual AgriInvest contribution by producers was $2,828 and total contributions averaged $323 million per year during GF. During GF2, the average annual contribution declined to $2,490 and total contributions averaged $259 million per year. This decline is at least in part due to the reduction in payment rate (from 1.5 to 1% of ANS) and the allowable maximum contribution (from $22,500 to $15,000).
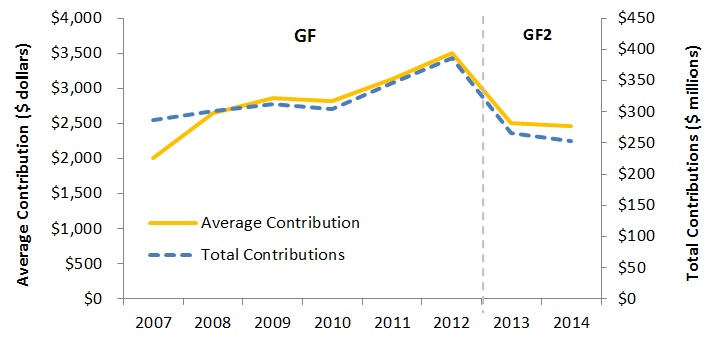
Description of above image
Figure 19 compares the average producer contribution to AgriInvest and the total value of contributions in millions by year from 2007 to 2014.
| Program Year | Total Contributions | Average Contribution |
|---|---|---|
| 2007 | $287.00 | $2,009 |
| 2008 | $300.60 | $2,642 |
| 2009 | $312.00 | $2,858 |
| 2010 | $304.70 | $2,816 |
| 2011 | $346.30 | $3,134 |
| 2012 | $385.40 | $3,509 |
| 2013 | $265.10 | $2,510 |
| 2014 | $253.10 | $2,469 |
Source: AgriInvest program database
Between 2007 and 2014, the proportion of producers making a deposit remained stable, ranging from 73 to 79 percent. The amount deposited as a percentage of the maximum allowable contribution has remained consistent at approximately 90 percent between 2007 and 2014. During GF2, government contributions as a percentage of maximum matchable contributions were 92 percent in 2013/14 and 91 percent in 2014/15, outperforming the performance target of 85 percent. AgriInvest account balances have grown to almost $2 billion in 2014/15. In recent years, the rate of increase in account balances has slowed due to an increase in withdrawals and reduced contributions due to GF2 program changes, such as the reduced payment rate and government maximum contribution (Figure 20).

Description of above image
Figure 20 illustrates the total value of withdrawals, contributions and account balances in millions for AgriInvest by year from 2010 to 2014.
| Fiscal Year | Total Contributions | Total Withdrawals | Account Balance |
|---|---|---|---|
| 2010 | $725.20 | $218.40 | 729.9 |
| 2011 | $682.80 | $313.20 | 1,099.5 |
| 2012 | 717.2 | $353.00 | 1,463.7 |
| 2013 | 791.2 | $432.00 | 1,822.9 |
| 2014 | 574 | $421.20 | 1,975.7 |
Source: AgriInvest program database
AgriInvest is somewhat meeting its intended intermediate outcome that producers have flexibility in managing financial risks and intended final outcome that producers have increased capacity to deal with income losses. The funds are being used for a variety of purposes. Participants who took part in the 2016 BRM Survey who made a withdrawal between 2013 and 2015 reported using the funds for cash flow (51%), farm related expenses (28%), to offset a decline in income (24%), to make on-farm investments (24%) or reduce debts (22%). Surveyed producers indicated that the main benefits of AgriInvest are the ability to manage income losses (40%), increase savings (36%), manage cash flow (35%), and make on-farm investments (21%).
Key informants rated AgriInvest as somewhat effective in improving producers’ flexibility in managing risks and enhancing their capacity to deal with income losses (an average rating of 2.9 on a scale of 1 to 5). Many key informants, including provincial government and industry representatives, indicated that with a limit of $15,000, the AgriInvest matching contribution is not large enough to support any significant risk management investment or address an income loss as intended, especially given the increasing dominance of the agriculture sector by large farms and the fact that the large majority of the $2 billion in AgriInvest account balances are held by very large producers.
As illustrated in Figure 21, between 2008 and 2013, over one half (58%) of AgriInvest contributions were made by producers with sales revenues greater than $500,000. Producers with less than $100,000 in revenues accounted for only eight percent of total contributions, which is generally representative of farm sizes in the industry.
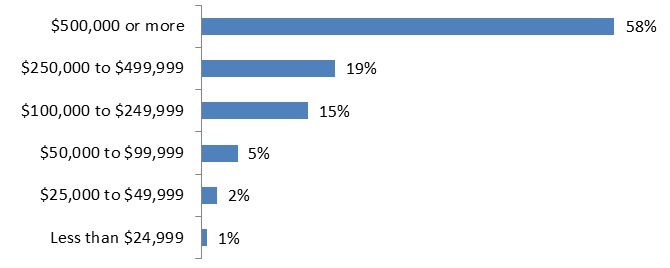
Description of above image
Figure 21 illustrates AgriInvest contribution by revenue class for the years 2008-2013.
| Revenue Class | % of Total AgriInvest Contributions |
|---|---|
| Less than $24,999 | 0.80% |
| $25,000 to $49,999 | 2.20% |
| $50,000 to $99,999 | 5.10% |
| $100,000 to $249,999 | 15.00% |
| $250,000 to $499,999 | 18.80% |
| $500,000 or more | 58.10% |
Source: AgriInvest program database
AgriInvest program guidelines do not stipulate that producers experiencing an income loss must withdraw funds from their AgriInvest account. The percentage of AgriInvest participants triggering an AgriStability payment and making a withdrawal averaged 42 percent during GF and was 47 percent during 2013 and 42 percent in 2014, well below the performance target of 60 percent. Several key informants indicated that due to the lack of a trigger for AgriInvest, an income decline sometimes does not result in an AgriInvest withdrawal, and some withdrawals are made for purposes other than to address income declines.
As shown in Table 7, 62 percent of the 2013 AgriInvest withdrawals were made by producers with revenues of $500,000 or more. As farm financial data reflects, large farms were experiencing positive market conditions with high prices, high net incomes and record profitability in 2013, suggesting the majority of the funds withdrawn were not likely used to address income losses. Due to strong market conditions and high commodity prices in recent years, AgriInvest’s effectiveness in helping producers manage financial risks associated with small income losses has not truly been tested.Footnote 36
| Number of Participants | % of Total Participants | Average AgriInvest Withdrawal | % of Total Withdrawals | |
|---|---|---|---|---|
| $1 million or more | 8,850 | 7% | $45,125 | 41% |
| $500K – 999K | 11,332 | 9% | $20,349 | 21% |
| $250K – 499K | 16,492 | 13% | $10,508 | 15% |
| Less than $250K | 92,177 | 71% | $3,225 | 23% |
| Source: AgriInvest Program Data | ||||
3.2.5 Collective impact of Business Risk Management programs
Although payments from government programs as a percentage of net income have declined as a result of high commodity prices in recent years, these payments continue to have a considerable impact on increasing producers’ net operating incomes.
Impact of the Business Risk Management programs on net operating income
Due to strong market conditions and high commodity prices, the total net market incomeFootnote 37 of farms in Canada has increased by 80 percent from approximately $5.5 billion in 2009 to $9.9 billion in 2014. As illustrated in Figure 23, this increase was offset by declining program payments from government programs and insurance proceeds such that total net operating income (NOI)Footnote 38 of all farms in Canada stabilized at approximately $12 billion from 2012 to 2014 (a 106% increase from $5.8 billion in 2014). Total payments from all government programs and insurance proceeds to producers declined from about $4.1 billion at the beginning of GF in 2007 to $2.1 billion in 2014.Footnote 39 Approximately three quarters of these payments were made by federal government programs. Private hail insurance accounted for about 10 percent of total payments to producers in 2014. The other payments to producers were from provincial government programs.
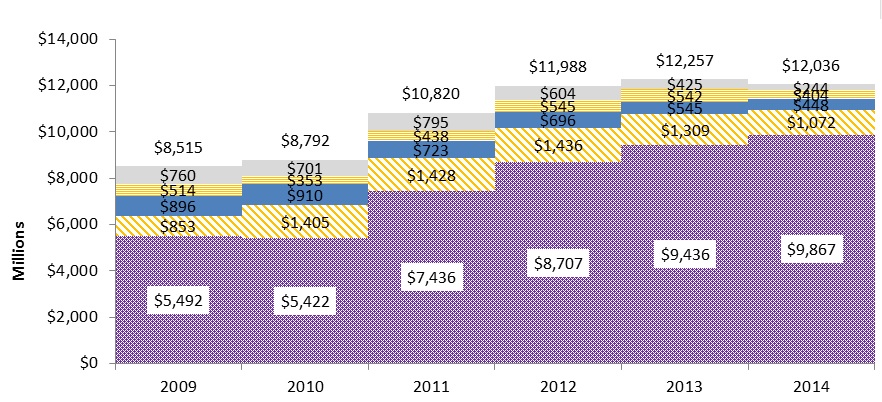
Description of above image
Figure 22 illustrates the impact of government program payments and insurance proceeds on net operating income of all farms in Canada by year from 2009 to 2014.
| Years | Net Market Income | AgriInsurance Indemnities | AgriStability Payments | AgriInvest Withdrawals | Others | Net Operating Income |
|---|---|---|---|---|---|---|
| 2009 | $5,491,527,688 | $852,841,326 | $896,166,939 | $513,954,923 | $760,413,167 | $8,514,904,043 |
| 2010 | $5,422,472,137 | $1,404,859,261 | $910,379,270 | $352,856,100 | $701,292,096 | $8,791,858,864 |
| 2011 | $7,436,493,265 | $1,427,623,027 | $722,697,486 | $438,406,743 | $795,116,088 | $10,820,336,609 |
| 2012 | $8,706,567,742 | $1,435,793,965 | $696,048,464 | $545,141,612 | $604,226,248 | $11,987,778,030 |
| 2013 | $9,435,831,570 | $1,309,104,636 | $544,796,140 | $541,884,855 | $424,922,485 | $12,256,539,687 |
| 2014 | $9,867,152,282 | $1,071,835,441 | $448,399,791 | $404,236,837 | $244,334,666 | $12,035,959,018 |
| Grand Total | $46,360,044,684 | $7,502,057,656 | $4,218,488,090 | $2,796,481,071 | $3,530,304,750 | $64,407,376,251 |
Source: Statistics Canada CANSIM Table 002-0076
While government program payments and insurance proceeds have accounted for a much smaller percentage of overall NOI in recent years, these funds have continued to have a significant impact on the NOI of producers. In 2014, the average program payments and insurance proceeds of $12,886 resulted in an increase in average farm NOI from $58,625 to $71,511 (Figure 23).
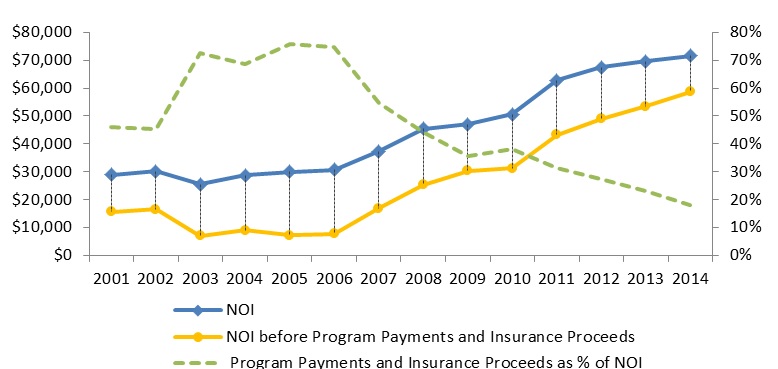
Description of above image
Figure 23 illustrates the impact of program payments and insurance proceeds on average farm net operating income of all farms in Canada by year from 2001 to 2014.
| Year | Net Operating Income | Net Operating Income before Payments and Proceeds | Payments and Proceeds as % of Net Operating Income |
|---|---|---|---|
| 2001 | $28,998 | $15,693 | 45.88% |
| 2002 | $30,250 | $16,507 | 45.43% |
| 2003 | $25,567 | $7,007 | 72.59% |
| 2004 | $28,784 | $8,986 | 68.78% |
| 2005 | $30,050 | $7,320 | 75.64% |
| 2006 | $30,655 | $7,789 | 74.59% |
| 2007 | $37,267 | $16,844 | 54.80% |
| 2008 | $45,495 | $25,402 | 44.17% |
| 2009 | $47,057 | $30,349 | 35.51% |
| 2010 | $50,534 | $31,167 | 38.32% |
| 2011 | $62,840 | $43,188 | 31.27% |
| 2012 | $67,402 | $48,953 | 27.37% |
| 2013 | $69,507 | $53,511 | 23.01% |
| 2014 | $71,511 | $58,625 | 18.02% |
| Average | $44,708 | $26,524 | 40.67% |
Source: Statistics Canada CANSIM Table 002 0044
Due to the preponderance of small farms and the high proportion of total market revenues earned by large farms, an analysis of average farm NOI is not as useful as an assessment of the average NOI of farms with revenues over $250,000, because this latter analysis more accurately depicts an operation primarily engaged in farming. An analysis of the average NOI of farms with revenues of over $250,000 indicates that the NOI varies significantly from one commodity group to another, with cattle producers having the lowest average NOI in 2014 ($87,810) (Figure 24). During the period from 2010 to 2014, hog producers transitioned from among the lowest to the highest average NOI (such as, from $102,590 to $378,820).
The range for each commodity group in the following chart depicts the difference between the group’s net income before payments and their net operating income after receiving government program payments and insurance proceeds. The inner line with the percentage values depicts the share of NOI attributable to the government payments and insurance proceeds in that year. As indicated in Figure 24, government program payments and insurance proceeds as a proportion of NOI have been highest for hog and cattle producers during most of the period from 2010 to 2014. This assistance has still not been sufficient to increase the NOI after program payments of the average cattle farm to the level experienced by the other commodity groups.
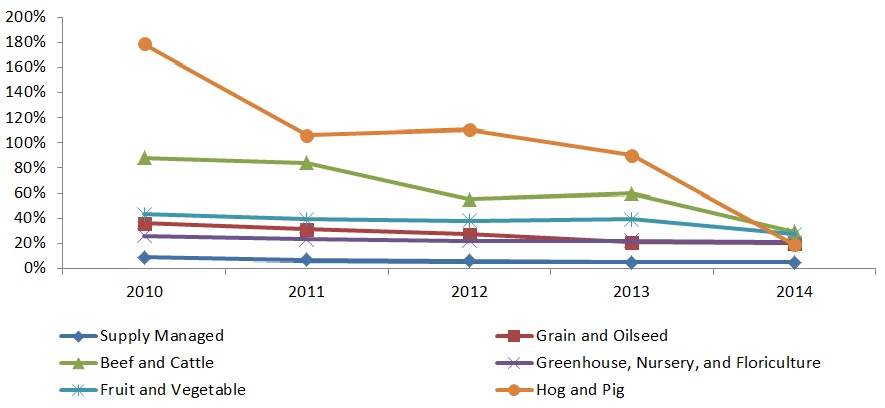
Description of above image
Figure 24 illustrates the impact of government program payments and insurance proceeds on the net income of producers with revenues of $250,000 or more by major commodity group by year from 2010 to 2014.
| Year | Supply Managed | Grain and Oilseed | Beef and Cattle | Greenhouse, Nursery, and Floriculture | Fruit, Potato and Vegetable | Hog and Pig |
|---|---|---|---|---|---|---|
| 2010 | 9% | 36% | 88% | 26% | 43% | 179% |
| 2011 | 7% | 31% | 84% | 23% | 39% | 106% |
| 2012 | 6% | 27% | 55% | 22% | 38% | 111% |
| 2013 | 5% | 21% | 60% | 22% | 39% | 90% |
| 2014 | 5% | 20% | 29% | 21% | 27% | 19% |
Source: Statistics Canada CANSIM Table 002 0044
Impact of the Business Risk Management programs on adaptability
Key informants reported that the BRM programs have not had a major impact in enhancing the adaptability of the agriculture sector, but the programs do not impede adaptation to market signals. When asked to rate the impact of the programs in enhancing adaptability on a scale of one to five where two is minimal and three is somewhat, the key informants provided an average rating of 2.7 for AgriStability, 2.8 for AgriInvest, 3.2 for AgriInsurance and 2.1 for the Wildlife Compensation Program. The majority of the key informants explained that the BRM suite does not impede innovation and provides producers sufficient time to adjust to market signals through financial assistance. The security provided through BRM programs could encourage producers to take risks with their commodities and grow higher value corps.
3.3 Performance - efficiency and economy
This section outlines the key findings and conclusions resulting from the evaluation related to the efficiency and economy of the four programs.
3.3.1 AgriInsurance
AgriInsurance is delivered efficiently and economically compared to other countries. However, increases in administrative costs, particularly in Alberta, combined with a decline in the number of insured contracts have resulted in a considerable increase in the administrative cost per contract over the last five years.
Comparison with other countries
AgriInsurance is being administered efficiently and economically compared to agricultural insurance schemes in most other countries. A 2008 World Bank study found that out of a sample of 29 countries, Canada's administrative costs at eight percent were second lowest in the world as measured by administrative costs as a percentage of premiums (Figure 25). Canada's administrative costs were considerably lower than other subsidized multi-peril crop insurance programs such as Brazil (36%), Mexico (30%), India (30%) and the U.S. (26%). Although a more recent survey has not been undertaken by the World Bank, Canada's administrative costs as a percentage of premiums have remained largely unchanged since 2008.Footnote 40
Achievement of efficiency targets
AgriInsurance is meeting all performance targets related to efficiency (Table 8).
| Performance Indicator | Target | 2013/14 Actual | 2014/15 Actual |
|---|---|---|---|
| Admin costs as a % of total coverage | Less than 2% | 0.7% | 0.7% |
| Admin costs as a % of total premiums | Less than 12% | 6% | 8% |
| Admin costs per contract | Less than $500 | $444 | $487 |
| % of payments processed within 30 days | 90% | 90% | 93% |
Source: AgriInsurance Performance Measurement Strategy Data |
|||
There are some limitations with the current AgriInsurance performance indicators. The indicators for administrative expenses as a percentage of total coverage and administrative expenses as a percentage of total premiums are impacted by increased commodity prices. As a result, significant increases in commodity prices result in significant decreases in administrative costs as a percentage of total coverage and premiums, suggesting considerable gains in efficiency which is not the case for the AgriInsurance program. A constraint to the performance target of $500 or less for the administrative cost per contract is that it is static and needs to be adjusted regularly to account for inflation. Some examples of more appropriate performance indicators are administration cost per acre and administration cost per contract.
While AgriInsurance is achieving all performance targets for efficiency, the program's total administrative costs increased 15 percent or $15.9 million from 2010/11 to 2014/15 (Table 9). Approximately 87 percent or $13.9 million of this increase is due to a 52 percent increase in Alberta's administrative costs from 2010/11 to 2014/15. During the past five years, the number of insured contracts has decreased by six percent. The combined impact of an increase in administration costs and a decrease in the number of insurance contracts has resulted in a 23 percent increase in the cost per insurance contract from $397 in 2010/11 to $487 in 2014/15 (Table 9).
| Category | 2010/11 | 2011/12 | 2012/13 | 2013/14 | 2014/15 |
|---|---|---|---|---|---|
| Federal Share | $61.6M | $65.3M | $67.3M | $68.0M | $71.2M |
| Provincial Share | $41.1M | $43.5M | $44.8M | $45.3M | $47.4M |
| Total AgriInsurance Administration Costs | $102.7M | $108.8M | $112.1M | $113.3M | $118.6M |
| Administration Costs per Farm Insured | $1,284 | $1,379 | $1,440 | $1,476 | $1,599 |
| Number of Farms Insured | 80,016 | 78,893 | 77,901 | 76,742 | 74,144 |
| Number of Contracts | 258,867 | 252,250 | 253,937 | 256,918 | 243,371 |
| Administration Costs Per Contract | $397 | $431 | $442 | $441 | $487 |
| Source: AAFC Winnipeg Program Data | |||||
As indicated in Figure 25, Alberta's administrative cost per contract increased by 58 percent from $364 in 2010/11 to $575 in 2014/15. In comparison, the increase in administrative costs per contract among the four other provinces with the largest number of insured farms averaged nine percent. Ontario had the second highest administrative cost per contract at $542 in 2014/15. Both Alberta and Ontario exceeded the performance measurement target of $500 per contract during GF2.
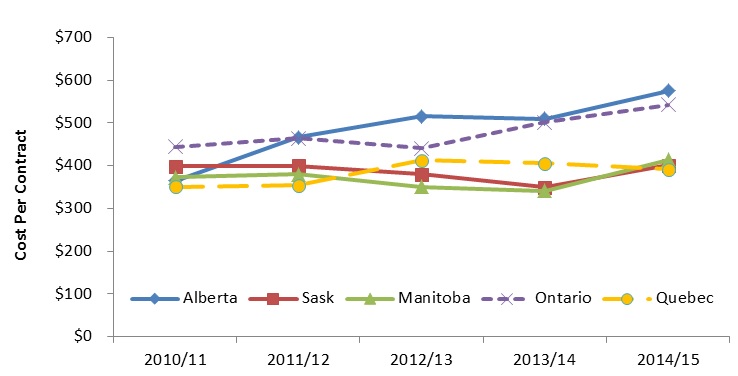
Description of above image
Figure 25 illustrates the administrative costs of AgriInsurance per contract for the five largest provinces by year from 2010/11 to 2014/15.
| Year | Alberta | Saskatchewan | Manitoba | Ontario | Quebec |
|---|---|---|---|---|---|
| 2010/11 | 364 | 373 | 373 | 444 | 350 |
| 2011/12 | 466 | 400 | 380 | 464 | 354 |
| 2012/13 | 516 | 380 | 351 | 440 | 413 |
| 2013/14 | 510 | 349 | 341 | 502 | 406 |
| 2014/15 | 575 | 414 | 414 | 542 | 391 |
Source: AAFC Winnipeg Program Data
An analysis of administrative expenses indicates that Alberta's costs were higher than the four other provinces with the largest number of insured farms in a number of cost categories including processing operations, adjusting operations, system maintenance, and accommodations, as well as capital expenditures. Key informant interviews with federal and provincial government representatives indicated that higher salaries and salary bonuses in the last five years have contributed to higher administrative costs in Alberta than in comparable jurisdictions.
3.3.2 Wildlife Compensation Program
The administrative costs per claim of the Wildlife Compensation Program are high due to the cost of the on-farm inspection needed to comply with the federal requirement for evidence of loss. Due to the preponderance of small claims, the administration costs as a proportion of program funding are higher for the Wildlife Compensation Program than the other programs evaluated.
Program administrative costs
The Wildlife Compensation Program's total administrative costs declined from a high of approximately $6.0 million in 2010/11 to a low of $4.2 million in 2014/15. During this five-year period, an average of 12,695 claims per year was processed (Figure 26).
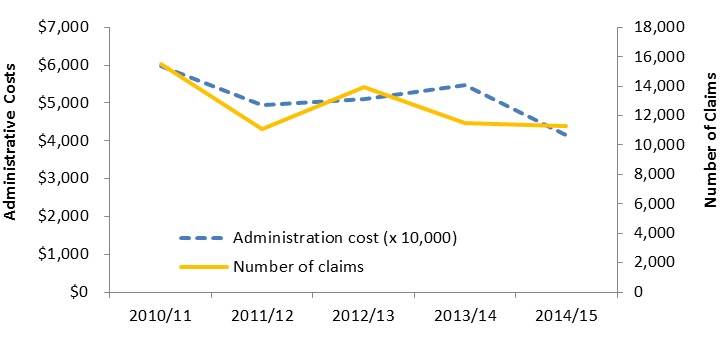
Description of above image
Figure 26 illustrates the relationship between the number of claims and the administration cost in $10,000
| Variable | 2010/11 | 2011/12 | 2012/13 | 2013/14 | 2014/15 |
|---|---|---|---|---|---|
| Administration cost (in $10,000) | $5,972 | $4,936 | $5,093 | $5,486 | $4,153 |
| Number of claims | 15,530 | 11,089 | 13,953 | 11,464 | 11,260 |
Between 2010/11 and 2014/15, the average administrative cost per claim was $405 for all participating provinces. The cost per claim was lowest in Ontario ($112) and Manitoba ($167) and highest in British Columbia ($3,204) (Figure 28).
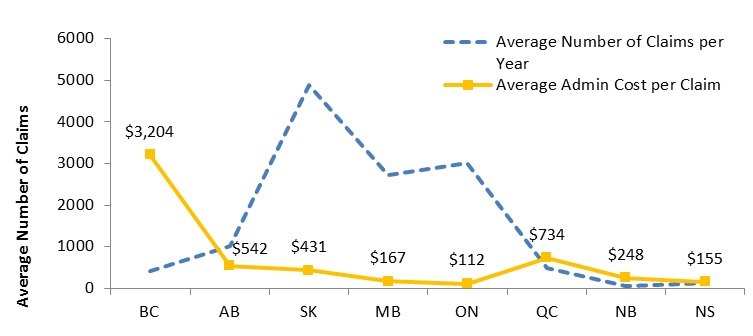
Description of above image
Figure 27 illustrates the average number of claims per year and average administrative cost per claim for each province for 2010/11 to 2014/15
| Province | Average Number of Claims per Year | Average Admin Cost per Claim |
|---|---|---|
| British Columbia | 406 | $3,204 |
| Alberta | 1,020 | $542 |
| Saskatchewan | 4,885 | $431 |
| Manitoba | 2,720 | $167 |
| Ontario | 3,008 | $112 |
| Quebec | 484 | $734 |
| New Brunswick | 44 | $248 |
| Nova Scotia | 128 | $155 |
Source: AAFC Winnipeg Program Data
A major contributing factor to the comparatively high administrative cost per claim is the high proportion of small claims. Between 2010/11 and 2014/15, the average claim amount across all participating provinces was $2,204. Average claim amounts were highest in New Brunswick ($7,017), Alberta ($5,962) and British Columbia ($5,146) and lowest in Ontario ($529) and Nova Scotia ($999). Approximately 38 percent of all claims paid during the past five years were for less than $500 (Figure 28). For most of these claims, the $405 administrative cost was equal to or greater than the claim amount. Almost two-thirds (62%) of all claims paid between 2010/11 and 2014/15 were for less than $1,000.
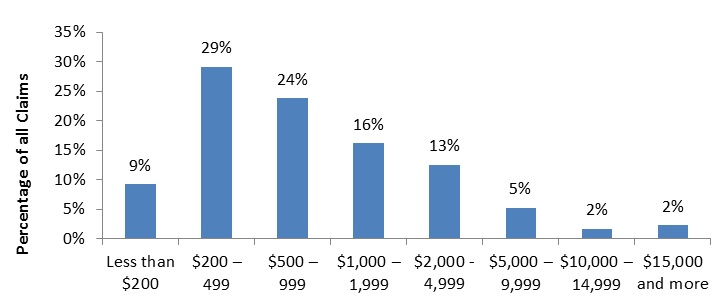
Description of above image
Figure 28 illustrates the proportion of Wild life Compensation Program claim size as percentage of all claims for 2010/11 to 2014/15.
| Claim Size | % of all claims |
|---|---|
| Less than $200 | 9.20% |
| $200 – 499 | 29.20% |
| $500 – 999 | 23.80% |
| $1,000 – 1,999 | 16.20% |
| $2,000 - 4,999 | 12.50% |
| $5,000 – 9,999 | 5.20% |
| $10,000 – 14,999 | 1.70% |
| $15,000 and more | 2.30% |
Source: AAFC Winnipeg Program Data
The other major contributing factor to the Wildlife Compensation Program's high administrative costs per claim is the federal requirement that on-farm inspections be undertaken to verify the loss to prevent moral hazard. The need to conduct on-farm inspections to verify each loss drives up administrative costs. One of the primary reasons why British Columbia's average administrative cost per claim ($3,204) is so much higher than the other provinces is the greater amount spent on professional and special services which includes the contracting of Environmental Conservation Officers to conduct wildlife damage assessments.
The total administrative cost as a percentage of program funding is considerably higher for the Wildlife Compensation Program compared to the other programs evaluated. Between 2010/11 and 2014/15, the Wildlife Compensation Program's administrative costs as a proportion of total funding averaged 20 percent, compared to 15 percent for AgriStability, seven percent for AgriInsurance and five percent for AgriInvest (Figure 29).
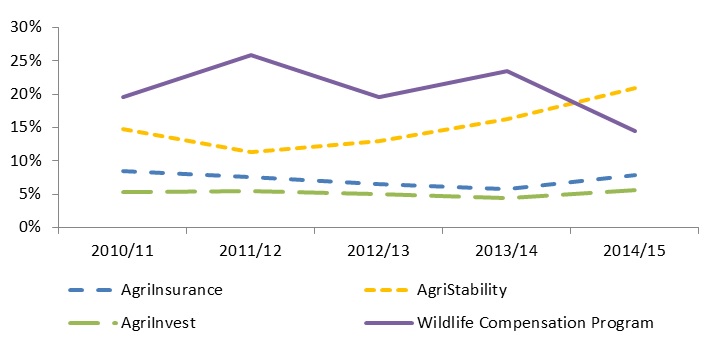
Description of above image
Figure 29 compares the administrative cost as a percentage of claim amount for AgriInvest, AgriInsurance, AgriStability, and the Wildlife Compensation Program.
| AgriInsurance | AgriStability | AgriInvest | Wildlife Compensation Program | |
|---|---|---|---|---|
| 2010/11 | 8.40% | 14.70% | 5.30% | 19.60% |
| 2011/12 | 7.50% | 11.30% | 5.40% | 25.80% |
| 2012/13 | 6.50% | 13.00% | 5.00% | 19.60% |
| 2013/14 | 5.80% | 16.20% | 4.40% | 23.50% |
| 2014/15 | 7.80% | 20.90% | 5.60% | 14.40% |
Source: AAFC Winnipeg Program Data
The federal and provincial government representatives interviewed suggested the Wildlife Compensation Program is as efficient as possible given its current design and the federal requirement for verification of loss. The suggestions provided by key informants to improve the Program's economy include adopting a minimum claim value, reducing the requirements for on-farm verification of loss for claims below a specific value threshold, disallowing multiple claims from the same producer for the same damages, and/or getting statutory declaration with spot inspections.
3.3.3 AgriStability
For the most part, AgriStability is delivered as efficiently and economically as possible, given the administrative complexity of the program. While there exist some opportunities to share best practices across jurisdictions, significant gains in efficiency would require modifications to reduce the administrative complexity and costs in line with the transition from an income stabilization program to a disaster assistance program.
Achievement of efficiency targets
As indicated below, AgriStability is currently meeting only one of three performance targets for efficiency (Table 10). The overall fiscal year administrative costs decreased five percent in 2013/14 and four percent in 2014/15, compared to their annual performance measurement target of no increase greater than inflation (+1.9% in 2013/14 and +1.6% in 2014/15).
| Performance Indicator | Target | 2013/14 Actual | 2014/15 Actual |
|---|---|---|---|
| Overall fiscal year administrative costs increase/decrease | No cost increase exceeding the inflation rate | -5% (average annual inflation rate of 1.9%) |
-4% (average annual inflation rate of 1.6%) |
| Fiscal year administrative cost per completed file | Current year costs not exceed the previous 3 year average costs adjusted for inflation | $1,057 (target of $926) |
$1,036 (target of $963) |
| Percent of applications processed within the 75 day service standard | 75% | 68% | N/A |
| Source: AgriStability Performance Measurement Strategy Data | |||
As shown in Figure 30, the administrative costs of the AgriStability program have declined by 13 percent from $90.3 million in 2010/11 to $78.4 million in 2014/15. During this same period, there has been a 22 percent decline in the number of AgriStability applications processed annually. Due to the resulting losses of economies of scale, the administrative cost per completed file has increased by 11 percent from $918 in 2010/11 to $1,022 in 2014/15.
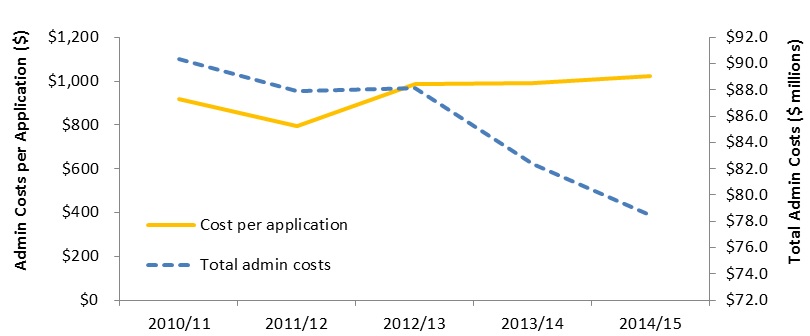
Description of above image
Figure 30 illustrates the administrative costs for AgriStability by year from 2010/11 to 2014/15
| Year | Total admin costs in millions | Cost per application |
|---|---|---|
| 2010/11 | $90.3 | $918 |
| 2011/12 | $87.9 | $796 |
| 2012/13 | $88.2 | $986 |
| 2013/14 | $82.3 | $991 |
| 2014/15 | $78.5 | $1,022 |
Source: AgriStability Performance Measurement Strategy Data
Due to the transition from an income stabilization program to a disaster assistance program in GF2, the number and value of AgriStability payments to producers has been reduced in 2013 and will likely continue in subsequent years. However, the administrative costs to process the AgriStability applications have not been reduced sufficiently because similar program delivery processes are still being employed. The administration procedures have not been changed to reflect the transition from an income stabilization program to a disaster reduction program (such as, information is still being collected annually on producer income and expenses). Consequently, administrative costs as a percentage of the payments to producers have increased from by 42 percent from 15 percent in 2010/11 to 21 percent in 2014/15 (Figure 31).

Description of above image
Figure 31 illustrates administrative costs as a percentage of AgriStability payments by year from 2010/11 to 2014/15
| Year | Administrative Costs | Payments to producers | Admin costs as a % of producer payments |
|---|---|---|---|
| 2010/11 | $90.34 | $615.00 | 14.70% |
| 2011/12 | $87.89 | $778.40 | 11.30% |
| 2012/13 | $88.16 | $678.60 | 13.00% |
| 2013/14 | $82.34 | $509.30 | 16.20% |
| 2014/15 | $78.45 | $374.70 | 20.90% |
Source: AgriStability Performance Measurement Strategy Data
While there exist some opportunities to share best practices across jurisdictions, such as the use of online form submissions and leveraging of information technology and other administrative costs with other programming, differences in efficiency across jurisdictions are largely the result of differences in economies of scale across the administrations. As shown in Figure 32, the highest administrative costs per application in 2014/15 were incurred by BC ($2,033), followed by AAFC Winnipeg ($1,731) and PEI ($1,577), due primarily to the low number of applications handled compared to other jurisdictions. Some other factors contributing to the higher than average costs of AAFC Winnipeg are challenges administering the program in jurisdictions with very different agricultural production (such as, Manitoba and the Maritimes), higher salaries than provincial counterparts, and declining volumes to share IT systems and other overhead costs. Québec, in comparison, incurred the lowest administrative costs per application ($409), primarily due to joint delivery with Québec's Assurance stabilisation des revenus agricoles thereby resulting in the sharing of administrative costs.
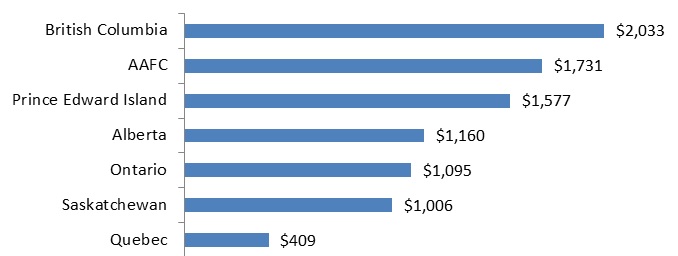
Description of above image
Figure 32 compares the AgriStability administrative cost per application for different jurisdiction in 2014.
| Province | Administrative Cost per Application |
|---|---|
| Quebec | $409 |
| Saskatchewan | $1,006 |
| Ontario | $1,095 |
| Alberta | $1,160 |
| Prince Edward Island | $1,577 |
| AAFC | $1,731 |
| British Columbia | $2,033 |
Source: AAFC Winnipeg Program Data
The previous evaluation recommended that AAFC work with the provinces and territories to determine the most appropriate, cost-efficient delivery model for AgriStability for the remaining four provinces and one territory in which AAFC delivers, including the consideration of non-AAFC delivery models. While an extensive analysis was undertaken of possible options, it was decided that the current delivery model is the most appropriate and cost efficient given the current program design.
Program documents and interviews with federal and provincial program administrators show that AgriStability's design, which includes the calculation of payments based on individual farm finances, requires a very extensive set of benchmarks and indicators that impedes the program's administrative efficiency, timeliness and transparency. As indicated in Figure 33, the administrative cost per farm of the AgriStability program is less than administrative cost per farm insured for the AgriInsurance program but greater than the administration cost per AgriInsurance contract processed (such as, farms typically have several insurance contracts). Due to the complexity of the AgriStability program, the administrative cost per farm of the AgriStability program is considerably higher than the AgriInvest and Wildlife Compensation Program. Any significant gains in the efficiency of the AgriStability program would require modifications to reduce the administrative complexity and costs in line with the transition from an income stabilization program to a disaster assistance program. The scope of the evaluation did not include an assessment of the program design options to streamline and transition AgriStability from an income stabilization program to a disaster reduction program. To do so, AAFC would need to undertake extensive consultations with the provinces since the provinces are responsible for delivering AgriStability in most regions and pay 40 percent of the cost of the program.
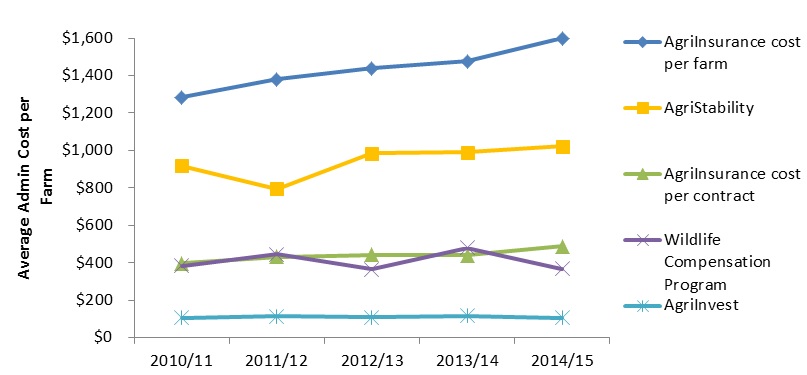
Description of above image
Figure 33 compares the program administrative costs in millions per farm processed for each program by year from 2010/11 to 2014/15.
| Year | AgriInsurance cost per farm | AgriStability | AgriInsurance cost per contract | Wildlife Compensation Program | AgriInvest |
|---|---|---|---|---|---|
| 2010/11 | 1,284 | 918 | $397 | 385 | 105 |
| 2011/12 | 1,379 | 796 | $431 | 445 | 113 |
| 2012/13 | 1,440 | 986 | $442 | 365 | 108 |
| 2013/14 | 1,476 | 991 | $441 | 479 | 117 |
| 2014/15 | 1,599 | 1,022 | $487 | 369 | 107 |
Source: AAFC Winnipeg Program Data
Note: AgriInsurance is program administration costs per contract and farm
3.3.4 AgriInvest
AgriInvest is delivered efficiently as a result of its simple design and highly streamlined and automated delivery. The program's cost-effectiveness, however, is impeded by the high proportion of participants that make very small contributions. Many of the AgriInvest deposits are too small to justify the administrative expenditure to process and pay the government contribution.
Achievement of efficiency targets
AgriInvest is delivered efficiently as a result of its simple design and highly streamlined and automated delivery. As shown in Table 11, the program is meeting all performance targets related to efficiency.
| Performance Indicator | Target | 2013/14 Actual | 2014/15 Actual |
|---|---|---|---|
| Fiscal year overall administration cost increase | Cost increases will not exceed inflation rate on a national basis | −2% (average annual inflation rate of 1.9%) |
−2% (average annual inflation rate of 1.6%) |
| Fiscal year administration costs per completed file | Current year costs will not exceed previous 3-year average costs adjusted for inflation | $115 (target of $116) |
$112 target of $115) |
| Percentage of applications processed within 45 days | 80% | 95% | 94% |
| Source: AgriInvest Performance Measurement Strategy Data | |||
The administrative costs of the AgriInvest program have declined by 17 percent from $19.3 million in 2010/11 to $16.1 million in 2014/15 (Figure 34). This was primarily due to an 18 percent decline in the number of participants from 183,862 in 2010/11 to 150,694 in 2014/15. The cost per application has remained fairly stable during this period.
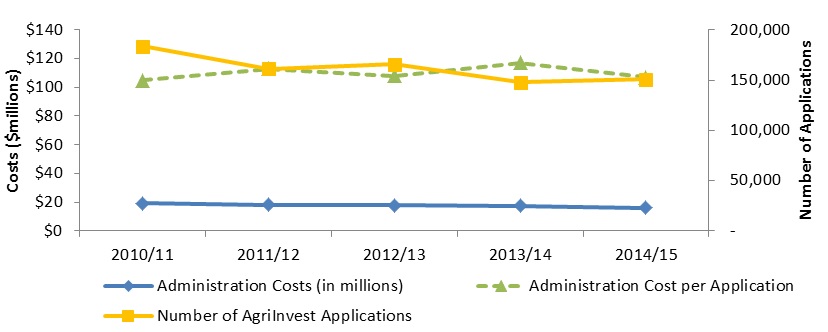
Description of above image
Figure 34 illustrates the number of applications and the administration costs for AgriInvest by year from 2010/11 to 2014/15.
| Year | Administrative Costs ($ millions) | Administrative Cost per Application | Number of AgriInvest Applications Processed |
|---|---|---|---|
| 2010/11 | $19.30 | $105 | 83,862 |
| 2011/12 | $18.27 | $113 | 61,504 |
| 2012/13 | $17.95 | $108 | 65,934 |
| 2013/14 | $17.39 | $117 | 48,005 |
| 2014/15 | $16.10 | $107 | 50,694 |
Source: AAFC Winnipeg Program Data
AgriInvest administrative costs as a percentage of government contributions have also remained quite stable over the last five years, ranging from a low of 4.4 percent in 2013/14 to a high of 5.6 percent in 2014/15 (Figure 35). The slight increase shown from 2013/14 to 2014/15 is partly due to the GF2 reduction in the payment rate from 1.5 to one percent of ANS.
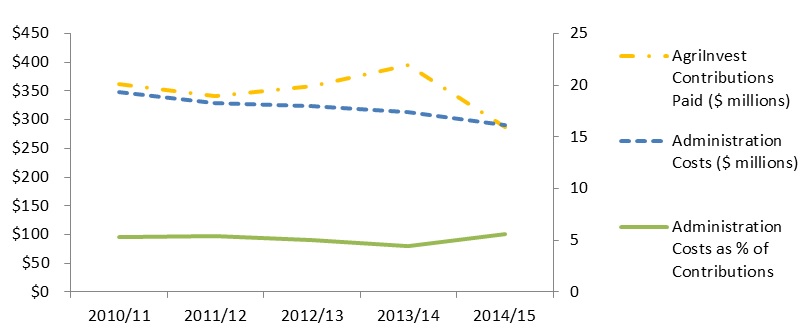
Description of above image
Figure 35 illustrates the administrative costs for AgriInvest as a percentage of AgriInvest contributions by year.
| Year | Administration Costs ($ millions) | AgriInvest Contributions Paid ($ millions) | Administration Costs as a percentage of Contributions |
|---|---|---|---|
| 2010/11 | 19.30 | $362.60 | 5.30 |
| 2011/12 | 18.27 | $341.40 | 5.40 |
| 2012/13 | 17.95 | $358.60 | 5.00 |
| 2013/14 | 17.39 | $395.60 | 4.40 |
| 2014/15 | 16.10 | $287.00 | 5.60 |
Note: There is a one year lag in data as AAFC Winnipeg reports using Canadian Revenue Agency tax file data rather than program year data.
Source: AAFC Winnipeg Program Data
While the program administration is efficient, AgriInvest's economy is impeded by the high proportion of participants that make very small contributions, resulting in comparatively high administrative costs for limited program benefits. As shown in Table 12, contributions ranging from $75 to $1,000 accounted for about one half (47%) of the total number of contributions processed in 2014/15 while contributions less than $500 accounted for about 30 percent of total AgriInvest contributions.
| Contribution Amount | # of Contributions | % of Contributions | Total Contributions ($ millions) |
% of Total Contributions Value |
|---|---|---|---|---|
| $75-$99 | 2,615 | 2.8% | $0.2 | 0.1% |
| $100-$499 | 25,495 | 27.4% | $7.0 | 2.8% |
| $500-$999 | 16,219 | 17.4% | $11.7 | 4.6% |
| $1,000-$4,999 | 33,398 | 35.9% | $78.3 | 31.2% |
| $5,000-$9,999 | 8,774 | 9.4% | $61.5 | 24.5% |
| $10,000 and more | 6,609 | 7.1% | $92.6 | 36.8% |
| Total | 93,109 | 100.0% | $251.4 | 100.0% |
Source: AgriInvest Program Data Note: This table excludes contributions from Quebec. |
||||
As the average administrative cost to process an AgriInvest contribution was $107 in 2014/15, many of these AgriInvest deposits are too small to justify the administrative expenditure to process and pay the government contribution. The ratio of administrative costs to process an AgriInvest contribution compared to the average amount of an AgriInvest contribution was about 25 percent for the 44,328 contributions less than $1,000 and 41 percent for contributions less than $500 in 2014/15.
The current minimum contribution for AgriInvest is $75. As a comparison, a minimum contribution value of $1,000 has been used by a similar program in Australia (such as, Farm Management Deposit Scheme) to reduce administrative costs. Savings in administrative costs, therefore, could be obtained by increasing the minimum contribution to a level such as that used in Australia (such as, $1,000). However, the savings would not likely be proportional to the reduction in number of applications processed due to the fixed costs associated with the highly automated nature of application processing.
4.0 Conclusions and recommendations
4.1 Conclusions
Relevance
While the Canadian agriculture sector has performed very well in recent years, there is a continued need for the BRM programs to help producers manage risks associated with severe market volatility and disaster situations. Many of the risks that can threaten the viability of a farm operation or commodity group are ongoing or cyclical and are often beyond the control of the producers. Private sector and producer-led tools and support mechanisms are insufficient in managing those risks beyond the control of the producers.
The appropriate role of the BRM programming is to provide disaster level support and encourage producers and the private sector to develop tools and strategies to manage normal business risk. This is in line with best practices identified by the Organisation for Economic Co-operation and Development (OECD) and trends in government agricultural support in the United States, Australia and the European Union.
AgriInsurance, AgriStability and AgriInvest are aligned with federal roles and responsibilities legislated in the Farm Income Protection Act. The Wildlife Compensation Program is somewhat aligned with federal responsibilities, as there is a weak policy rationale for providing compensation for non-federally protected species. AgriInvest and the Wildlife Compensation Program are less aligned with GF2 priorities and BRM principles due to their design as entitlement programs that primarily cover or compensate for normal business risks. Some AgriInsurance products covering some normal risk are less aligned with GF2 strategic priorities and the appropriate role of BRM programming.
The four programs are designed, in combination with other GF2 BRM programs, to cover different risk types, levels, frequencies of occurrence and intended end uses. Linkages exist between programs to ensure producers are not compensated multiple times for the same loss. Although there is no direct duplication or overlap of programming, similarly designed programs are offered in Ontario and Québec that function as additional coverage provided by AgriInsurance, AgriStability and AgriInvest.
Performance - effectiveness
AgriInsurance is very effective in mitigating the financial impact of production losses for producers of eligible commodities. Participation has remained very high during GF and GF2 and producers are very satisfied with the program. While insurance products are widely available for most major commodities, they are not currently available for cattle and hogs, with the exception of forage insurance for cattle producers. AgriInsurance premiums paid by the federal and provincial governments more than doubled between 2007/08 and 2013/14 due to an increase in the value of agricultural production insured, a move to higher value crops and an increase in the number of acres insured.
The Wildlife Compensation Program is effective in providing financial assistance for production losses due to wildlife damage of crops and predation of livestock. There is insufficient evidence of whether producers who receive compensation make efforts to prevent a recurrence of losses. The program has expanded beyond its original policy rationale to compensate for federally protected waterfowl species and has no direct linkages to AgriInsurance outside of Québec.
While AgriStability payments have been effective in mitigating the financial impacts of large short-term income losses, declining participation has limited the number of beneficiaries and the number and value of payments has been further reduced by the GF2 changes. The percentage of market revenues covered has not declined as significantly as the number of participants due to higher participation rates among large producers. More years of program data are required to undertake a comprehensive assessment of the effectiveness of the program and the impact of the changes made in GF2 to the AgriStability program.
AgriInvest is somewhat effective in affording producers greater flexibility in managing financial risks and increasing producers' capacity to deal with income losses. Participation in the program is high and producers are setting aside funds. Since the program does not stipulate that the funds withdrawn must be used to offset income losses, it is difficult to ensure that these funds are being used to manage financial risks, deal with small income losses or make investments to reduce on-farm risks.
Although payments from government programs as a percentage of net income have declined as a result of high commodity prices in recent years, these payments continue to have a considerable impact on increasing producers' net operating incomes. The support provided by BRM programs has not significantly enhanced the adaptability of the agriculture sector but rather to give producers time to adjust to market signals.
Performance - efficiency and economy
AgriInsurance is delivered efficiently and economically compared to other countries. However, increases in administrative costs and combined with a decline in the number of insured contracts have resulted in a considerable increase in the administrative cost per contract from 2010/11 to 2014/15.
The administrative costs per claim of the Wildlife Compensation Program are high due to the cost of the on-farm inspection needed to comply with the federal requirement for evidence of loss. Due to the preponderance of small claims, the administration costs as a proportion of program funding are higher for the Wildlife Compensation Program than the other programs evaluated.
For the most part, AgriStability is delivered as efficiently and economically as possible, given the administrative complexity. While there exist some opportunities to share best practices across jurisdictions, significant gains in efficiency would require modifications to reduce the administrative complexity and costs in line with the transition from an income stabilization program to a program that covers more severe and catastrophic losses rather than normal business risks.
AgriInvest is delivered efficiently as a result of its simple design and highly streamlined and automated delivery. The program's economy, however, is impeded by the high proportion of participants that make very small contributions. Many of the AgriInvest deposits are too small to justify the administrative expenditure to process and pay the government contribution. Savings in administration costs could be obtained by increasing the minimum contribution.
4.2 Recommendations and management response and action plan
The key issues and recommendations resulting from the evaluation findings are as follows:
4.2.1 AgriInsurance
- Issue #1:
In response to OECD-identified best practices in government agricultural support and the sector's increased capacity for managing normal business risk, GF2 objectives were revised to target government support to more severe and catastrophic losses and encourage producers to manage normal business risks. As identified in the 2011 OECD thematic review of Canadian risk management and AAFC's internal review of AgriInsurance risk coverage, some AgriInsurance products are covering some normal business risk.
- Recommendation #1:
AAFC should work with the provinces to examine options to modify products identified as covering normal business risk to transfer greater responsibility to producers and better align the coverage levels provided by AgriInsurance with current GF2 objectives and BRM principles.
- Management response and action plan #1:
Agreed. The findings and recommendations will be brought to the attention of provincial and territorial colleagues at the BRM Working Group and Policy ADM level, and will support a discussion of coverage levels under AgriInsurance. Any proposed changes would be considered under FPT negotiations for the next policy framework. However, as under previous policy frameworks, there is considerable support at the industry and government levels for insurance type approaches to risk management and AgriInsurance in particular. Insurance is seen as respecting the principle of producers to proactively managing risk while providing timely and predictable coverage. Given this, there may be resistance to proposals to change a program that is considered to be working.
- Target date for completion: March 31, 2018
- Responsible position: Director General, Business Risk Management Programs Directorate, Programs Branch
- Recommendation #1:
- Issue #2:
As a result of recent increases in commodity prices, an ongoing transition to higher value crops and increases in insured acreage, the total AgriInsurance premiums paid by the federal and provincial governments almost doubled from $565.7 million in 2007/08 to $924 million in 2014/15. While AgriInsurance is for the most part delivered efficiently and economically, increases in administrative costs combined with a decline in the number of insured contracts, resulted in a 23 percent increase in the administrative cost per insurance contract over the last five years.
- Recommendation #2:
While some efforts to control costs have been undertaken, AAFC should work with the provinces to identify additional cost-control mechanisms to prevent significant increases in AgriInsurance administrative costs as well as in government premiums should commodity prices and the total value of agricultural production insured continue to increase.
- Management response and action plan #2:
Agreed. AAFC will continue the current cost-control measures and will share the recommendation on the need for further controls with the FPT Business Risk Management Working Group and PT Policy ADMs. Any changes would be negotiated in the context of the next policy framework and would be included in the next framework agreement.
- Target date for completion: March 31, 2018
- Responsible position: Director General, Business Risk Management Programs Directorate, Programs Branch
- Recommendation #2:
- Issue #3:
There are limitations with the current AgriInsurance performance indicators for efficiency. As an illustration, one indicator is program administrative expenses as a percentage of total premiums. Because premiums have increased considerably in recent years due to increased commodity prices, this performance indicator shows a decrease in administration costs as a percentage of premiums which does not reflect changes in AgriInsurance administrative costs.
- Recommendation #3:
AAFC should work with the provinces to refine the performance measures used to assess the efficiency and economy of the administrative costs to deliver AgriInsurance.
- Management response and action plan #3:
Agreed. AAFC will negotiate with PTs for a commitment to refine performance indicators under the Next Policy Framework. This will include measures to assess the efficiency and administrative costs of the programs.
- Target date for completion: March 31, 2018
- Responsible Position: Director General, Business Risk Management Programs Directorate, Programs Branch
- Recommendation #3:
4.2.2 Wildlife Compensation Program
- Issue #4:
The administrative costs per claim of the Wildlife Compensation Program are high due to the cost of the on-farm inspection needed to comply with the federal requirement for evidence of loss. Due to the preponderance of small claims, administration costs as a proportion of program funding are higher for the Wildlife Compensation Program than the other programs evaluated.
- Recommendation #4
AAFC should work with the provinces to reduce administrative costs by adopting a minimum claim amount (for example, $1,000) or charging an application processing fee. Additional opportunities to save on administrative costs should be investigated including reducing federal requirements for on-farm inspection and verification of loss, eliminating payments for recurrent losses, pooling of small claims until they reach the minimum amount, and promoting initiatives to enhance producer preventative efforts to reduce or eliminate the need for compensation.
- Management response and action plan #4:
Agreed. AAFC will continue to seek administrative efficiencies in BRM programs. AAFC will present the recommendation to PTs and pursue changes to reduce administrative costs associated with Wildlife Compensation through FPT negotiations.
- Target date for completion: March 31, 2018
- Responsible position: Director General, Business Risk Management Programs Directorate, Programs Branch
- Recommendation #4
- Issue #5:
The Wildlife Compensation Program has expanded beyond its original policy rationale to only compensate for federally protected waterfowl species and has no direct linkages to AgriInsurance outside of Québec. Québec is the only province that exclusively compensates producers for damages resulting from federally protected species, as originally intended, while damages from other wildlife species are compensated as insurable perils under AgriInsurance. In all other participating provinces, the Wildlife Compensation Program covers federally protected waterfowl species as well as a wide variety of non-federally protected wildlife species.
- Recommendation #5:
AAFC should work with the provinces to continue to investigate the feasibility of including wildlife damages as an insurable peril under AgriInsurance and restricting eligible wildlife to those species protected under federal legislation to better align with government mandates and responsibilities.
- Management response and action plan #5:
Agreed. The recommendation will be brought to the attention of provincial and territorial colleagues through the BRM Working Group and FPT ADMs and the role of FPT governments in wildlife compensation will be considered during the FPT negotiations. Any proposed changes would be considered for the next policy framework.
- Target date for completion: March 31, 2018
- Responsible position: Director General, Business Risk Management Programs Directorate, Programs Branch
- Recommendation #5:
4.2.3 AgriStability
- Issue #6:
AgriStability's design, which includes the calculation of payments based on individual farm finances, requires a very extensive set of benchmarks and indicators that impedes the program's administrative efficiency, timeliness and transparency. Due to the transition from an income support program to assisting producers in dealing with market volatility and disasters in GF2, the number and value of AgriStability payments to producers has decreased in 2013 and will likely continue at this level in subsequent years. However, the administrative costs to process the AgriStability applications have not been reduced proportionately because similar program delivery processes are still being employed. Consequently, administrative costs as a percentage to the payments to producers have increased from 15 percent in 2010/11 to 21 percent in 2014/15. While there appear to exist opportunities to reduce administrative costs by streamlining existing processes and sharing best practices across the provinces, significant gains in efficiency would require a major change in the design of the program or administrative approach to reduce administrative complexity and costs in line with its new focus under GF2.
- Recommendation #6:
AAFC should work with the provinces to examine options to reduce AgriStability complexity and, in turn, decrease administrative costs. This will require a re-design of the program to reflect the transition from an income support program to providing producers assistance under severe situations. This could potentially decrease the frequency and amount of information that must be collected from producers as well as reduce program administrative costs.
- Management response and action plan #6:
Agreed. In July 2016, FPT Ministers of Agriculture outlined in the Calgary Statement that governments should seek ways to improve participation, timeliness, simplicity and predictability to ensure producers have access to support when needed.
AAFC, in collaboration with PTs, will consider changes to AgriStability to reduce the administrative burden and associated costs. Any proposed changes would require provincial/territorial agreement and would be negotiated in the context of the next policy framework.
- Target date for completion: March 31, 2018
- Responsible position: Director General, Business Risk Management Programs Directorate, Programs Branch
- Recommendation #6:
- Issue #7:
The number of producers participating in AgriStability has consistently declined over the past seven years from 57 percent in the 2007 program year to 33 percent in 2014. However, the percentage of market revenues covered by AgriStability participants (another measure of participation rate) has not declined as dramatically (such as, from 75% in 2007 to 55% in 2014) as a result of high participation rates among large producers. The decrease in participation rate and coverage of the AgriStability program exposes the industry to more risk and increases the potential demand for ad hoc support. Producer participation is expected to remain low (as forecast by AAFC) if significant steps are not taken to make the program more predictable and less complex, expensive and cumbersome to apply.
- Recommendation #7:
AAFC and the provinces should monitor the participation rate of producers in AgriStability to ensure that the program provides coverage to producers in need to avert the need for ad-hoc programming and payments. Analysis should be undertaken to determine what participation rate would assure a meaningful coverage for the industry, and strategies to facilitate a sufficient number of producers participating in the program should be developed.
- Management response and action plan #7:
Agreed. In July 2016, FPT Ministers of Agriculture outlined in the Calgary Statement that governments should seek ways to improve participation, timeliness, simplicity and predictability to ensure producers have access to support when needed.
However, as described above, the capacity of AgriStability to target the individual farm situation comes at the expense of program simplicity. Developing a much simpler program would require a fundamental redesign that would move away from the highly targeted nature of AgriStability. In consultation with industry, they have stressed the importance of the targeting ability of AgriStability and there may not be support for this level of change.
AAFC, in collaboration with PTs, will consider changes to AgriStability to reduce the administrative burden and associated costs. Any proposed changes would require agreement with provinces and territories and would be negotiated in the context of the next policy framework.
- Target date for completion: March 31, 2018
- Responsible position: Director General, Business Risk Management Programs Directorate, Programs Branch
- Recommendation #7:
4.2.4 AgriInvest
- Issue #8:
AgriInvest contributions are based on one percent of a producer's allowable net sales rather than an income loss. Because AgriInvest is an entitlement program that primarily covers or compensates producers for normal business risks, it is not well aligned with GF2 objectives and demand-driven BRM programming that are based on need. In recent years, approximately $260 million in government contributions per year have been deposited in AgriInvest savings accounts despite account balances of about $2 billion in 2014/15 and reduced need as a result of strong market conditions, record profitability, low interest rates and positive farm financial conditions.
- Recommendation #8:
AAFC should work with the provinces to clarify AgriInvest objectives and linkages within the context of the BRM suite of programs. The assessment should inform AAFC and the provinces regarding program design options to support flexibility in risk management while strengthening the program's linkages to GF2 priorities and BRM principles. For example, a potential role of AgriInvest could be to offset a decline in coverage by AgriStability. An option to be explored is to clarify and exercise the cross compliance clause in the GF2 FPT Multilateral Framework Agreement in conjunction with the provinces to implement conditions for producer participation in AgriInvest.
- Management response and action plan #8:
Somewhat agree. AgriInvest assists producers in managing income declines and allows for investments that help manage risks. Producers are able to withdraw funds from AgriInvest accounts whenever, and for whatever purpose, they choose. This program approach provides flexibility for producers in managing risk, and in providing timely access to funding during periods of need (for example, income declines).
Given that flexibility is a key feature of AgriInvest, information is not collected to confirm the extent to which these funds are used for risk-mitigating investments. To that end, cross compliance has been viewed as potentially impacting program flexibility and administrative simplicity. While indicators do demonstrate that less than 50 percent of producers use their AgriInvest funds when they experience income declines, producers faced with disruptive events (such as, grain transportation, drought, disease outbreaks, etc.) have been encouraged to use their AgriInvest accounts to help manage the immediate impacts. This, along with support from other BRM programs, contributed to reducing the need for ad-hoc programming.
The need to clarify the program intent and the potential expansion of cross compliance will be raised with the BRM working group during discussion on the Next Policy Framework.
- Target date for completion: March 31, 2018
- Responsible position: Director General, Business Risk Management Programs Directorate, Programs Branch
- Recommendation #8:
- Issue #9:
Many AgriInvest producer deposits are too small to justify the $107 average administrative expenditure to process and pay the matching government contribution. In 2014/15, contributions ranging from $75 to $1,000 accounted for approximately one half (47%) of the total number of contributions processed while contributions less than $500 accounted for about 30 percent. The ratio of administrative costs to process an AgriInvest contribution compared to the average amount of an AgriInvest contribution was approximately 41 percent for contributions less than $500. Due to the high ratio of administrative costs to AgriInvest contribution for these smaller amounts, savings in administration costs could be obtained by increasing the minimum contribution amount of $75 and/or producers share in the program administration costs. As a comparison, a similar program in Australia uses a minimum contribution of $1,000. To address the concern that smaller producers would not be able to participate if the minimum contribution were increased, some options could be considered such as allowing a producer to pool revenues for several years until they are sufficient to allow participation in the AgriInvest program or to develop a tax credit program which can more efficiently address small contributions.
- Recommendation #9:
AAFC should work with the provinces to increase the minimum contribution that will justify the administrative expenses to process the AgriInvest contribution and/or producers share in the program administration costs.
- Management response and action plan #9:
Agreed. The concept of a higher minimum deposit will be discussed with the BRM Working Group and FPT Policy ADMs in the context of the negotiations for the next policy framework.
- Target date for completion: March 31, 2018
- Responsible position: Director General, Business Risk Management Programs Directorate, Programs Branch
- Recommendation #9:
Annex A. Business Risk Management programs map
AAFC’s business risk management process is outlined below.
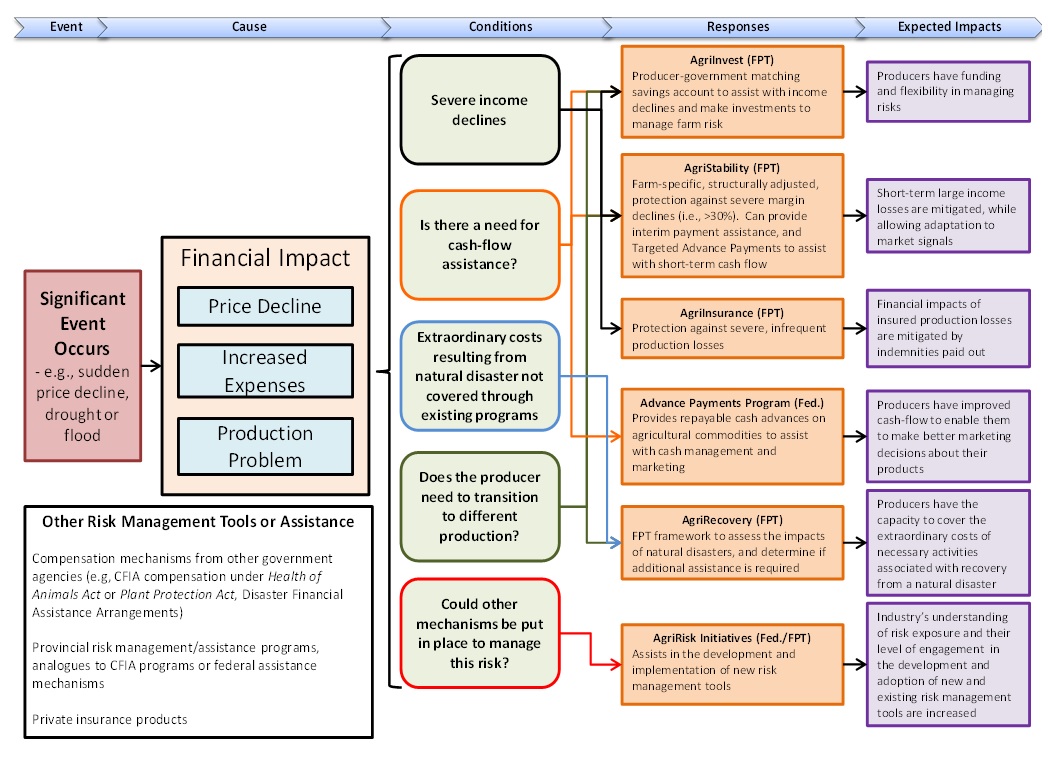
Description of above image
- Event:
- Significant event occurs (for example, sudden price decline, drought or flood)
- Cause:
- Financial impact
- Price decline
- Increased expenses
- Production problem
- Financial impact
- Conditions:
- Severe income declines
- Is there a need for cash-flow assistance?
- Extraordinary costs resulting from natural disaster not covered through existing programs
- Does the producer need to transition to different production?
- Could other mechanisms be put in place to manage this risk?
- Responses:
- AgriInvest (FPT)
- Producer and government matching savings account to assist with income declines and make investments to manage farm risk
- AgriStability (FPT)
- Farm-specific, structurally adjusted, protection against severe margin declines (such as, >30%)
- Can provide interim payment assistance, and Targeted Advance Payments to assist with short-term cash flow
- AgriInsurance (FPT)
- Protection against severe, infrequent production losses
- Advance Payments Program (Fed.)
- Provides repayable cash advances on agricultural commodities to assist with cash management and marketing
- AgriRecovery
- FPT framework to assess the impacts of natural disasters, and determine if additional assistance is required
- AgriRisk Initiatives (Fed/FPT)
- Assists in the development and implementation of new risk management tools
- AgriInvest (FPT)
- Expected Impacts:
- AgriInvest (FPT)
- Producers have funding and flexibility in managing risks
- AgriStability (FPT)
- Short-term large income losses are mitigated, while allowing adaptation to market signals
- AgriInsurance (FPT)
- Financial impacts of insured production losses are mitigated by indemnities paid out
- Advance Payments Program (Fed.)
- Producers have improved cash-flow to enable them to make better marketing decisions about their products
- AgriRecovery
- Producers have the capacity to cover the extraordinary costs necessary activities associated with recovery from a natural disaster
- AgriRisk Initiatives (Fed/FPT)
- Producers have the capacity to cover the extraordinary costs of necessary activities associated with recovery from a natural disaster
- AgriInvest (FPT)
- Other Risk Management Tools or Assistance
- Compensation mechanisms from other government agencies (such as, CFIA compensation under Health of Animals Act or Plant Protection Act, Disaster Financial Assistance Arrangements)
- Provincial risk management/assistance programs, analogues to CFIA programs or federal assistance mechanisms
- Private insurance products
Annex B. Overview of programs
1.0 Overview of programs
1.1 AgriInsurance
AgriInsurance is a federal-provincial-producer cost-shared program designed to stabilize a producer's income by minimizing the economic effects of production losses caused by severe but uncontrollable natural hazards (for example, drought, flood, wind, frost, hail or snow) or losses resulting from diseases, insect infestations and wildlife. AgriInsurance is not designed to respond to changes in commodity prices or input costs.
The cost of the insurance premiums is partially offset by federal and provincial governments to ensure the affordability of coverage for producers. For the majority of the program, 60 percent of the total premiums are paid by the federal and provincial governments on a 60:40 basis as a cost-sharing arrangement of 36:24:40 between the federal government, provinces and producers.
At the individual policy level, there are three different coverage levels offered, each with a different federal-provincial-producer cost-sharing arrangement: Footnote 41
- Catastrophic Production Loss Coverage provides coverage for losses resulting from catastrophic events (such as, infrequent, severe or multiple-year losses that occur on average once every 15 years). The coverage is intended to replace the need for government funded ad hoc assistance. Premium costs are shared 60:40 by the federal and provincial governments.
- Comprehensive Production Loss Coverage provides coverage up to 80 percent for all commodities. Additional coverage up to 90 percent is available for specific commodities, as long as the additional coverage does not meet the criteria for high cost production loss coverage. Premium costs are shared 36:24:40 across the federal government, provincial government and producers, respectively.
- High-Cost Production Loss Coverage provides coverage above 80 percent where the total pure premium cost is greater than nine percent of total insurable value, even for crops with high production variability. It also provides benefits that are paid for more frequently occurring but localized production losses as well as when the insurable value exceeds the actual/replacement value of an agricultural product. Premium costs are shared 20:13:67 across the federal government, provincial government and producers, respectively.
Participation in AgriInsurance is voluntary, however, once a commodity is selected, all production of that commodity must be insured by the producer. Producers must buy insurance before a commodity is planted and/or produced, or before any damage is possible. Producers select the commodities they wish to insure, the type of insurance plan, the coverage level, and the insurable value from the options available in their province.
The federal government offers re-insurance (deficit financing) funding to provinces. The re-insurance allows provinces to backstop a portion of the cost of the program in the event of a severe loss. Under these agreements, both parties agree to deposit a portion of their premium expenditures in their respective reinsurance accounts. Should indemnity payments in a year exceed accumulated premium reserves, these reinsurance accounts can be used to cover the outstanding amount. If there are not sufficient funds in these accounts, both governments advance the required funds to pay producers.
The provincial government is responsible for covering any outstanding indemnities up to 2.5 percent of the current year's liabilities (coverage). All remaining indemnities are shared on a 75:25 basis, with the federal reinsurance fund responsible for the larger share.Footnote 42
1.2 Wildlife Compensation Program
The Wildlife Compensation Program is a provincially delivered, but federal-provincial cost-shared program (split 60:40) that compensates producers for losses caused by wildlife, either because producers are restricted from taking direct action against wildlife as a result of federal government regulations or because there are no effective mitigation and prevention measures available to eliminate the losses. Both crops and livestock are eligible for compensation under the Program. The Program is not administered in Prince Edward Island or Newfoundland and Labrador.
In Québec, wildlife damage from federally protected species of waterfowl is not included as an insurable peril under AgriInsurance. In all other participating provinces, the type of wildlife species covered varies significantly and is designated in the Operational Document which forms part of the federal-provincial AgriInsurance agreements. Damages caused by any species can be included as long as the province can demonstrate that they have wildlife-damage mitigation strategies in place. The Wildlife Compensation Program compensates producers for up to 80 percent of their production losses incurred. Some provinces (such as, Alberta, Saskatchewan, Manitoba and Ontario) use provincial funding to offer additional non-cost shared compensation up to 90 percent or 100 percent of the losses, depending on the province. In some provinces, the Wildlife Compensation Program is administered by and in concert with the provincial authorities administering the AgriInsurance program, while in other provinces, the Program is administered by provincial government departments.
Producers are not required to participate in AgriInsurance to be eligible for the Wildlife Compensation Program and are not required to pay premiums or administration fees. Producers who experience damage caused by eligible wildlife may make a claim to the provincial authority administering the Program and an adjuster will assess the nature of the claim and determine whether it is eligible for compensation. Producers receiving compensation must make efforts to mitigate or prevent a reoccurrence of losses such as buying a guard dog, using noise makers and installing fences.
1.3 AgriStability
AgriStability is a margin-based program that provides support when producers experience large farm income losses caused by circumstances such as low prices, rising input costs and production losses. All producers who derive income from the primary production of agricultural commodities are eligible to participate. The intended outcome is that short term, large income losses are mitigated, while allowing producers to adapt to market signals.
Direct payments are issued when an eligible producer's program margin falls below 70 percent of their reference margin. A program margin is the producer's allowable income minus allowable expenses in a given year, with adjustments for changes in receivables, payments and inventory adjustments. The reference margin is calculated by averaging the program margins over the five preceding years after eliminating the highest and lowest values from the calculation (such as, taking the "Olympic average").
For margin declines of greater than 30 percent, a producer is eligible to receive an AgriStability payment covering 70 percent of the loss. To ensure the program does not compensate profitable producers for decreased profit while maintaining coverage for severe income losses, the lower of the Olympic average reference margin or the average of the producer's accrued expenses for the reference years is used as the reference margin in the payment calculation (referred to as a Reference Margin Limit or RML).Footnote 43 A producer experiencing a negative margin is eligible to receive a payment covering 70 percent of the loss. The maximum AgriStability payment a producer can receive is $3 million. To participate in AgriStability, producers pay an annual administrative fee of $55 and an annual program fee based on their unadjusted reference margin.
Interim payments and targeted advance payments
An interim payment allows eligible producers to access a portion of their AgriStability payment prior to the completion of their fiscal period in the Program Year. Interim payments are made based on the participant's projected AgriStability payment, as calculated at the time of the interim. To reduce the risk of overpayment, interim payments are normally issued at a rate not greater than 50 percent of the total estimated AgriStability payment.
Targeted Advance Payments (TAPs) are similar to interim payments, but are used only in circumstances of unusual events affecting specific groups of producers. If agreed to between the federal government and a province or territory, a TAP may be established for producers of a particular commodity or geographical region where an unusual production or market disruption has had a significant negative financial impact. The TAP is not designed to address individual farm situations. Producers who request both a TAP and an Interim Payment are eligible to receive the greater of the two payments, but not both.
1.4 AgriInvest
AgriInvest is a self-managed savings account for producers, supported by government, which provides coverage for small income declines and support for investments to mitigate risks or improve market income. AgriInvest is intended to contribute to the flexibility of the BRM program suite by providing producers with a secure, accessible, predictable, and bankable source of income assistance and to provide more flexibility to address income losses than margin-based stabilization programs.
Individuals or entities that derive income from the primary production of agricultural commodities, except those covered under supply management, are eligible to participate in AgriInvest. Producers of supply managed commodities who also produce allowable commodities may be eligible for AgriInvest based on any non-supply managed sales on of their farming operation.
Each year, producers deposit money into an AgriInvest account and receive matching government contributions. Under GF2, producers can deposit up to 100 percent of their allowable net sales (ANS) (up to a maximum of $1.5 million) into an AgriInvest account at a participating financial institution. Producers receive a matching contribution for the first one percent (up to a maximum of $15,000) from federal and provincial governments.
ANS is calculated as the gross sales of allowable commodities under the program, less purchases of allowable commodities. The total account balance, which includes matching deposits, government contributions and interest earned, is limited to 400 percent of ANS. Producers have unrestricted and free access to these funds to address income losses and/or to make an on-farm investment to mitigate business risks.
The AgriInvest account consists of two funds. Producer deposits are held in Fund 1. Matching government contributions and all interest paid on the account are held in Fund 2. Withdrawals are taken from Fund 2 first. Once Fund 2 has been depleted, the balance of the producers' withdrawal request is drawn from Fund 1 to the extent that funds are available. Amounts from Fund 2 are taxable upon withdrawal.
Since 2009, AgriInvest has been federally administered and accounts are held by financial institutions in all provinces except Québec. Once deposits are made by producers, financial institutions notify AAFC and matching contributions are credited to the producer account. In Québec, the program is delivered by La Financière agricole du Québec.
2.0 Program resources
As part of GF2, government contributions and costs to administer the programs are cost-shared between the federal and provincial governments on a 60:40 basis. Table 13 presents the federal government budgeted resources for each of the four programs for the fiscal years 2013/14 to 2017/18 and the actual program expenditures for 2013/14 and 2014/15. Over this five year period, the AgriStability budget totals $1.4 billion, the AgriInvest budget is $0.8 billion and the AgriInsurance budget is $3.2 billion, including the costs of the Wildlife Compensation Program. As the four programs are demand-driven, expenditures cannot be precisely forecasted and fluctuate from year to year. AgriStability payments fluctuate in accordance with program participation and industry conditions, increasing during sector downturns; AgriInvest payments are directly related to participation and farm revenues; AgriInsurance payments fluctuate based on commodity values and the number of acres insured; and Wildlife Compensation Program payments vary based on the number and value of claims.
| Year | Budget/ Actual Expenditures | AgriStability | AgriInvest | AgriInsurance | Wildlife Compensation Program |
|---|---|---|---|---|---|
| 2013/14 | Budget | $286.6 | $156.3 | $ 645.4 | N/A |
| 2013/14 | Actual | $205.5 | $243.2 | $739.6 | $12.9 |
| 2013/14 | Variance | $(81.1) | $86.9 | $94.2 | N/A |
| 2014/15 | Budget | $278.9 | $156.2 | $645.3 | N/A |
| 2014/15 | Actual | $208.7 | $181.7 | $597.0 | $16.6 |
| 2014/15 | Variance | ($70.2) | $25.5 | ($48.3) | N/A |
| 2015/16 | Budget | $277.9 | $156.2 | $645.3 | N/A |
| 2016/17 | Budget | $277.6 | $156.0 | $645.3 | N/A |
| 2017/18 | Budget | $277.6 | $156.0 | $645.3 | N/A |
| Total | Budget | $1,398.6 | $780.7 | $3,226.6 | N/A |
| Source: AAFC 2015-16 and 2016-2017 Report on Plans and Priorities, AAFC 2013-14 and 2014-15 Departmental Performance Report, Program Administrative Data | |||||
Table 14 shows the number of AAFC staff allocated for the delivery of each program.
| Program | 2014/15 Budgeted | 2014/15 Actual |
Variance | 2015/16 Budgeted | 2016/17 Budgeted | 2017/18 Budgeted |
|---|---|---|---|---|---|---|
| AgriStability | 286 | 161 | (125) | 165 | 164 | 164 |
| AgriInvest | 20 | 125 | 105 | 150 | 125 | 125 |
| AgriInsurance | 17 | 19 | 2 | 19 | 20 | 20 |
| Wildlife Compensation | N/A | N/A | N/A | N/A | N/A | N/A |
| Total | 323 | 305 | (18) | 334 | 309 | 309 |
| Source: AAFC 2014-15 Departmental Performance Report, AAFC 2015-2016 and 2016-17 Report on Plans and Priorities | ||||||
Producer contributions to the program costs vary:
- For AgriStability, producers pay an administrative fee of $55 in addition to an annual program fee based on their unadjusted reference margin;
- For AgriInsurance, producers pay a portion of the premiums (36% for comprehensive production loss coverage and 67% for high-cost production loss coverage);
- AgriInvest requires no administrative or program fee; and
- The Wildlife Compensation Program requires no administrative or program fee.
3.0 Governance
The governance structure for all BRM programs consists of federal/provincial/territorial working groups and committees, including the FPT BRM Policy Working Group and the FPT Administrators Working Group, as well as the National Program Advisory Committee (NPAC), which includes FPT and industry representatives. These groups examine BRM policy and program issues and, as requested, develop options to be brought forward to FPT Assistant Deputy Ministers (ADM), Deputy Ministers and Ministers committees. The NPAC provides advice through the FPT ADM Committee.Footnote 44
3.1 AgriInsurance
AgriInsurance is delivered provincially either by a Crown corporation or a branch of the provincial government agriculture department. There are currently ten provincial bodies in place across Canada to manage the administration of the AgriInsurance Program on behalf of the provinces:
- British Columbia -- Ministry of Agriculture
- Alberta -- Agriculture Financial Services Corporation
- Saskatchewan -- Saskatchewan Crop Insurance Corporation
- Manitoba -- Manitoba Crop Insurance Corporation
- Ontario -- AgriCorp
- Québec -- La Financière Agricole du Québec
- New Brunswick -- Department of Agriculture, Aquaculture and Fisheries
- Nova Scotia -- Nova Scotia Crop and Livestock Insurance Commission
- Prince Edward Island -- Department of Agriculture
- Newfoundland and Labrador -- Newfoundland and Labrador Crop Insurance Agency
AgriInsurance plans are developed and delivered by each province to meet the needs of producers. Each province is responsible for the design, implementation, delivery and administration of their insurance plans including setting premiums, claims adjustments and payments, and all administrative and planning tasks. Provinces submit insurance plan proposals that are reviewed and accepted by AAFC's Production Insurance and Risk Management Division if requirements are met. These new/modified plans are official once included in the province's Operational Document.
The federal government's role is to share premium and administration costs, provide reinsurance arrangements (deficit financing) to provincesFootnote 45 and oversight to ensure that the obligations under FIPA, GF2 and Canada Production Insurance Regulations are respected.
3.2 Wildlife Compensation Program
With the exception of Prince Edward Island, and Newfoundland and Labrador, where the program is not delivered, and Québec, where wildlife damage from protected species of waterfowl is included as a non-insurable peril under AgriInsurance, the Wildlife Compensation Program is provincially administered.
The federal government shares the administrative costs and program payments with participating provinces on a 60:40 basis, up to 80 percent of the value of the losses. The provincial governments' responsibilities include:
- Setting provincial policies that determine which crops, livestock and wildlife are eligible within the program guidelines;
- Processing producers' claims;
- Conducting or delegating authority to conduct audits and verifications to ensure the damage is caused by eligible wildlife;
- Working with producers to recommend mitigation strategies;
- Conducting follow up assessments of the use of mitigation strategies and tools;
- Issuing payments to producers; and
- Processing appeals.
The design and delivery of the Wildlife Compensation Program varies by province. Some provinces delegate certain components of the administration of the program to their wildlife conservation departments or municipalities to take advantage of their specific expertise or efficiencies, whereas other provinces administer all aspects of the program internally. In some provinces, the Program is administered by and in concert with the provincial authorities administering AgriInsurance while in other provinces it is administered by provincial government departments.
3.3 AgriStability
AgriStability is federally administered for Manitoba; New Brunswick; Nova Scotia; and Newfoundland and Labrador. In British Columbia, Alberta, Saskatchewan, Ontario, Québec and Prince Edward Island, AgriStability is provincially administered and AAFC provides contributions to reimburse provinces for the federal portion of program costs. The program's devolution to the provinces began at the request of the provinces who wished to deliver AgriStability in conjunction with AgriInsurance to obtain operational efficiencies.
Responsibilities of the federal/provincial administrators in their respective areas of delivery include:
- Making AgriStability applications available to producers;
- Processing AgriStability applications and issuing Enrolment Notices, Confirmation of Benefits Notices and tax slips;
- Making and recording all payments to eligible recipients;
- Responding to producer inquiries;
- Administering application appeals;
- Recovering overpayments;
- Financial monitoring and reporting on AgriStability progress/results;
- Ensuring effective program delivery, resources management and due diligence; and
- Performing producer audits.
3.4 AgriInvest
AgriInvest has been delivered federally since 2009 through financial institution holding accounts, except in Québec, where La Financière Agricole administers the program and manages producer accounts directly (such as, accounts are not held at financial institutions as is the case in the rest of Canada). Program administration is undertaken within AAFC's Programs Branch by the Farm Incomes Programs Directorate, which is responsible for the following AgriInvest activities:
- Processing AgriInvest applications and issuing deposit notices and tax slips;
- Negotiating financial institution agreements;
- Maintaining an interface with participating financial institutions to perform the matching of producer deposits;
- Recovering overpayments;
- Responding to producer enquiries;
- Tracking financial budgets and commitments;
- Performing producer audits; and
- Administering application appeals.
Annex C. List of documents and literature reviewed
- AAFC (2007, October). New Zealand Agriculture Policy Review. Retrieved February 2016 from: http://www5.agr.gc.ca/resources/prod/doc/pol/pub/oecd-oced/pdf/nz_e.pdf
- AAFC (2007). Australia Agriculture Policy Review. Retrieved February 2016 http://www5.agr.gc.ca/resources/prod/doc/pol/pub/oecd-oced/pdf/aust_e.pdf
- AAFC (2008, September 3). Growing Forward: A Federal-Provincial-Territorial Framework Agreement on Agriculture, Agri-Food, and Agri-Based Products Policy. Retrieved February 19, 2016 from: http://www5.agr.gc.ca/resources/prod/doc/apf/pdf/GFFA_e.pdf
- AAFC (2009, May). Financial Situation and Performance of Canadian Farms 2009
- AAFC. (2010, June). Final Report: Business Risk Management Survey for Performance Indicators.
- AAFC (2011, August). How AgriInsurance Works.
- AAFC (2012, June). Office of Audit and Evaluation. Evaluation of Income Stability Tools – AgriStability and AgriInvest.
- AAFC (2012, April). Production Insurance Affordability: Final Report.
- AAFC (2012). Office of Audit and Evaluation. Evaluation of the AgriInsurance, Private Sector Risk Management Partnerships and Wildlife Compensation Programs.
- AAFC (2013). 2013-14 Report on Plans and Priorities.
- AAFC (2013). 2013-14 Departmental Performance Report.
- AAFC (2013, January). AgriStability Program Performance Measurement and Risk Management Strategy.
- AAFC (2013, January). Program Performance Measurement and Risk Management Strategy for AgriInvest.
- AAFC (2013, January).Program Performance Measurement and Risk Management Strategy for AgriInsurance.
- AAFC (2013, February). Growing Forward 2 Fact Sheet: AgriStability and AgriInvest. Retrieved March 4, 2016 from: http://www.agr.gc.ca/eng/?id=1360758667650
- AAFC (2013, March). Growing Forward 2: AgriStability Program Handbook.
- AAFC (2013, March). Growing Forward 2 - AgriStability Program Guidelines.
- AAFC (2013, March). Growing Forward 2 - AgriInvest Program Guidelines.
- AAFC (2013, May). Growing Forward 2 - AgriInvest Program Handbook.
- AAFC (2013, May). Insurance Clause - MFA BRM Commitment.
- AAFC (2013, July). AgriInsurance Program: Frequently Asked Questions. Accessed February 19, 2016. http://www.agr.gc.ca/eng/?id=1284992475111
- AAFC (2013, September). Growing Forward 2: Policy Framework Overview (PowerPoint slides).
- AAFC (2014). 2014-15 Report on Plans and Priorities.
- AAFC (2014). 2014-15 Departmental Performance Report.
- AAFC (2014, June). AgriStability and AgriInvest Considerations for the Next Agricultural Framework.
- AAFC (2014, July). AgriRisk Initiatives. Retrieved March 29, 2016 from http://www.agr.gc.ca/eng/?id=1369851891708
- AAFC (2014, October). Federal-Provincial-Territorial Insurance Task Team. Insurance in Agriculture.
- AAFC (2015). 2015-16 Report on Plans and Priorities.
- AAFC (2015). 2015-16 Report on Plans and Priorities - Horizontal Initiatives.
- AAFC (2015, January). GF2 BRM Performance Measurement Framework (PowerPoint slides).
- AAFC (2015, March) Farm Income, Financial Conditions and Government Assistance Data Book, 2014.
- AAFC (2015, March). Overview of the Business Risk Management suite of programs under Growing Forward 2. Presented to the National Program Advisory Committee (PowerPoint slides).
- AAFC (2015, June). AgriInvest. Retrieved February 19, 2016 from: http://www.agr.gc.ca/eng/?id=1291828779399
- AAFC (2015, July). Draft Evaluation Strategy for the AgriInsurance Program and Wildlife Compensation Program.
- AAFC (2015, July). Growing Forward 2. Accessed February 19, 2016.
- AAFC (2015, August). Office of Audit and Evaluation. Evaluation Methodology: AgriInsurance.
- AAFC (2015, October). Supply Management 101. Retrieved from: http://www.agr.gc.ca/eng/?id=1443191400607
- AAFC (2015, November). AgriRecovery. Retrieved from: http://www.agr.gc.ca/eng/?id=1387480598562
- AAFC (2015, November). AgriStability Surveillance Strategy Reference Margin Limit Analysis - Phase 4.
- AAFC (2015, November). BRM Performance Indicators Report, Annual National Summary Results.
- AAFC (2016) Farm Income, Financial Conditions and Government Assistance Data Book, 2015
- AAFC (2016, January). AgriInvest - Frequently Asked Questions, Retrieved February 19, 2016 from: http://www.agr.gc.ca/eng/?id=1291906709089
- AAFC (2016, February). AgriStability. Retrieved February 19, 2016 from: http://www.agr.gc.ca/eng/?id=1291990433266
- AAFC (2016, January). Future of Business Risk Management Programs, Presentation to PPMC (PowerPoint slides)
- AAFC (2016, January). Update on the BRM IT Working Group (PowerPoint slides)
- AAFC (2016, February). AgriInsurance Program. Retrieved February 28, 2016 from: http://www.agr.gc.ca/eng/?id=1284665357886
- AAFC (2012, February). Agriculture 2020 Challenges and Opportunities.
- AAFC (2016, February). 2016 Canadian Agricultural Outlook.
- AAFC (2016, April). An Overview of the Canadian Agriculture and Agri-Food System
- AAFC (2016, July). Business Risk Management: Considerations for the Next Policy Framework (PowerPoint slides)
- AAFC (2016, July). Towards the Next Agricultural Policy Framework: Calgary Statement.
- AAFC (2016, July). FPT Communique: Federal, Provincial and Territorial Ministers Set the Direction for the Next Agricultural Framework
- AFSC (2013) AgriStability Program Handbook, pg. i. Retrieved March 11, 2016 from: https://www.afsc.ca/doc.aspx?id=6868
- AgriCorp (2014). 2013-14 Annual Report.
- AgriCorp (2015). AgriStability: How it Works. Retrieved March 11, 2016 from: http://www.agricorp.com/en-ca/Programs/AgriStability/Pages/HowItWorks.aspx
- Agricorp (2015). RMP and AgriStability: How They Work Together. Accessed April 4, 2016 from: http://www.agricorp.com/en-ca/Programs/RMP/GandO/Pages/RelatedPrograms.aspx
- Agricorp (2015, August). Participant Handbook Risk Management Program: Edible Horticulture. Retrieved April 4, 2016 from: http://www.agricorp.com/SiteCollectionDocuments/RMP-SDRM-EdibleHorticulture-Handbook-en.pdf
- Agricorp (2016). Ontario Risk Management Program. http://www.agricorp.com/en-ca/Programs/RMP/pages/overview.aspx
- Agricultural Producers Association of Saskatchewan (2016). 2015/16 Farm Program Survey Results.
- Antón, J., S. Kimura and R. Martini (2011), “Risk Management in Agriculture in Canada”, OECD Food, Agriculture and Fisheries Papers, No. 40, OECD Publishing. http://dx.doi.org/10.1787/5kgj0d6189wg-en
- Antón, J., et al. (2012). “A Comparative Study of Risk Management in Agriculture under Climate Change”, OECD Food, Agriculture and Fisheries Papers, No. 58. OECD Publishing. http://dx.doi.org/10.1787/5k94d6fx5bd8-en
- Australian Government (2008). Advancing Agriculture Reform in the EU and Australia. https://dfat.gov.au/geo/europe/european-union/Documents/advancing_agriculture.pdf
- Australian Government (2009). Multi Peril Crop Insurance in Western Australia, discussion paper prepared for the Minister for Agriculture and Food.
- Australian Government (2012, September). Options for Insuring Australian Agriculture. Report to client prepared for the Climate Change Division, Department of Agriculture, Fisheries and Forestry
- Australian Government (2012, September). Feasibility of Agricultural Insurance Products in Australia for Weather Related Production Risks.
- Australian Government (2014, November). Farm Household Allowance Guidelines. Retrieved April 5, 2016 from: http://www.agriculture.gov.au/ag-farm-food/drought/assistance/income-support-for-farmers/farm-household-allowance/guidelines
- Australian Government (2015, July) Agricultural Competitiveness White Paper. Retrieved February 2016 from: http://agwhitepaper.agriculture.gov.au/about
- Australian Government (2015, November) Income support for farmers. Farm Household Allowance. Retrieved February 2016 from: http://www.agriculture.gov.au/ag-farm-food/drought/assistance/income-support-for-farmers/farm-household-allowance
- Australian Government (2015, November). Natural Disaster Relief and Recovery Arrangements. Retrieved April 6, 2015 from: http://www.disasterassist.gov.au/NDRRADetermination/Pages/default.aspx
- Australian Government (2016). Farm Management Deposits Statistics. Retrieved April 5, 2016 from: http://www.agriculture.gov.au/ag-farm-food/drought/assistance/fmd/statistics
- Australian Government (2016) Guide to Social Security Law, 5.1.8.20 Common Benefit Rates. Retrieved April 5, 2016 from: http://guides.dss.gov.au/guide-social-security-law/5/1/8/20
- Australian Government (2016, February). Drought Recovery Concessional Loan Scheme. Retrieved April 6, 2016 from: http://www.agriculture.gov.au/ag-farm-food/drought/assistance/drought-recovery-concessional-loans#eligibility-criteria
- Australian Government (2016, February). Assistance measures. Insurance and risk advice. Retrieved February 2016 from: http://www.agriculture.gov.au/ag-farm-food/drought/assistance/insurance-risk-advice
- Australian Government (2016, February). Farm Finance Concessional Loans Scheme. Retrieved February 2016 from: http://www.agriculture.gov.au/ag-farm-food/drought/assistance/farm-finance/concessional-loans
- Australian Government (2016, March). Drought Concessional Loans Scheme. Retrieved April 6, 2016 from: http://www.agriculture.gov.au/ag-farm-food/drought/assistance/concessional-loans#loan-terms
- Australian Government (2016, March). Natural Disaster Relief and Recovery Arrangements Fact Sheet. Retrieved April 6, 2016 from: http://www.disasterassist.gov.au/FactSheets/Pages/NaturalDisasterReliefandRecoveryArrangements.aspx
- Australian Government (2016, March). Pest Management Program. Retrieved April 6, 2016 from: http://www.agriculture.gov.au/ag-farm-food/drought/assistance/pest-management
- Australian Government (2016, March). Managing Farm Risk Programme: Program Guidelines. Retrieved April 6, 2016 from: http://www.agriculture.gov.au/ag-farm-food/drought/assistance/mfrp/guidelines
- Australian Government. (2016, April). Farm Household Allowance. Retrieved April 5, 2016 from: http://www.agriculture.gov.au/ag-farm-food/drought/assistance/income-support-for-farmers/farm-household-allowance
- Australian Government. Assistance measures. Insurance and risk advice. http://www.agriculture.gov.au/ag-farm-food/drought/assistance/insurance-risk-advice
- Australian Government (2016) Farm Management Deposits Statistics. Retrieved February 2016 from: http://www.agriculture.gov.au/ag-farm-food/drought/assistance/fmd/statistics
- Australian Taxation Office (2015). Tax Averaging for Primary Producers. Retrieved April 5, 2016 from: https://www.ato.gov.au/business/primary-producers/managing-uneven-income-flow/tax-averaging/
- Australian Taxation Office (2016, April). Farm Management Deposits Scheme. Retrieved April 5, 2016 from: https://www.ato.gov.au/Business/Primary-producers/In-detail/Farm-management-deposits-scheme/Farm-management-deposits-scheme/
- BC Cattlemen's Association (2016). Livestock Protection Program. Retrieved March 16, 2016 from: http://www.cattlemen.bc.ca/lpp.htm
- BC Ministry of Agriculture (2016). BC Wildlife Compensation Program. Retrieved March 16, 2016 from: http://www2.gov.bc.ca/gov/content/industry/agriculture-seafood/programs/insurance-and-income-protection/crop-loss-damage-due-to-wildlife/damage-to-standing-forage
- Bielza et al. (2009). Risk Management and Agricultural Insurance Schemes in Europe. Retrieved April 7, 2016 from: http://www.preventionweb.net/files/12515_jrcreferencereport200909agriins1.pdf
- European Commission. (2013, December). Overview of CAP Reform 2014-2020. Retrieved April 7, 2016 from: http://ec.europa.eu/agriculture/policy-perspectives/policy-briefs/05_en.pdf
- European Commission (2014). CAP Overview. http://ec.europa.eu/agriculture/cap-overview/2014_en.pdf
- European Commission (2014). Report on the distribution of direct aids to agricultural producers (financial year 2014). http://ec.europa.eu/agriculture/cap-funding/beneficiaries/direct-aid/pdf/annex2-2014_en.pdf
- European Commission. CAP FAQ. http://europa.eu/rapid/press-release_MEMO-13-631_en.htm
- European Commission. (2014, April). The European Union Explained: Agriculture. Retrieved February 2016 from: http://ec.europa.eu/agriculture/cap-overview/2014_en.pdf
- European Commission. (2013, June). The Common Agricultural Policy (CAP) and Agriculture in Europe - Frequently Asked Questions. Retrieved February 2016 from: http://europa.eu/rapid/press-release_MEMO-13-631_en.htm
- European Commission. (2015, November). Report on the distribution of direct aids to agricultural producers (financial year 2014). Retrieved February 2016 from: http://ec.europa.eu/agriculture/cap-funding/beneficiaries/direct-aid/pdf/annex2-2014_en.pdf
- European Commission. (2015, January). Agriculture in the European Union and the Member States - Statistical factsheets. Retrieved February 2016 from: http://ec.europa.eu/agriculture/statistics/factsheets/pdf/eu_en.pdf
- FADQ (2016). ASRA. http://www.fadq.qc.ca/en/agristability/description/
- FADQ (2016). Agri-Québec . Retrieved April 4, 2016 from: http://www.fadq.qc.ca/en/agri-Québec /deposit-and-withdrawal/
- FADQ (2016). Agri-Québec Plus. Retrieved April 4, 2016 from: http://www.fadq.qc.ca/en/agri-Québec -plus/description/
- FADQ (2016). Stabilization Insurance. Retrieved April 4, 2016 from: http://www.fadq.qc.ca/en/stabilization-insurance/description/
- Farm Credit Canada (2015, October). Risk Management in Canadian Agriculture (PowerPoint Slides)
- Finance Canada. (2014, February). The Budget Plan 2014. Retrieved February 24, 2016 from: http://www.budget.gc.ca/2014/docs/plan/pdf/budget2014-eng.pdf
- Finance Canada. (2013, March). The Budget Plan 2013. Retrieved February 24, 2016 from: http://www.budget.gc.ca/2013/doc/plan/budget2013-eng.pdf
- Finance Canada. (2015, April). The Budget Plan 2015. Retrieved February 24, 2016 from: http://www.budget.gc.ca/2015/docs/plan/budget2015-eng.pdf
- George Morris Centre. (2012, May). Literature Review in Support of the Evaluation of AAFC's AgriInsurance Program: Final Report.Prepared for AAFC Office of Audit and Evaluation.
- Government of Alberta. (2010, May). Rancher's Guide to Predator Attacks on Wildlife. Retrieved March 1, 2016 from: http://esrd.alberta.ca/fish-wildlife/wildlife-damage-control-programs/wildlife-predator-compensation-program.aspx
- Government of Alberta. (2014, February). Wildlife Predator Compensation Program. Retrieved February 19, 2016 from: http://esrd.alberta.ca/fish-wildlife/wildlife-damage-control-programs/wildlife-predator-compensation-program.aspx
- Justice Canada. (2016, February). Farm Income Protection Act (FIPA). S.C. 1991, c. 22. Retrieved February 24, 2016 from: http://laws-lois.justice.gc.ca/PDF/F-3.3.pdf
- Justice Canada. (2016, February). Canada Production Insurance Regulations.SOR/2005-62.
- KPMG (2013, October). Ontario Ministry of Agriculture and Food: Agricorp Benchmarking Review
- Mahul, Olivier and Stutley, Charles. (2010). Government Support to Agricultural Insurance: Challenges and Options for Developing Countries. The International Bank for Reconstruction and Development / The World Bank.
- Manitoba Agricultural Services Corporation (2013, November). AgriStability and AgriInsurance Fact Sheet.
- Manitoba Agricultural Services Corporation (2015, January). Wildlife Damage Compensation for Livestock Predation Brochure. Retrieved February 19, 2016 from: https://www.masc.mb.ca/masc.nsf/factsheet_wildlife_damage_crops.pdf
- Manitoba Agricultural Services Corporation (2016, January). Wildlife Damage Compensation for Livestock Predation Brochure. Retrieved February 19, 2016 from: https://www.masc.mb.ca/masc.nsf/factsheet_wildlife_damage_livestock.pdf
- Manitoba Agricultural Services Corporation (2016, February. Retrieved March 1, 2016 from: https://www.masc.mb.ca/masc.nsf/program_wildlife_damage_compensation.html
- Manitoba Agricultural Services Corporation (2016). Wildlife Damage Compensation. Retrieved March 16, 2016 from: https://www.masc.mb.ca/masc.nsf/program_wildlife_damage_compensation.html
- National Milk Producers Association (2015). Overview of the Margin Protection Program. Retrieved April 7, 2016 from: http://www.futurefordairy.com/program-details
- New Brunswick Department of Agriculture, Aquaculture and Fisheries (2015). Wildlife Compensation Program Brochure. Retrieved February 19, 2016 from: http://www2.gnb.ca/content/dam/gnb/Departments/10/pdf/Services/Agriculture/WildlifeDamageBrochure.pdf
- New Brunswick Department of Agriculture, Aquaculture and Fisheries, Wildlife Compensation Program. Retrieved February 19, 2016 from: http://www2.gnb.ca/content/gnb/en/services/services_renderer.201341.Wildlife_Damage_Compensation_Program.html
- Nicoleta Uzea, Kenneth Poon, David Sparling and Alfons Weersink. (2013). Business Risk Management payments and risk balancing: Potential implications for financial riskiness of Canadian farms. http://www.iarfic.org/IARFIC_2013/3.pdf
- Nicoleta Uzea, Kenneth Poon, David Sparling and Alfons Weersink. (2014, July). Farm Support Payments and Risk Balancing: Implications for Financial Riskiness of Canadian Farms. Canadian Journal of Agricultural Economics. Vol 63 Issue 4 http://onlinelibrary.wiley.com/enhanced/doi/10.1111/cjag.12043
- Nova Scotia Crop and Livestock Insurance Commission (2008, May). Nova Scotia Wildlife Compensation Policy. Retrieved March 1, 2016 from: http://novascotia.ca/agri/documents/Nova_Scotia_Wildlife_Compensation_Policy_2015.pdf
- Nova Scotia Crop and Livestock Insurance Commission (2015). Nova Scotia Wildlife Compensation Program Brochure. Retrieved March 1, 2016 from: http://novascotia.ca/agri/documents/ci-wildlife-brochure.pdf
- NRAC (2012, September). Feasibility of Agricultural Insurance Products in Australia for Weather-Related Production Risks. Retrieved April 5, 2016 from: http://www.agriculture.gov.au/ag-farm-food/drought/nrac/work-program/agricultural-insurance-feasibility/feasability
- OCED (2011). Australia - Agricultural Policy Monitoring and Evaluation 2011. Retrieved April 5, 2016 from: http://www.oecd.org/australia/australia-agriculturalpolicymonitoringandevaluation2011.htm
- OECD. (2011, January). Thematic Review on Risk Management: Canada. Retrieved March 1, 2016 from: http://www.oecd.org/officialdocuments/publicdisplaydocumentpdf/?cote=TAD/CA/APM/WP%282010%2929/final&docLanguage=EN
- OECD. (2011, June). Price Volatility in Food and Agricultural Markets: Policy Responses.
- OECD (2011, November). Risk Management in Agriculture: What Role for Governments?
- OECD (2014). Agricultural Policy Monitoring and Evaluation: 2014 OECD Countries. Retrieved April 7, 2016 from: https://books.google.ca/books?id=-2dtBAAAQBAJ&pg=PA194&lpg=PA194&dq=average+crop+revenue+eligibility+2014&source=bl&ots=337O3vFkXn&sig=YkALufw2ES_h6mTNOO80U3g5ki4&hl=en&sa=X&ved=0ahUKEwi9_-nVhf3LAhUT7mMKHT1TBdwQ6AEINjAF#v=onepage&q=average%20crop%20revenue%20eligibility%202014&f=false
- OECD. (2014) Agriculture Policy Monitoring and Evaluation 2014 OECD Countries: OECD Countries United States. Page 194. Retrieved February 2016 from: http://www.keepeek.com/Digital-Asset-Management/oecd/agriculture-and-food/agricultural-policy-monitoring-and-evaluation-2014/united-states_agr_pol-2014-19-en#page8
- OCED (2015, July). Agricultural Policies Monitoring and Evaluation 2015 Highlights. Retrieved April 7, 2016 from: https://www.oecd.org/tad/agricultural-policies/monitoring-evaluation-2015-highlights-july-2015.pdf
- Office of the Auditor General. (2007, May). Report of the Auditor General of Canada, Chapter 4: Canadian Agriculture Agricultural Income Stabilization—Agriculture and Agri-Food Canada. Retrieved from: http://www.oag-bvg.gc.ca/internet/English/parl_oag_200705_04_e_17479.html
- Ontario Ministry of Food and Rural Affairs. (2012, April 1). Ontario Wildlife Damage Compensation Program Guides. Retrieved February 19, 2016 from: http://www.omafra.gov.on.ca/english/livestock/predation/owdcguideFeb15.htm
- R.A. Malatest & Associates. (2014, July 18). Evaluation Strategy for AgriStability.
- R.A. Malatest & Associates. (2014, March). Draft Evaluation Strategy for AgriInvest.
- R.A. Malatest & Associates. (2014, March). Draft Evaluation Strategy for the AgriInsurance Program.
- Rondeau, Daniel and Bulte, Erwin. (2007, May). Wildlife Damage and Agriculture: A Dynamic Analysis of Compensation Schemes. American Journal of Agricultural Economics Association. 89(2) (May 2007): 490–507. http://web.uvic.ca/~rondeau/ronAJAE07.pdf
- Saskatchewan Crop Insurance Corporation. (unknown). Wildlife Damage. Retrieved February 19, 2016 from: http://www.saskcropinsurance.com/wildlife/
- Saskatchewan Crop Insurance Corporation. (unknown). Wildlife Damage Crop Compensation and Prevention Brochure. Retrieved March 1, 2016 from: http://www.saskcropinsurance.com/files/wildlife/12SCIC3395_Wildlife_Damage_Booklet_v7_HR2.pdf
- Statistics Canada (2011). CANSIM Table 004-0200 Census of Agriculture, farms classified by the North American Industry Classification System (NAICS), every 5 years (number)
- Statistics Canada (2013). Farm Financial Survey BRM Program Involvement 2010 to 2013
- Statistics Canada (2013). Table 002-0071 Farm financial survey, Canadian and regional agricultural balance sheet (gross farm revenue equal to or greater than $25,000), occasional
- Statistics Canada (2013). Table 002-0072 Farm financial survey, financial structure by farm type, average per farm (gross farm revenue equal to or greater than $25,000), occasional
- Statistics Canada (2013). Table 002-0073 Farm financial survey, financial structure of farms by revenue class, average per farm (gross farm revenue equal to or greater than $25,000), occasional
- Statistics Canada (2014). CANSIM Table 002-0044 Detailed average operating revenues and expenses of farms, by farm type, incorporated and unincorporated sectors, Canada and provinces, annual
- Statistics Canada (2014). Annual Business Insolvency Rates by NAICS Economic Sectors
- Statistics Canada (2014). CANSIM 002-0004 Agriculture Value Added Account
- Statistics Canada (2014). CANSIM Table 002-0046 Average operating revenues and expenses of farms, by revenue class, incorporated and unincorporated sectors, provinces, annual
- Statistics Canada (2014). CANSIM Table 002-0008 Farm debt outstanding, classified by lender, annual
- Statistics Canada (2014). CANSIM Table 002-0020 Balance Sheet of the Agriculture Sector
- Statistics Canada (2014). CANSIM Table 002-0035 Total and average off-farm income by source and total and average net operating income of farm operators by farm type, incorporated and unincorporated sectors
- Statistics Canada (2014). CANSIM Table 002-0076 Direct payments to agriculture producers, annual
- Statistics Canada (2014). CANSIM Table 002-0044 Detailed Average Operating Revenues and Expenses
- USDA Economic Research Service. (2013, December). Major Risk Management Programs. Retrieved February 2016 from: http://www.ers.usda.gov/topics/farm-practices-management/risk-management/government-programs-risk.aspx
- USDA. (2014, March). 2014 Farm Bill Highlights. Retrieved February 2016 from: http://www.usda.gov/documents/usda-2014-farm-bill-highlights.pdf
- USDA (2014, September). 2014 Farm Bill Fact Sheet. Retrieved April 7, 2016 from: http://www.fsa.usda.gov/Assets/USDA-FSA-Public/usdafiles/arc-plc/pdf/base_acre_reallocate_arc_plc.pdf
- USDA (2015, March). 2014 Farm Bill Fact Sheet: Livestock Forage Disaster Program. Retrieved April 7, 2016 from: http://www.fsa.usda.gov/Assets/USDA-FSA-Public/usdafiles/FactSheets/2015/2015_livestock_forage_prog_march2015.pdf
- USDA (2015, March). 2014 Farm Bill Fact Sheet: Livestock Indemnity Program (LIP). Retrieved April 7, 2016 from: http://www.fsa.usda.gov/Assets/USDA-FSA-Public/usdafiles/FactSheets/2015/lip_fact_sheet_2015_march2015.pdf
- USDA (2015, October). Disaster Assistance Fact Sheet: Tree Assistance Program. Retrieved April 7, 2016 from: http://www.fsa.usda.gov/Assets/USDA-FSA-Public/usdafiles/FactSheets/2015/tap_fact_sheet_oct_2015.pdf
- US Department of Agriculture (2015, July). Supplemental Coverage Option for Federal Crop Insurance. Retrieved April 6, 2016 from: http://www.rma.usda.gov/pubs/rme/2016sco.pdf
- USDA (2015, August). Disaster Assistance Fact Sheet: Emergency Assistance for Livestock, Honeybees and Farm-Raised Fish Program (ELAP) - Livestock Assistance. Retrieved April 7, 2016 from: http://www.fsa.usda.gov/Assets/USDA-FSA-Public/usdafiles/FactSheets/2015/livestock_assistance_aug2015.pdf
- USDA. Major Risk Management Programs. http://www.ers.usda.gov/topics/farm-practices-management/risk-management/government-programs-risk.aspx
- US Crop Insurance (2016). Just the Facts. Retrieved April 6, 2016 from: http://www.cropinsuranceinamerica.org/about-crop-insurance/just-the-facts/#.VwWNBPkrJD8
- USDA. (2016). Commodity Loans. Retrieved April 6, 2016 from: http://www.fsa.usda.gov/programs-and-services/price-support/commodity-loans/index
- USDA (2016). Reimbursement Transportation Cost Payment (RTCP). Retrieved April 7, 2016 from: http://www.fsa.usda.gov/programs-and-services/price-support/RTCP-Program/index
- USDA (2016). Noninsured Crop Disaster Assistance Program. Retrieved April 7, 2016 from: https://www.fsa.usda.gov/programs-and-services/disaster-assistance-program/noninsured-crop-disaster-assistance/index
- U.S. Government (2014). Agriculture Act of 2014. http://www.gpo.gov/fdsys/pkg/BILLS-113hr2642enr/pdf/BILLS-113hr2642enr.pdf
- Vercammen, J. (2012) Canadian Direct Payment Farm Programs: 1981-2010. Presentation at the Growing Our Future Policy Conference, April, 2012. (PowerPoint slides)
- Wagner, Kimberly K.; Schmidt, Robert H.; and Conover, Michael R. (1997). "Compensation Programs for Wildlife Damage in North America" . USDA National Wildlife Research Center - Staff Publications. Paper 829. http://digitalcommons.unl.edu/icwdm_usdanwrc/829
- Western Livestock Price Insurance Program (2016). Retrieved March 28 2016 from: https://www.wlpip.ca/
- World Bank Group (2014, October). Agricultural Policies and Trade Paths in Turkey. Retrieved February 2016 from: http://www-wds.worldbank.org/external/default/WDSContentServer/WDSP/IB/2014/10/09/000158349_20141009095314/Rendered/PDF/WPS7059.pdf
- Western Livestock Price Insurance Program (2016, June). Livestock Insurance Summary by Policy Date 2016 to 2016