
Consumer profile
Vietnam’s population was estimated at 98.5 million in 2021, with 37% of the population living in urban areas. The country has a youthful population, with over 45% of the population aged between 25-54. This consumer group represents the bulk of the workforce and is, therefore, the most important consumer demographic. Consumers in the Generation Z category (born between 1997-2012) are also expected to become an increasingly important consumer base. This consumer group accounts for approximately 30% of the population.
Vietnam’s middle class is growing fast. According to a report by data enterprise firm World Data Lab, Vietnam’s middle-class population was the seventh-fastest growing in the world in 2021 and is expected to reach 23.2 million people by 2030, which represents roughly 22% of the 106 million total population forecast by 2030. By 2030, Vietnamese consumers between the ages of 45 and 65 will contribute to nearly 25% of Vietnam’s consumer spending, compared to 20% in 2021.
When it comes to daily necessities, Vietnamese consumers are known to be patriotic, with a marked preference for local brands over foreign products. According to Leger Inc. in 2022, the majority (82%) of Vietnamese consumers prefer consuming food that is made or comes from Vietnam, and two thirds (65%) would pay more attention to food coming from abroad. They are also price-sensitive when it comes to purchasing decisions. A study by research firm Nielsen found that Vietnam is one of the most price-sensitive markets in Southeast Asia, with over 80% of shoppers noticing when a product’s price changes. Vietnamese consumers shop very frequently; Leger Inc. in 2022, points out that over four in five (81%) Vietnamese consumers go grocery shopping several times per week, and over one third (34%) shop for food every day.
Vietnam has a diverse range of agricultural products. The diet of local consumers consists mainly of rice and rice noodles, fresh herbs, fruits and vegetables, tofu, meat and seafood. Locally-grown vegetables consist of green leafy vegetables such as water spinach, bok choy, cabbage, amaranth and water celery. Local fruits include pineapple, coconuts, bananas, longans, lychees, mangoes, rambutans and other tropical fruit. The most common animal proteins are pork, poultry and seafood. Beef is consumed but less often, as it is more expensive. With an abundance of rivers in the country, the local diet is also rich in different types of seafood, most notably fish, crab, shrimp, clams and squid.
Vietnamese consumers typically consume three meals a day, all of which are savoury. A typical Vietnamese meal will include rice plus 3 to 4 side dishes, with more vegetables than meat. It is often accompanied by fresh, raw vegetables such as cabbage, carrots and aromatic herbs such as mint, basil and coriander. Common herbs and seasonings used in Vietnamese cooking include ginger, lemongrass, lime juice, shallots, fish sauce, soy sauce and cinnamon. As a former French colony, Vietnamese consumers also eat some European staples such as baguettes and pâté, which feature in dishes such as ‘banh mi’, a Vietnamese sandwich with a baguette and traditional fillings, such as Asian ham or pâté with pickled vegetables.
Over the past two decades, the eating habits of the Vietnamese have changed dramatically, driven by the country’s economic growth and greater exposure to Western food. While local companies still dominate the packaged food and beverages market, foreign brands such as Nestlé, Heineken, Suntory, and Orion have established a strong position within their product categories. Dairy products, which were previously underdeveloped in the Vietnamese market, have also witnessed robust growth.
Vietnamese consumers dine out more frequently compared to the West. Eating out at a family restaurant is considered a social activity, and a significant portion of consumers enjoy eating out on a daily basis. According to a consumer survey by Cint in 2018, KFC, Pizza Hut and McDonald’s were the most popular fast-food restaurants among Vietnamese consumers.

Description of above image
| Fast food chain | Percentage |
|---|---|
| KFC | 45 |
| Lotteria | 17 |
| Pizza Hut | 6 |
| McDonald's | 6 |
Source: Q&Me
Eating habits have gradually changed, with Western food such as burgers, fried chicken and pizza becoming favourite meal choices when eating out. KFC is the most popular, with around 45% of respondents in a 2020 survey conducted by Ho Chi Minh City-based market research company Q&Me claiming to vist KFC's outlets often. Lotteria came in second, with 17% of surveyed individuals answering they visit the Japanese fast food chain often. McDonald's and Pizza Hut trailed behind, with 6%.
Food and beverage market trends
Market size and consumption pattern for Food and beverage (F&B) products
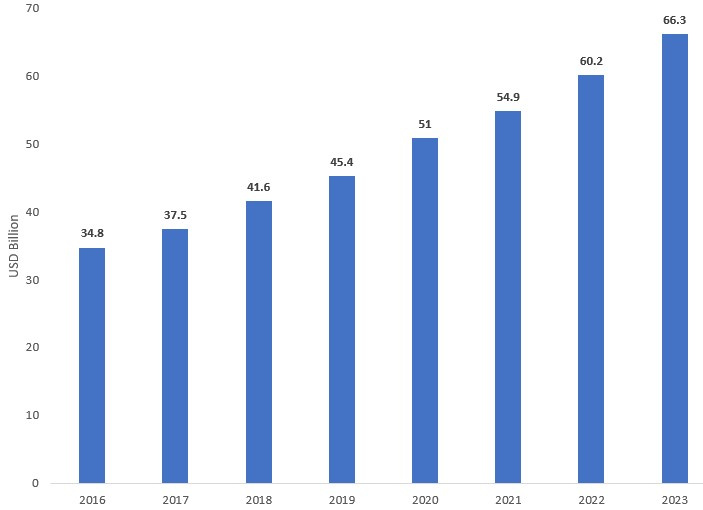
According to Statista, the total retail sales value of food and beverage products was estimated to be USD 54.9 billion in 2021, contributing to almost 16% of the country’s GDP. According to global financial services provider Fitch Solutions, the average Vietnamese household will spend 20.8% of their total household budget on food in 2025, marginally increasing from 20.1% in 2005. Rice commands the main bulk of calorie consumption, and this is not expected to change despite the rising share of other staples.
Description of above image
| Year | F&B Retail Sales in Vietnam |
|---|---|
| 2016 | 34.8 |
| 2017 | 37.5 |
| 2018 | 41.6 |
| 2019 | 45.4 |
| 2020 | 51 |
| 2021 | 54.9 |
| 2022 | 60.2 |
| 2023 | 66.3 |
Source: Statista
Note: The sales value for the year 2020 is an estimate and for the subsequent years (2021-23), the values are forecasted.
According to Statista, food and beverage retail sales increased from USD 34.8 billion in 2016 to an estimated USD 51 billion in 2020 and is forecast to increase to USD 66.3 billion by 2023. Bread and cereals, confectionery and snacks, fish and seafood, vegetables, and meat have the highest average revenue per capita amongst food and beverage products.
In terms of average revenue per capita amongst food and beverage products in Vietnam for 2021, as per Statista, the segment with the highest revenue per capita was bread and cereals (USD 182.32), followed by confectionery and snacks (USD 145.74), fish and seafood (USD 112), vegetables (USD 107.71), and meat (USD 95.14). Demand for these products is expected to remain strong in the coming years./p>
Description of above image
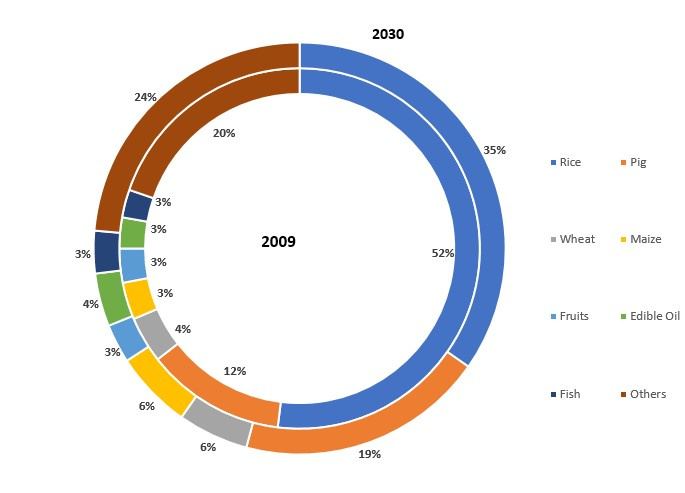
In 2009, the composition was as follows:
- Rice – 52%
- Pork – 12%
- Wheat – 4%
- Maize – 3%
- Fruits – 3%
- Edible oil – 3%
- Fish – 3%
- Others – 20%
The projected composition in 2030 is:
- Rice – 35%
- Pork – 19%
- Wheat – 6%
- Maize – 6%
- Fruits – 3%
- Edible oil – 4%
- Fish – 3%
- Others – 24%
Source: Jamora and Labaste 2015, World Bank
Note: The composition break-up for food calories consumed in Vietnam in 2030 is a forecasted value
While rice continues to be the main source of calories in 2030, its contribution to the overall calorie composition is expected to reduce significantly due to increasing intake of other food items, such as pork, wheat, and maize.
Plain rice is the primary source of available protein, calcium, carbohydrates, iron and zinc in Vietnam, while eggs contribute the most towards Vitamin A and fat availability. Rice is also the country’s staple crop, commonly consumed by nearly all households.
Market dynamics
Vietnam’s food and beverage market is highly fragmented. Sales continue to be heavily dominated by domestic companies. Some of the leading local packaged food and beverage manufacturers include Vinamilk, Masan Consumer Corp, Vissan Joint Stock Corp and AceCook Vietnam. Foreign players have traditionally struggled to make their mark in the local market, as consumers have remained loyal to homegrown products.
Having said that, foreign players seeing strong growth opportunities in the Vietnam market have been persistent in expanding their presence. Several multinational companies are gradually gaining a foothold in the local food and beverage scene, by offering quality products and establishing long-standing relationships. Within the retail grocery market, Nestlé, Heineken, Suntory, and Orion are amongst the companies which have succeeded in capturing a top ten market share in their product categories. In the foodservice sector, international fast-food chains, such as KFC, McDonald’s, Pizza Hut and Lotteria continue to develop their share in the domestic market.
The budget shares of high-quality protein-rich foods (meat, milk, eggs, oil, fish, etc.) and timesaving, convenience foods (Food Away from Home or FAFH) are increasing as household income increases in Vietnam. In addition, protein-rich and time-saving foods have higher expenditure shares in urban areas than in rural areas. The consumption of Animal Sourced Food (ASF), such as pork, fresh shrimp/fish, chicken meat, and processed meat is common in Vietnam. Collectively, these ASFs contribute nearly 20% of total protein consumed. Tofu, a plant-based source of protein, is also frequently consumed.
The daily intake of meat has increased in Vietnam over the years as it has become an increasingly important part of the Vietnamese diet. According to the National Institute of Nutrition (NIN) under Ministry of Health, on average, the Vietnamese consumed 134 grams of meat per capita per day as of 2021 (up from around 90 grams in 2015), with people in urban areas consuming 154 grams of meat per day. This is in line with worldwide trends where economic growth, increasing affluence, and urbanization is accompanied by rising meat consumption.
In terms of consumption of fruits and vegetables, in 2010, a Vietnamese consumed 190 grams of vegetables per day and 61 grams of fruit per day on average. While the figures have increased to 230 grams of vegetables and 127 grams of fruit per day in 2021, only 65% of Vietnamese people meet the recommended consumption of fruit and vegetable, indicating growth potential. Consumers increasingly prefer pesticide-free, organic fruits and vegetables, with rising demand for imported, exotic, organic, and nutritious fruits. According to Leger, as of 2022, 94% of Vietnamese consumers reported being health conscious and cared about what they ate. Nine in ten (89%) consumers reported regularly reading food ingredient lists, and over eight in ten (83%) think about environmental sustainability when purchasing food.
In 2020, Vietnam's per capita milk consumption stood at 26-27 litres per year, compared with the average consumption in Asian countries at 38 litres per person per year. The Vietnamese perceive milk to be a healthy addition to their diets due to its high nutritional content, supported by government campaigns and players’ marketing efforts. Dairy market revenues have grown at a CAGR of 12.7% between 2010 and 2018, according to the Vietnam Dairy Association. Revenues were estimated at around USD 5.9 billion in 2020, and domestic production meets less than 40% of demand.
With rising disposable income, consumption of premium imported food items has also increased in the recent past. Leger 2022 asked Vietnamese consumers what countries they were interested in buying food from. 81% noted the US, followed by 75% selecting Australia , 71% identified Canada, and 70% noted New Zealand. Most Vietnamese consumers (85%) are willing to try new food, flavours and ingredients. A majority of Vietnamese consumers (60%) reported purchasing international food products at least once a month, with 15% purchasing international food products more than once a week. To meet demand for premium imported foods, Vietnam has increased imports of these products, especially from the developed markets.
Some of the changing lifestyle, social and cultural trends that are influencing Vietnam’s food and beverage consumption, are described below.
Busy and stressful lifestyles
Increasingly busy and stressful lifestyles have led to a growth in volume and sales of confectionery, snacks and junk food items. Snacking in Vietnam is not only a source of indulgence but also increasingly a replacement for meals. A 2019 survey by consumer insights firm Kantar Worldpanel found that, on average, a Vietnamese household spends approximately USD 43 per annum on confectionery products and snacks. In 2021, consumption of such products was estimated at USD 610 million in rural areas and USD 146 million in urban areas./p>
Health and wellness
The health and wellness sector, which includes health-related food and beverage items, fortified foods, lower fat, naturally healthy and organic foods, was one of the strongest performing sectors in the past five years. Vietnamese consumers, who perceive organically-produced foods to have better nutritional value, are gaining awareness of health risks associated with unhealthy diets, which could lead to issues such as obesity, diabetes, and heart disease. This awareness is driving up the demand for healthy food products and consumers are willing to spend more on organic and natural food items. Besides, with family sizes shrinking, the Vietnamese consumer prefers smaller packages that are easier to store and consume.
According to Nielsen, while 37% of Vietnamese consumers consider health to be among their top concerns, 90% are worried about the long-term health impact of artificial ingredients, and 76% want to know everything that goes into their food. The Covid-19 pandemic has intensified the focus on health and wellbeing even further, with demand particularly increasing for items that are targeted at boosting immunity, as well as products that are considered safe and hygienic. According to a Google study in 2020, Vietnamese consumers are willing to pay higher prices for food and beverage products that guarantee safety and health benefits. There was also an increased focus on diet and healthy eating habits, with 80% growth in Google searches related to diet.
Vietnamese consumers are increasingly aware of the importance of healthy diet. Between August 2019 and July 2020, there was a growth in search terms pertaining to the health benefits of food: +900% for “Eat Keto”; +350% for "What should you eat in the gym”; +160% for "What to eat for good joints”.
High quality food and beverages
In addition to safety and health, product quality and exclusivity is a key trend driving sales growth in the Vietnamese food and beverage sector. Rising interest in international cuisine, and the association of expensive imported products with a higher social status, mean that consumers are increasingly willing to pay more for premium, imported brands, particularly when purchasing them as gifts. This trend is especially prevalent when purchasing fresh fruit. Demand for expensive, imported fruit typically soars during holiday seasons, such as New Year (January 1st), Lunar New Year (falls between January 21st and February 20th), Teachers’ Day (November 20th) and Women’s Day (aside from the International Women’s Day on March 8th, Vietnam also celebrates its National Women’s Day on October 20th), due to the custom of giving fruits as gifts in Vietnam. Sales of imported fruits via supermarkets, organic specialty stores, and e-commerce channels are expected to grow significantly.
Within the pet food industry, the growing trend towards pet humanization (treating pets as family members) also underpinned rising expenditure on premium pet food in Vietnam. Sales witnessed double-digit year-on-year growth between 2006 and 2021, as Vietnamese families embraced pet care and considered pets as a core member of the family unit.
Stocking up on essentials
The Covid-19 outbreak gave rise to a demand for staple products and processed food. Essential items, including instant noodles and frozen food, recorded double-digit growth in 2020, as consumers purchased such items in bulk and stayed home to avoid social interactions and Covid-19 transmission. Demand for such products is expected to continue, as they offer convenience while consumers adjust to the new normal.
Increasing beer and wine consumption
The alcoholic beverage industry in Vietnam is witnessing growth. Craft beer is particularly gaining popularity amongst the younger generation. Vietnam’s wine market is also emerging, with a variety of wines featuring from France, Italy, Chile, US, and Australia. The best-selling wine is red wine, with around 65% market share.
Trade flows and opportunities
| 2016 | 2017 | 2018 | 2019 | 2020 | CAGR | |
|---|---|---|---|---|---|---|
| Vietnam's agri-food imports from Canada | 109 | 409 | 238 | 315 | 302 | 29.2% |
| Vietnam's agri-food imports from the world | 15,726 | 17,633 | 19,491 | 19,875 | 20,902 | 7.4% |
| Vietnam's agri-food import from Canada as a % of total agri-food imports | 0.7% | 2.3% | 1.2% | 1.6% | 1.4% | NA |
| Canada’s agri-food exports to the world | 47,317 | 49,998 | 51,495 | 50,950 | 55,795 | 4.2% |
| Canada's agri-food exports to Vietnam as a % of total agri-food exports | 0.2% | 0.8% | 0.5% | 0.6% | 0.5% | NA |
|
CAGR: Compound annual growth rate NA: Non-applicable |
||||||
Source: UN Comtrade
Agri-food import growth from Canada has outpaced Vietnam’s total agri-food imports over the past 5-year period.
Vietnam’s total agri-food imports have grown at a CAGR of 7.4% between 2016 and 2020, and 10.8% between 2010 and 2020. Imports from Canada have increased at a CAGR of 29.2%, indicating rising penetration of Canadian agri-food products in the market. However, significant potential for growth remains to be tapped, as Canadian exports to Vietnam account for 0.5% of Canadian exports to the world and 1.4% of Vietnamese imports as of 2020.
| HS code | Product description | Vietnam’s imports from Canada | Vietnam’s imports from the world | ||||||||
|---|---|---|---|---|---|---|---|---|---|---|---|
| 2016 | 2017 | 2018 | 2019 | 2020 | 2016 | 2017 | 2018 | 2019 | 2020 | ||
| Total agri-food imports | 109 | 409 | 238 | 315 | 302 | 15,726 | 17,633 | 19,491 | 19,875 | 20,902 | |
| 02 | Meat and edible meat offal | 2 | 7 | 4 | 18 | 80 | 349 | 352 | 529 | 789 | 1,237 |
| 10 | Cereals | 16 | 198 | 86 | 102 | 74 | 2,746 | 2,577 | 3,382 | 3,132 | 3,408 |
| 12 | Oil seeds and oleaginous fruits; miscellaneous grains, seeds and fruit; industrial or medicinal plants; straw and fodder | 43 | 92 | 61 | 68 | 50 | 813 | 890 | 990 | 1,004 | 1,146 |
| 03 | Fish and crustaceans, molluscs and other aquatic invertebrates | 20 | 25 | 42 | 50 | 41 | 1,088 | 1,386 | 1,522 | 1,572 | 1,594 |
| 04 | Dairy produce; birds' eggs; natural honey; edible products of animal origin, not elsewhere specified or included | 3 | 7 | 3 | 8 | 19 | 484 | 607 | 637 | 667 | 683 |
| 23 | Residues and waste from the food industries; prepared animal fodder | 12 | 68 | 20 | 50 | 15 | 3,449 | 3,228 | 3,868 | 3,637 | 3,818 |
| 01 | Live animals | 1 | - | 1 | 2 | 7 | 386 | 343 | 373 | 649 | 870 |
| 08 | Edible fruit and nuts; peel of citrus fruit or melons | 7 | 5 | 7 | 7 | 6 | 2,276 | 3,721 | 3,151 | 2,915 | 2,321 |
| 21 | Miscellaneous edible preparations | 2 | 3 | 6 | 4 | 3 | 644 | 692 | 780 | 1,010 | 996 |
| 15 | Animal or vegetable fats and oils and their cleavage products; prepared edible fats; animal or vegetable waxes | 0 | 0 | 1 | 1 | 1 | 706 | 767 | 752 | 745 | 929 |
| 07 | Edible vegetables and certain roots and tubers | 0.5 | 0.2 | 0.3 | 0.4 | 0.9 | 456 | 644 | 691 | 690 | 537 |
| 22 | Beverages, spirits and vinegar | 0 | 0 | 0.1 | 0.1 | 0.1 | 156 | 190 | 292 | 312 | 315 |
| 11 | Products of the milling industry; malt; starches; inulin; wheat gluten | 0 | 0.1 | 0 | 0 | 0.1 | 274 | 259 | 279 | 320 | 286 |
| 17 | Sugars and sugar confectionery | 0 | 0 | 0 | 0 | 0 | 378 | 302 | 321 | 378 | 911 |
| 19 | Preparations of cereals, flour, starch or milk; pastrycooks' products | 0 | 0 | 0 | 0 | 0 | 577 | 552 | 604 | 686 | 639 |
Source: UN Comtrade
Canadian exporters have made noteworthy inroads into the meat products market in Vietnam over the past two years.
| HS code | Product description | Category indicating penetration of Canadian products in Vietnam* | % of total agri imports from the world to Vietnam (2020) | % of Canadian agri exports to Vietnam (2020) | Product imports from Canada as % of imports from world (2020) | CAGR of total product imports from the world to Vietnam (2016-2020) | CAGR of Vietnamese product imports from Canada (2016-2020) | Top supplying countries to Vietnam (percentage of import value) |
|---|---|---|---|---|---|---|---|---|
| 23 | Residues and waste from the food industries; prepared animal fodder | 2 | 18.3% | 11.1% | 0.4% | 2.6% | 5.3% | Argentina (40%) US (13%) Brazil (10%) |
| 10 | Cereals | 1 | 16.3% | 14.8% | 2.2% | 5.6% | 46.5% | Argentina (48%) Brazil (19%) |
| 08 | Edible fruit and nuts; peel of citrus fruit or melons | 2 | 11.1% | 6.4% | 0.3% | 0.5% | -4.3% | Côte d'Ivoire (25%) Cambodia (13%) |
| 03 | Fish and crustaceans, molluscs and other aquatic invertebrates | 1 | 7.6% | 18.0% | 2.6% | 10.0% | 20.2% | India (14%) Norway (12%) |
| 02 | Meat and edible meat offal | 1 | 5.9% | 2.2% | 6.4% | 37.2% | 140.5% | India (23%) US (19%) Brazil (11%) |
| 12 | Oil seeds and oleaginous fruits; miscellaneous grains, seeds and fruit; industrial or medicinal plants; straw and fodder | 1 | 5.5% | 39.3% | 4.4% | 9.0% | 4.3% | US (35%) Brazil (25%) India (14%) |
| 21 | Miscellaneous edible preparations | 2 | 4.8% | 2.1% | 0.3% | 11.5% | 6.7% | US (25%) Singapore (22%) |
| 15 | Animal or vegetable fats and oils and their cleavage products; prepared edible fats; animal or vegetable waxes | 3 | 4.4% | 0.4% | 0.1% | 7.1% | 21.9% | Indonesia (48%) Malaysia (34%) |
| 17 | Sugars and sugar confectionery | 3 | 4.4% | 0.1% | 0.01% | 24.6% | 12.3% | Thailand (59%), China (11%) |
| 01 | Live animals | 2 | 4.2% | 1.3% | 0.8% | 22.5% | 47.2% | Australia (53%), Thailand (41%) |
| 04 | Dairy produce; birds' eggs; natural honey; edible products of animal origin, not elsewhere specified or included | 1 | 3.3% | 2.4% | 2.9% | 9.0% | 65.2% | New Zealand (40%) US (25%) |
| 19 | Preparations of cereals, flour, starch or milk; pastrycooks' products | 3 | 3.1% | 0.04% | 0.00% | 2.6% | -21.7% | Thailand (15%) Indonesia (12%) |
| 07 | Edible vegetables and certain roots and tubers | 3 | 2.6% | 0.4% | 0.2% | 4.2% | 17.1% | China (45%) Cambodia (27%) |
| 22 | Beverages, spirits and vinegar | 3 | 1.5% | 0.01% | 0.04% | 19.3% | 88.5% | Thailand (32%) South Korea (17%) |
| 11 | Products of the milling industry; malt; starches; inulin; wheat gluten | 3 | 1.4% | 0.05% | 0.05% | 1.0% | 30.2% | Australia (34%) China (16%) |
Source: UN Comtrade
*Notes:
Category indicating penetration of Canadian products in Vietnam:
1: Imports from Canada constitute more than 2% of total imports to Vietnam
2: Imports from Canada constitute less than 2% but more than 0.25% of total imports to Vietnam
3: Imports from Canada constitute less than 0.25% of total imports to Vietnam
The order of products in this table reflects the relative market size opportunity in Vietnam. Significant opportunities for Canadian exporters remain untapped in most product categories, as seen from low % contribution of Canadian products to total Vietnamese imports. Canadian exports are growing faster than Vietnamese imports in several categories, which indicates improving market penetration.
Most agri-food categories in Vietnam present significant opportunities for Canadian exporters, with Canadian agri-food products steadily increasing their share of the Vietnamese market over the past five years.
Canadian exporters have made the greatest inroads in the meat market in Vietnam, with both pork and beef imports surging by 5.8 times and 4.4 times respectively during 2020. Pork continues to be the most popular meat in the country. However, beef is increasingly popular and accounts for over 40% of meat imports in most years (with the exception of 2020, when pork imports went up six times due to the African Swine Fever (ASF) outbreak in Vietnam). The imports of both products have been boosted by CPTPP. In 2020, Canada was the fourth largest exporter of both frozen beef (which constitutes the bulk of Vietnam’s beef imports) and fresh/chilled/frozen pork to Vietnam, with market shares of 7% and 13% in two categories respectively. For pork, competition comes from Russia (29%), Brazil (27%) and the US (13%) who are the three largest suppliers of pork, while frozen Canadian beef faces competition from Australia (14%) and the US (12%).
Though Vietnam is one of the world’s largest exporters of seafood products, such as shrimp and pangasius, its seafood imports have also been going up. Canadian companies have been successful with products such as crabs and lobsters.
Cereal imports are largely composed of corn (70% of import value in 2020), primarily destined for the animal feed industry and wheat (24%). Canada has become the fourth largest wheat supplier to the country (9% of import value), following Australia (26%), Russia (23%) and the US (18%). Expansion of wheat demand is driven by both growing consumption of wheat as food (bread, noodles, confectionary) and rising use in the animal feed industry. Around 40% of imported wheat is used as feed ingredient and Russia is the largest supplier of feed wheat. Canada is primarily supplying milling wheat, competing against Australia and the US, the two largest suppliers in this category.
Dairy is an emerging but fast-growing market in Vietnam, and Canada’s primary competitor in the category is New Zealand (Fonterra).
The product categories shaded yellow in the table above represent products where potential is largely untapped:
- Vietnam has among the most well-developed animal feed industries in the region, and inputs for the sector constitute the largest component of agricultural imports. Canada contributed a modest 0.4% in 2020. Argentina, US and Brazil are the biggest suppliers in this segment.
- Canada’s presence in the processed food market is underdeveloped, as can be seen from Canadian products accounting for 0.4% of Vietnamese imports in 2020.
- Within the live animals subsector, there are opportunities for Canadian companies in the animal genetics space, and they have already established a presence in swine genetics in Vietnam.
Finally, the product categories shaded blue are the ones where imports from Canada are yet to make a significant impression in the market, but some of these categories, such as beverages and spirits, can be important growth areas for the future. Within categories such as fruits, products such as Canadian apples and cherries have been well received in the market. Main competitors for apples include New Zealand and the US with 35% and 28% market share, respectively and for cherries Canada’s key competitors are the US (64% market share), Australia (18% market share) and New Zealand (15% market share).
Distribution pathways
Most imported processed food products and food products not requiring processing, such as fresh fruits, go though local importers and distributors before reaching customers via four key retail channels: traditional retail, modern retail, foodservice, and e-commerce. Imported food ingredients also reach food processors via importers and distributors, but larger food processors might import some ingredients directly from overseas exporters.
Food processing
The Covid-19 pandemic and the consumer shift towards convenience products have benefited Vietnam’s food processing industry, with processors who supply essential food products such as milk, instant noodles, meat products, and canned food gaining opportunities. Food processors continue to increase production capacity and improve product quality to meet growing market demand.
The dairy industry, in particular, has been booming, resulting in an increase in the production volume of processed dairy products, such as powdered milk.
Processed fish and fishery products have also contributed significantly to the growing food manufacturing sector in Vietnam. By 2030, the government aims to make Vietnam the world’s leading seafood processing centre by developing an efficient and sustainable processing industry.
Vietnam’s food processors use both locally produced raw materials and imported food ingredients in their operations. While leading multi-national food processing operators might be able to buy food ingredients such as wheat flour, milk powder, and malt directly from the exporters, smaller food processors continue to remain dependent on distributors.
Foodservice
Vietnamese foodservice providers include hotels, restaurants, cafés/bars, and institutional catering services. Distribution pathways for imported food and beverage items are mostly achieved through direct sales to foodservice providers or sales to foodservice wholesalers/distributors. Some foodservice providers in Vietnam, namely full-service restaurant chains and fast-food chains, directly import a few key food ingredients, such as beef, poultry and frozen potatoes.
Retail
Traditional retailers
Traditional trade, which includes wet markets and mom-and-pop stores, represents the largest channel in Vietnam both in terms of the number of outlets and sales value. According to Nielsen, Vietnam has more than 1.4 million grocery stores and 9,000 traditional markets as of February 2021, generating revenues of around USD 10 billion. Traditional sales channels account for 70-75% of Vietnam’s total retail market.
Traditional retailers continue to play an important role in the overall market. Traditional retailers are often the only option for consumers in rural areas as they often sell products at lower prices than modern grocery retailers. They also continue to be supported by long-standing buyer-seller relationships. Moreover, for Vietnamese consumers, shopping at brick-and-mortar retailers is a habit and a way to foster social connections. According to Leger Inc., the vast majority (94%) of consumers buy the majority of their food in-store, mostly at local markets. However, the traditional channel is often prone to sub-par hygiene and safety standards, and there are also difficulties with tracing the product’s origin. Covid-19 has severely impacted sales of traditional retailers, with social distancing measures and lockdowns leaving many vendors out of business.
Wholesale distribution in Vietnam is fragmented – large wholesalers with nationwide networks are limited, and the wholesale function is not fully developed in Vietnam. Furthermore, the distinction between wholesale and retail functions is ambiguous. Wholesalers may simply refer to merchants in wet markets, selling products to other channel partners (retailers), who in turn re-sell the products. Wholesale and retail merchants usually co-exist in the same wet markets, and even some relatively large street retailers serve as wholesalers.
Distributors have delivery and business negotiation capabilities, and their influence and impact are increasing in the Vietnamese distribution landscape. In remote areas where distributors have limited direct reach, they often rely on agents called Đại Lý (more details in Table 4 below), who sell goods to the retailers on distributors’ behalf. Similar intermediaries are called Thương Lái, which refers to a trader who transports goods for agricultural distribution. In wet markets, there are independent brokers called Cò who earn commissions by introducing producers and farmers to wholesalers.
| Name | Name in Vietnam | Explanation | Product Ownership | Delivery Function |
|---|---|---|---|---|
| Distributors | Nhà Phân Phối | Distributors offer broad market coverage and reduce costs for their suppliers by providing regional warehousing and customer services. | Yes | Yes |
| Wholesalers | Bán Buôn or Bán Sỉ (in the south) | Merchants in wet markets or streets who sell products to other channel partners (retailers), who in turn re-sell the products. | Yes | No |
| Agents | Đại Lý | Individuals or companies who sell products on behalf of a supplier or distributor. Agents do not take physical possession of the goods or services and are typically remunerated on commission. | No | Yes |
| Brokers | Cò | Brokers strive to bring potential buyers and sellers together. They are not supposed to have a long-term relationship. | No | No |
Source: Ihara, Motoi (2020). Vietnamese Marketing Channels in the Process of Retail Modernization
Modern retailers
Modern retail in the form of hyper/supermarkets and convenience stores represents approximately 25% of the grocery retail market as of 2021, with an estimated annual growth of 12%, according to Vietnam News. Modern hypermarket and supermarket chains are steadily capturing the market share of traditional retail, and these chains are valued by Vietnamese consumers for their hygienic and convenient shopping environments, as well as marketing promotions and loyalty programs.
Below is a list of key modern grocery retail chains in Vietnam. Many are owned and managed by Asian investors from Thailand, Japan, and South Korea. As a result, products from these countries get introduced into Vietnam. While most foreign food and beverages enter the Vietnamese market via local importers, some of the largest modern retail food chains, such as Big C and Coopmart, directly import products, including fresh fruit, beef and beef products, seafood, and non-alcoholic beverages for their outlets. In addition, these chains are steadily expanding their networks beyond tier-1 cities such as Ho Chi Minh City and Hanoi to tier-2 cities, such as, Da Nang (Central Vietnam), Hai Phong (Northern Vietnam), Can Tho (Southern Vietnam). Modern retail is expected to spread across these tier-2 cities in the coming years.
Major modern retail chains in Vietnam
Hyper / Supermarkets
- Aeon Mega Market
- Aeon Citimart
- Big C
- Co-op Mart
- Co-op Extra
- E-Mart
- Hapromart
- Annam Gourmet
- Lottemart
- MM Mega Market
- Nam An Market
- Q Mart
- Winmart
- BRG
Sources: Orissa International Research, Company Websites
Convenience Stores
Sources: Orissa International Research, Company Websites
E-commerce
Digital platforms are rapidly emerging in Vietnam and becoming an increasingly important channel. The Covid-19 pandemic accelerated the growth of this sector. A significant number of consumers who typically do not purchase products online made their first transactions during the lockdown period through e-commerce platforms, such as Shopee, Lazada, and Tiki. According to a Consumer Payment Attitudes survey of 1,000 consumers undertaken by Visa in Vietnam in 2020, 85% of consumers surveyed used e-commerce applications on their smartphones to pay for goods and services at least once a week, and 44% started shopping through social media channels for the first time since the start of the pandemic. The e-commerce platforms mentioned in the table below are the largest e-commerce platforms overall, besides being key players in F&B sector.
Major digital shopping platforms and delivery service providers in Vietnam
E-Commerce Platforms
Sources: Orissa International Research, Company Websites
Online Grocery Delivery Service Providers
Sources: Orissa International Research, Company Websites
In response to the changes in consumers’ shopping habits, modern retail chains, grocery suppliers, as well as small foodservice stakeholders such as restaurants, beverage shops, and bakeries have shifted to online sales via either their own or third-party platforms. With social distancing restrictions in place, many online grocery delivery service providers, such as Grabmart and Chopp, became essential enablers, driving this sector’s growth. These delivery services provide a speedy and convenient shopping experience to consumers, with delivery time ranging from within one hour to within one day. Apart from having platforms specifically for e-commerce purposes, Facebook is also a popular platform for businesses to interact with consumers.
Indirect listing is the common distribution pathway for those Canadian exporters that have not yet established a legal entity in Vietnam. Manufacturers and/or exporters can engage with a local importer or distributor as long as the importer or distributor has registered for trading in Vietnam and is willing to import, store, and deliver the products. This strategy enables foreign enterprises to overcome logistical, regulatory, and language challenges, especially if they want to test the market within a limited timeframe and explore consumer response to products.
To import products and sell them on local e-commerce platforms or retail stores, the importer/distributor must set up a local trading company or have legal representatives in Vietnam and obtain a business registration certificate and trading licence. Companies that do not have import licences must work through licensed traders, who typically charge a commission of between 1% and 2% of the invoice value. Under Vietnamese law, the importer is the consignee. Therefore, it is important to identify a reliable importer to clear merchandise through customs quickly and efficiently. If a licensed third-party importer is used, the importer will handle customs clearance. Products can be delivered to distributors before reaching end customers (B2B2C).
Importers are usually responsible for obtaining relevant permits and for adhering to the relevant regulations before the products are sold in the market. Importers are also in charge of transporting goods from a port of entry to the distributors’ warehouse unless otherwise agreed. At a subsequent stage, marketing and shipping activities targeting end customers would be taken care of by distributors. Marketing costs, promotion campaigns, web design dedicated to the brand, commission fees, and other issues should be negotiated between the parties.
Typically, the distribution network covers a particular area (Northern or Southern Vietnam, which are represented by the two largest cities, Hanoi and Ho Chi Minh City, respectively), the whole country, or even neighbouring markets, such as Laos and Cambodia. Depending on the sales channels and areas, distributors can use the e-commerce platforms’ logistics lines or local couriers to ship products to consumers. These enterprises distribute imported products to supermarkets and e-commerce platforms, besides establishing physical stores and websites to create an omnichannel network.