
December 16, 2016
PurposeFootnote 1
- To present the evaluation report and management response and action plan for approval.
Evaluation
- The Evaluation of Programs under the Agricultural Marketing Programs Act (AMPA) was included in AAFC's Five-Year Evaluation Plan (2014-15 to 2018-19) and fulfils the requirements of the Financial Administration Act and the Treasury Board Policy on Evaluation (2009).Footnote 2
- AMPA is a federal act establishing programs to facilitate and improve market opportunities for producers through the provision of loan and price guarantees. Of the three programs (Advance Payments Program [APP], Price Pooling Program [PPP], and Government Purchase Program [GPP]), APP is the most active.
Methodology
- The evaluation used multiple lines of evidence (including literature review, comparative analysis, document review, program performance data, surveys, interviews and cost-benefit analysis) to assess program activities undertaken and delivered from 2008-09 to 2014-15.
Evaluation findings
Relevance
- There continues to be a need for producers to have guaranteed access to low cost, short-term loans to support cash flow for farming operations and marketing of commodities.
- APP is used by medium to larger farms. For a producer to take advantage of the full $100,000 interest-free loan, they must have $200,000 worth of commodity as collateral.
- Based on the survey results, it is estimated that 3,092 producers would not have qualified for alternate financing at the same terms as APP, potentially leading to a shortfall of $315MFootnote 3 – money that may not have been injected into the sector.
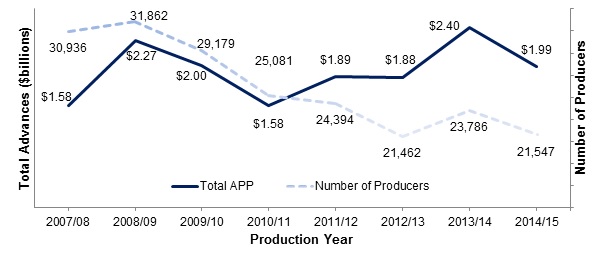
- As shown in Figures 1 and 2, even though the number of producers receiving regular APP advances is declining, the average APP advance amount has increased from $68,740 in 2009-10 to $101,700 in 2013-14.
| 2007-2008 | 2008-2009 | 2009-2010 | 2010-2011 | 2011-2012 | 2012-2013 | 2013-2014 |
|---|---|---|---|---|---|---|
| $51 150 | $83 060 | $68 740 | $62 800 | $77 670 | $87 700 | $101 700 |
Description of above image
Figure 2 illustrates the value of total APP regular advances and the number of producers from production year 2007/08 to 2014/15.
The value of total advances was:
- $1.58 billion in 2007/08
- $2.27 billion in 2008/09
- $2 billion in 2009/10
- $1.58 billion in 2010/11
- $1.89 billion in 2011/12
- $1.88 billion in 2012/13
- $2.40 billion in 2013/14
- $1.99 billion in 2014/15
The number of producers was:
- 30,936 in 2007/08
- 31,862 in 2008/09
- 29,179 in 2009/10
- 25,081 in 2010/11
- 24,394 in 2011/12
- 21,462 in 2012/13
- 23,786 in 2013/14 and
- 21,547 in 2014/15
- The AMPA programs align with federal priorities and AAFC's strategic outcomes of competitiveness and adaptability by providing producers with adequate cash flow so that producers have the flexibility to take advantage of markets when prices are high.
- AMPA programs do not duplicate or overlap with other federal or provincial programs.
- The APP and PPP also complement the financing provided by the private sector by reducing risk for commercial lenders and supplementing the short-term private financing available to producers.
- With the decline in demand for price pooling, cooperative marketing agencies that used PPP are switching to APP to better meet the demands of their producers.
Effectiveness
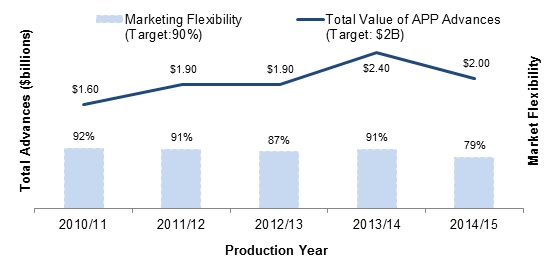
- The evaluation found that the APP and PPP are achieving their intended outputs and outcomes of providing producers access to low cost capital to reduce their short-term financial pressures. However, the APP partially met its targets for market flexibilityFootnote 4, with 2014/15 being 11% below its target of 92%, as demonstrated in Figure 3.
Description of above image
Figure 3 illustrates how well APP has met its performance targets from 2010/11 to 2014/15. The target for marketing flexibility was 90% and the target for total value of advances was 2 billion dollars.
- In 2010/11, APP advanced 1.6 billion dollars and provided marketing flexibility at 92%
- In 2011/12, APP advanced 1.9 billion dollars and provided marketing flexibility at 91%
- In 2012/13, APP advanced 1.9 billion dollars and provided marketing flexibility at 87%
- In 2013/14, APP advanced 2.4 billion dollars and provided marketing flexibility at 91%
- In 2014/15, APP advanced 2.0 billion dollars and provided marketing flexibility at 79%.
- The evaluation also found that the increased marketing flexibility achieved as a result of the APP had a significant impact on producers of storable commodities who benefited significantly from the ability to delay marketing their products.
- 80% of the producers surveyed reported that the price of their products increased as a result of the marketing delay, with an average price increase of 14.8%.
- The APP has achieved its intended end outcome of enabling producers to better manage business risks associated with cash flow demands while the PPP has achieved this intended outcome to a more limited extent due to low program uptake.
Efficiency and economy
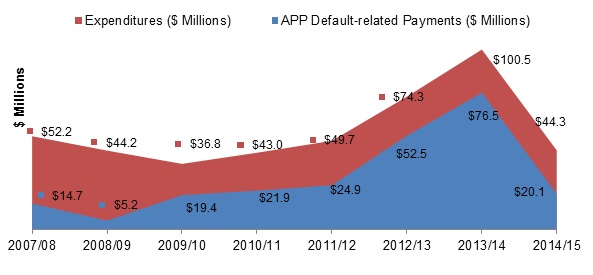
- The administration of the APP and PPP is efficient. As shown below, program expenditures have returned to levels before the enactment of the Severe Economic Hardship provision to help cattle and hog producers in the 2008-09.
Description of above image
Figure 4 illustrates the program expenditrures and default related payments by year from 2007/08 to 2014/14 for APP and PPP.
- APP and PPP's program expenditures was 52.2 million and APP provided 14.7 million in default related payments in 2007/8
- APP and PPP's program expenditures was 44.2 million and APP provided 5.2 million in default related payments in 2008/9
- APP and PPP's program expenditures was 36.8 million and APP provided 19.4 million in default related payments in 2009/10
- APP and PPP's program expenditures was 43.0 million and APP provided 21.9 million in default related payments in 2010/11
- APP and PPP's program expenditures was 49.7 million and APP provided d 24.9 million in default related payments in 2011/12
- APP and PPP's program expenditures 74.3 million and APP provided 52.5 million in default related payments in 2012/13
- APP and PPP's program expenditures was 100.5 million and APP provided 76.5 million in default related payments in 2013/14
- APP and PPP's program expenditures was 44.3 million and APP provided 20.1 million in default related payments in 2014/15
- The costs to deliver the PPP are very low and there has not been a claim made by marketing agencies against the price guarantee since the AMPA was enacted in 1997.
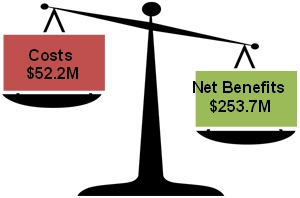
- The economic benefits of the APP significantly outweigh the program costs with its net benefits estimated at $253.7M versus $52.2M in costs, as seen in Figure 5.
Description of above image
Unbalanced scale with Costs ($52.2 million) on one platform and Net Benefits $253.7 million on the other platform.
- Evidence, at the time of the evaluation, suggested that the APP would provide a cheaper delivery option than ad hoc programming.
Recommendations
- Recommendation 1: Programs Branch should develop a framework for assessing whether or not an economic emergency situation would likely be substantially mitigated by APP through the Severe Economic Hardship provision.
- Recommendation 2: Programs Branch should review the APP and PPP logic model and performance measurement strategy to ensure that outputs, outcomes and indicators accurately define and measure program performance. In particular, the Branch should assess how the Business Risk Management program survey can be best leveraged to provide data for indicators related to intermediate and end outcomes.