
Description of above image (1 of 2)
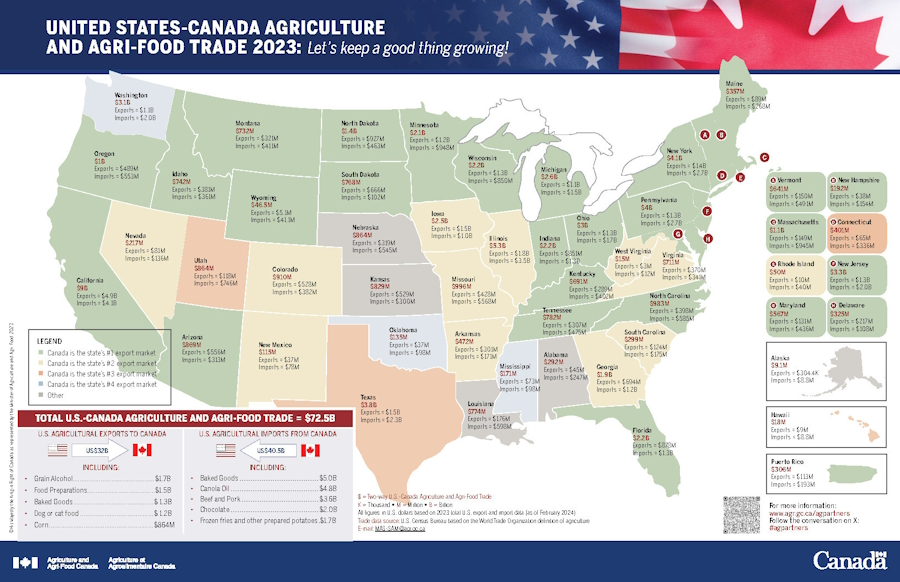
Total U.S.-Canada agriculture and agri-food trade = $72.6B
U.S. agricultural exports to Canada = US$32 billion including:
- Grain Alcohol: $1.7 billion
- Food Preparations: $1.5 billion
- Baked Goods: $1.3 billion
- Dog or cat food: $1.2 billion
- Corn: $864 million
U.S. agricultural imports from Canada = US$40.5 billion including:
- Baked Goods: $5.0 billion
- Canola Oil: $4.8 billion
- Beef and Pork: $3.6 billion
- Chocolate: $2.0 billion
- Frozen fries and other prepared potatoes: $1.7 billion
| State | Exports | Imports | Total |
|---|---|---|---|
| Alabama | $45m | $247m | $292m |
| Alaska | $304.4k | $8.8m | $9.1m |
| Arizona | $556m | $313m | $869m |
| Arkansas | $301m | $171m | $472m |
| California | $4.9b | $4.1b | $9b |
| Colorado | $528m | $382m | $910m |
| Connecticut | $65m | $336m | $401m |
| Delaware | $217m | $108m | $325m |
| Florida | $878m | $1.3b | $2.2b |
| Georgia | $694m | $1.2b | $1.9b |
| Hawaii | $9m | $8.8m | $18m |
| Idaho | $381m | $361m | $742m |
| Illinois | $1.8b | $3.5b | $5.3b |
| Indiana | $851m | $1.3b | $2.2b |
| Iowa | $1.5b | $1.0b | $2.5b |
| Kansas | $529m | $300m | $829m |
| Kentucky | $289m | $402m | $691m |
| Louisiana | $176m | $598m | $774m< |
| Maine | $89m | $268m | $357m |
| Maryland | $131m | $436m | $567m |
| Massachusetts | $149m | $945m | $1.1b |
| Michigan | $1.1b | $1.5b | $2.6b |
| Minnesota | $1.2b | $948m | $2.1b |
| Mississippi | $73m | $98m | $171m |
| Missouri | $428m | $568m | $996m |
| Montana | $321m | $411m | $732m |
| Nebraska | $319m | $545m | $864m |
| Nevada | $81m | $136m | $217m |
| New Hampshire | $38m | $154m | $192m |
| New Jersey | $1.3b | $2.0b | $3.3b |
| New Mexico | $37m | $78m | $115m |
| New York | $1.4b | $2.7b | $4.1b |
| North Carolina | $398m | $585m | $983m |
| North Dakota | $927m | $463m | $1.4b |
| Ohio | $1.3b | $1.7b | $3b |
| Oklahoma | $37m | $98m | $135m |
| Oregon | $489m | $553m | $1b |
| Pennsylvania | $1.3b | $2.7b | $4b |
| Puerto Rico | $113m | $193m | $306m |
| Rhode Island | $10m | $40m | $50m |
| South Carolina | $124m | $175m | $299m |
| South Dakota | $666m | $102m | $768m |
| Tennessee | $307m | $475m | $782m |
| Texas | $1.5b | $2.3b | $3.8b |
| Utah | $118m | $746m | $864m |
| Vermont | $150m | $491m | $641m |
| Virginia | $370m | $341m | $711M |
| Washington | $1.1b | $2.0b | $3.1b |
| West Virginia | $3m | $12m | $15m |
| Wisconsin | $1.3b | $850m | $2.2b |
| Wyoming | $5.1m | $41.1m | $46.5m |
k = Thousand
m = Million
b = Billion
All figures in U.S. dollars and based on 2023 total U.S and Canada export and import data (as of February 2024).
Trade data source: U.S. Census Bureau and Statistics Canada based on the World Trade Organization definition of agriculture.
Email: aafc.mas-sam.aac@agr.gc.ca
For more information: www.agr.gc.ca/agpartners
Follow the conversation on X: #agpartners
Description of above image (2 of 2)
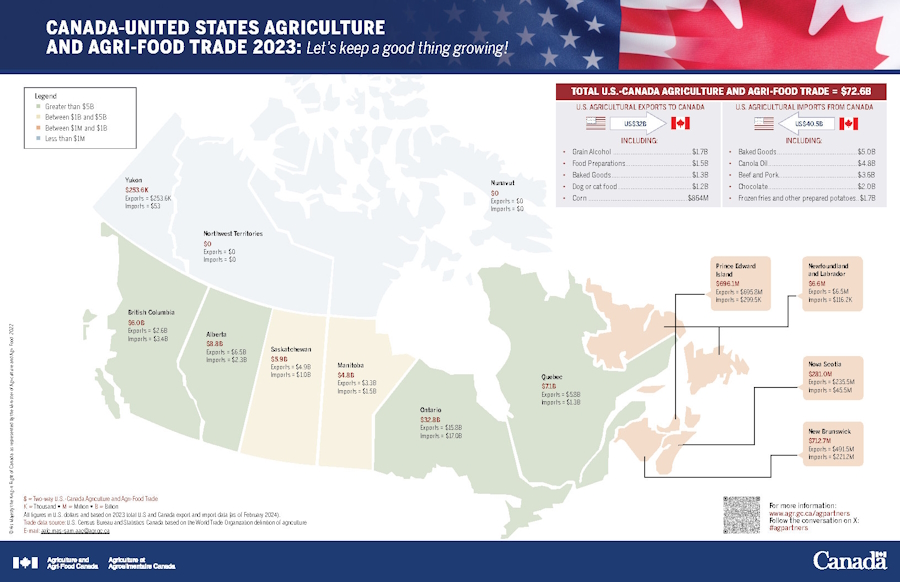
Total U.S.-Canada agriculture and agri-food trade = $72.6B
U.S. agricultural exports to Canada = US$32 billion including:
- Grain Alcohol: $1.7 billion
- Food Preparations: $1.5 billion
- Baked Goods: $1.3 billion
- Dog or cat food: $1.2 billion
- Corn: $864 million
U.S. agricultural imports from Canada = US$40.5 billion including:
- Baked Goods: $5.0 billion
- Canola Oil: $4.8 billion
- Beef and Pork: $3.6 billion
- Chocolate: $2.0 billion
- Frozen fries and other prepared potatoes: $1.7 billion
| Province/territory | Exports | Imports | Total |
|---|---|---|---|
| Alberta | $6.5b | $2.3b | $8.8b |
| British Columbia | $2.6b | $3.4b | $6.0b |
| Manitoba | $3.3b | $1.5b | $4.8b |
| New brunswick | $491.5m | $221.2m | $712.7m |
| Newfoundland and Labrador | $6.5m | $116.2k | $6.6m |
| Northwest Territories | $0 | $0 | $0 |
| Nova Scotia | $235.5m | $45.5m | $281.0m |
| Nunavut | $0 | $0 | $0 |
| Ontario | $15.8b | $17.0b | $32.8b |
| Prince Edward Island | $695.8m | $299.5k | $696.1m |
| Quebec | $5.8b | $1.3b | $7.1b |
| Saskatchewan | $4.9b | $1.0b | $5.9b |
| Yukon | $253.6k | $53 | $253.6k |
k = Thousand
m = Million
b = Billion
All figures in U.S. dollars and based on 2023 total U.S and Canada export and import data (as of February 2024).
Trade data source: U.S. Census Bureau and Statistics Canada based on the World Trade Organization definition of agriculture.
Email: aafc.mas-sam.aac@agr.gc.ca
For more information: www.agr.gc.ca/agpartners
Follow the conversation on X> using #agpartners
Alternative formats
United States-Canada agriculture and agri-food trade 2023 (PDF Version, 398 KB)
Canada-United States agriculture and agri-food trade 2023 (PDF Version, 321 KB)