
Summary
- In agricultural systems, bare soil is highly susceptible to degradation. Soil degradation can reduce crop productivity and lead to environmental damage.
- The Soil Cover Indicator measures the number of days in a year that agricultural soil is not bare and whether this is changing over time.
- Overall, soil cover has increased in Canada's cropland over time because of increases in reduced tillage and no-till farming and decreases in summer fallow.
- However, soil cover has also declined greatly in some parts of British Columbia, Quebec and the Maritimes. This has been largely driven by shifts from perennial to annual crops.
- The number of soil cover days can be increased by reducing tillage, replacing summer fallow with cover crops, and enhancing soil cover for annual and low-residue crops through further research and development.
Soil Cover in Canada: why does it matter?
In agricultural systems, soils covered by vegetation, crop residue or snow are partially protected from exposure. Bare soil is highly susceptible to degradation. Degraded soils can result in reduced crop productivity and environmental damage.
Soil degradation can be caused by wind and water erosion, loss of organic matter, breakdown of soil structure and loss of fertility. These factors can reduce crop yield and limit the crop types that can be grown. In extreme cases, soil degradation can result in the loss of productive agricultural land. Reduced crop productivity, and the need for more inputs to soil (such as fertilizers), can reduce profitability.
Decrease of soil cover can also lead to environmental damage. Exposed soil is susceptible to erosion and is more likely to contribute to contaminated water and air. The risk of water contamination can increase when nutrients (such as phosphorus and nitrogen) and pesticides are carried with soils eroded from agricultural fields. Exposed soil can also contribute to climate change through increased greenhouse gas emissions. In addition, bare soil provides very little habitat for wildlife. This can result in reduced farmland biodiversity.
Increasing soil cover benefits producers and the environment. The Government of Canada must report on soil cover days on farmland. This helps the public and other countries know if Canada's farmlands are healthy and where improvements to farming practices need to be made.
What determines soil cover?
Soil cover is primarily influenced by crop type, residue management, tillage practices and annual snow cover. The type of crop grown determines row spacing, growth rate, vegetation cover fraction, and the amount of above and below ground plant material (biomass) produced. Perennial field crops (such as hay) offer good, year-round, soil coverage. Annual crops (such as wheat or corn) can leave soil exposed for a period after planting or after fall harvest and tillage. Crops such as beans, peas, canola and potatoes tend to have a full canopy for short periods and leave lower residue levels after harvest.
Residue management and tillage practices can also have a large impact on soil cover. Intensive tillage (also referred to as conventional tillage) reduces soil cover by incorporating most crop residue into the soil. Reduced tillage and no-till methods provide more soil cover by leaving more crop residue on the soil surface. The timing of tillage can also influence soil cover. Tilling land in the fall leaves soil exposed for a greater length of time than tilling in the spring. The practice of summer fallow (which traditionally adopted to restore soil moisture in dry climate regions) leaves soil susceptible to erosion.
Climate and weather can also influence soil cover. Soil covered by snow for long periods is less exposed and less susceptible to degradation. Climate change is predicted to decrease the number of snow cover days and increase how often extreme weather events occur. Both of these factors could increase vulnerability of soils to degradation.
Soil Cover Indicator
The soil cover indicator measures the number of days that agricultural soil is not bare in a given year. It also measures whether this is changing over time. It includes all agricultural land cover types including crops, pasture and other lands used in farming. To assess this, the Indicator considers soil cover provided by crop canopy, crop residue and snow on the soil surface. It takes into account the schedule of different field activities (such as planting and harvesting) and crop canopy development and decline throughout the season. It also considers tillage practices, the decomposition of residue, the number of days with at least 2 centimetres of snow and multiple cuts of hay and grazing on pasture.
A perennial hay crop typically provides more than 300 soil cover days per year since there is very little soil exposed at any time. On the other hand, a soybean crop in an area of low snowfall and with no other surface cover elements may have less than 150 soil cover days.
The Government of Canada calculates the Soil Cover Indicator every five years. It helps the Government know how soil cover on farmland is changing over time. This helps to identify where changes to farming practices are needed.
Soil Cover in Canada – current state and the change over time
In 2021, Canada had a ‘Moderate’ soil cover rating with an average of 276.1 days of soil cover.
Areas of High and Very High soil cover were concentrated in British Columbia, Quebec, New Brunswick, Nova Scotia and Newfoundland and Labrador. Very Low and Low soil cover days were concentrated in southern Ontario, Manitoba and Saskatchewan.
The soil cover indicator is ranked into classes according to the number of soil cover days in a year, as Very Low (<250 days), Low (250-274 days), Moderate (275-299 days), High (300-324 days) or Very High (>325 days).
Soil cover days in Canada, 2021
Overall, the number of soil cover days increased between 1981 and 2021 (from 255 days to 276 days). The proportion of farmland in the Very High and High soil cover days classes remained relatively stable over time. However, there was a decrease in the proportion of farmland in the Very Low class (from 47% to 9%) at the same time as an increase in the proportion of farmland in the Moderate class (from 17% to 32%) and the Low class (from 27% to 43%).
Change in soil cover days, 1981-2021
These changes were mostly driven by reduced area of cropland under conventional tillage and summer-fallow. Over this period, the percent of cropland with summer-fallow decreased from 21% to 1% and the percent of cropland with no-till increased by from 1% to 60%. This pattern was mainly driven by changes in the Prairies because of their large area of agricultural land.
Regional trends
Differences in soil cover days across Canada were caused by differences in tillage and residue management practices, the crop types, the frequency of perennial crop harvest or grazing, the use of summer-fallow, snow-cover and soil-climatic conditions.
British Columbia
In 2021, areas of Low soil cover days occurred in the southern part of the province. Between 1981 and 2021, soil cover days increased in the province from 289 days to 302 days (by approximately 4%). However, some areas in southern British Columbia showed a decrease in soil cover of more than 10 days because of large shifts from perennial to annual crops.
Atlantic Canada
As of 2021, the Atlantic Provinces had the highest number of soil cover days in Canada. This has remained relatively stable since 1981. High soil cover days is mainly caused by a relatively lower proportion of annual crops in Nova Scotia, New Brunswick, and Newfoundland and Labrador than in other parts of Canada.
Quebec
As of 2021, the number of soil cover days was High or Very High for most of Quebec. This pattern has remained relatively stable since 1981. In some areas, soil cover has improved because of an increase in no-till practices from less than 1% to about 18% of crop area. However, soil cover days in the St. Lawrence lowlands region has shown large decreases. This has mainly been caused by an increase annual crop area over time (from about 25% of crop area in 1981 to 50% of crop area in 2021).
Ontario
Other than in Manitoba, Ontario’s farmland has had the lowest number of soil cover days in Canada and this has remained relatively stable over time. In 2021, Ontario had the highest percentage of farmland in the Very Low class in all of Canada. All of this land is found in southern Ontario. Between 1981 and 2021, soil cover increased because of an increase in no-till farming from less than 1% of crop area to about 39% of crop area. However, this increase was outweighed by increases in the amount of annual cropland over time (from about 47% in 1981 to about 65% in 2021).
The Prairies
The Prairies, generally, have lower soil cover than other regions of Canada because of a higher proportion of farmland under annual crops. Many areas of Low or Very Low soil cover days occur in the southern Prairies. However, since 1981, the greatest increases in soil cover have occurred in this region because of large decreases in summer-fallow and increases in reduced tillage. Between 1981 and 2021, the number of soil cover days increased in Saskatchewan by 14% (from 234.9 days to 268.3 days), in Manitoba by 7% (from 250.3 days to 267.6 days) and in Alberta by 6% (from 262.3 days to 278.6 days).
How can soil cover be improved?
Although soil cover has generally improved across Canada since the 1980s, improvement has slowed in recent years. Additionally, some areas of Canada show Very Low or declining soil cover.
Soil cover can be improved by adopting reduced tillage practices where possible. Additionally, soil cover can be enhanced for annual and low-residue crops such as potatoes, canola, soybeans, vegetables and nursery crops. For these cropping systems, planting green manure or winter cover crops as soon as possible after harvesting will increase soil cover during the long period between fall harvesting and spring planting. This could become especially important if climate change reduces annual snowfall or increases extreme weather events.
Important areas for further research and development to improve soil cover include:
- intercropping systems which cultivate multiple crops in a field at the same time
- cold-germination varieties of crops for use under no-till
- farming equipment that better maintains surface residue during production and harvest
- crops with more durable foliage
Description of the image above
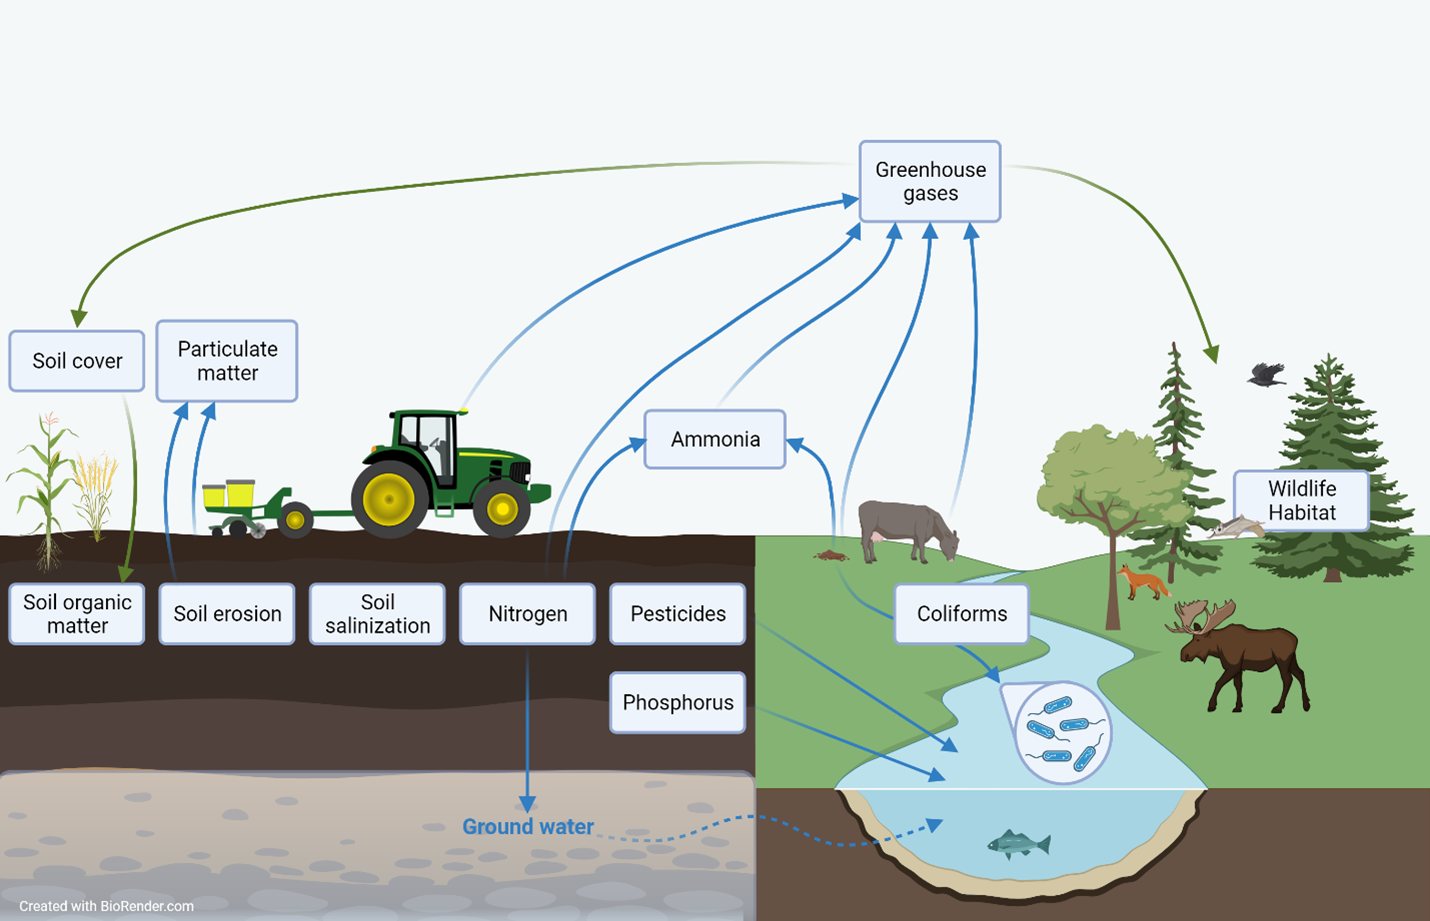
An infographic showing an agricultural landscape with crops, a tractor, soil and grazing livestock adjacent to a natural landscape with a watercourse, forest and wild animals. Info boxes are placed to show to which element of the landscape each agricultural sustainability indicator pertains. Arrows connect some of the info boxes to show interrelationships. One info box is present for each of the following indicators: Soil cover, particulate matter, soil organic matter, soil erosion, soil salinization, nitrogen, pesticides, phosphorus, ammonia, greenhouse gases, coliforms and wildlife habitat.
Agriculture and Agri-Food Canada's agri-environmental indicators (AEIs) provide a science-based snapshot of the current state and trend of Canada's agri-environmental performance in terms of soil quality (soil organic matter, soil erosion, soil salinization), water quality (nitrogen, pesticides, phosphorus, coliforms), air quality (particulate matter, ammonia, greenhouse gas emissions) and farmland management (agricultural land use, soil cover, wildlife habitat). While indicator results are presented individually, agro-ecosystems are complex, so many of the indicators are interrelated. This means that changes in one indicator may be associated with changes in other indicators as well.
Additional sources and downloads
Discover and download geospatial data related to this and other indicators.