

Note: This report includes forecasting data that is based on baseline historical data.
Executive summary
India is the largest producer and consumer of pulses in the world; however increasingly growing consumption exceeds domestic production, requiring support supplementation from imports.
India is a net importer of pulses. In 2023, India's pulse trade deficit was US$2.4 billion as imports were valued at US$3.1 billion, while exports were valued at US$704.7 million.
India's top imported pulses were lentils with values of US$1.3 billion (40.6% market share), followed by pigeon peas with values of US$833.4 million (27.0% market share) and beans with values of US$603.6 million (19.6% market share).
Canada's top pulses exported to India were lentils with values of US$543.9 million (91.6% market share), representing a significant increase in growth of 53.9% from US$63.1 million in 2018, followed by yellow peas with values of US$41.9 million (7.1% market share) and chickpeas with values of US$7.6 million in 2023.
India was the largest global pulse market with retail sales of US$77.8 billion (77.2% market share) in 2023. Other pulses were India's largest segment with retail sales of US$58.8 billion (75.6% market share), followed by peas with retail sales of US$12.9 billion (16.5% market share), and beans with US$6.1 billion (7.8% market share) in 2023.
The growing prominence of healthier lifestyles, in addition to the consumer's use of pulses in traditional and conventional daily meals, are expected to generate increased demand for pulses as a sustainable option for plant-based proteins.
According to Mintel's Global New Products Database (GNPD), there were 5,440 new pulse products launched in India from January 2018 to December 2023. Of these 5,440 new products, 5,134 were food products, 196 were drink products, while 110 were categorized as pet product launches.
Pulses in India
India is the largest producer and consumer of pulses in the world; however increasingly growing consumption exceeds domestic production, requiring support supplementation from imports (Agriculture in India).
The dry seeds of leguminous plants, pulses are considered an economical and nutrient rich source of protein, carbohydrates, and dietary fiber, and are a central component of the Indian diet. Pulses also contain phytochemicals which have anti-inflammatory, anti-cancer, anti-microbial, and anti-ulcerative properties. In addition, pulses are also rich in vitamins [folate, thiamine (B1), riboflavin (B2), and niacin (B3)] and minerals (potassium, calcium, magnesium, phosphorus, and iron) (ScienceDirect, Abstract excerpt from 'Indian pulses: A review on nutritional, functional and biochemical properties with future perspectives', June 2019).
According to Agriculture in India, pulses are grown on 22-23 million hectares with an annual production of 13-15 million tonnes. India accounts for 33% of the world area and 22% of the world production of pulses. Pulse production contributes to maintaining and restoring soil health and fertility through their root systems, improving aeration and water infiltration and enhancing soil nitrogen content. Further as pulses grow, they add organic matter to the soil through leaf and flower fall, enriching the soil's nutrient content, while vegetative coverage helps reduce soil erosion.
India has three cropping seasons, kharif, rabi and summer. Kharif crops (paddy, maize, sorghum, pearl millet, pigeon pea, green gram, black gram, groundnut, cotton and sugarcane) are sown from June to July and are dependent on monsoon rains for harvest (October to November) (Agriculture Times, January 2023), while rabi crops (wheat, rice, jowar, maize, barley, chickpea/gram, groundnut, rapeseed and mustard) are sown October to November for harvest (between January to March) (Agribazaar, January 2022). Crops produced between rabi and kharif seasons are summer crops (The Economic Times, August 2023). Pulses are grown in both kharif and rabi seasons however Rabi pulses provide more than 60.0% of production (vikasspedia, 2021).
Common grown pulse crops in India include chickpea, pigeon pea, green gram, black gram, lentil, field pea, lathyrus, cowpea, moth bean and French bean. Chickpeas and pigeon peas, however, are considered the most important pulse crops. The states of Madhya Pradesh, Rajasthan, Maharashtra, Uttar Pradesh, and Andhra Pradesh, together account for 82.0% of the country's pulse production (Agriculture in India). India primarily consumes chana (chickpea), masur (red lentil), urad (black gram), kabuli chana (white chickpea), and tur (pigeon pea) (The Economic Times; April 17, 2024).
Pulses are generally grown by farmers with limited resources as alternate crops to the higher demanded, cash crops of paddy and wheat (Agriculture in India). Recently, Indian farmers lobbied for increased, and legislated crop prices for all of their produce, after farmers' unions rejected five-year contracts for minimum support prices (MSPs or guaranteed support prices for pulses, corn and cotton), proposed by the Indian government (Reuters, 2024).
Production
The Ministry of Agriculture estimates that India's output of pulses has declined to 23.4 million tonnes in 2023-24 from 26.1 million tonnes a year ago (Hindustan Times, April 2024). Of note, India's Meteorological Department (IMD) recently reported that the country is likely to witness an 'above normal' monsoon season this year with above average rainfall expected in most parts of India, except in some regions of northwest, east and northeastern states. The La Nina conditions, which are associated with a favourable monsoon in India, are likely to develop by August-September, according to IMD (FinancialExpress Business; April 2024). Relatedly, trade and industry experts report that the country's pulse acreage is expected to increase by 15.0% in the kharif season due to record high pulse prices and forecasted above normal monsoon rains, attracting farmers to these key kharif pulses, as returns from soybean have been below expectation. In 2023, the acreage of pulses declined by 5.4% due to delayed and deficit rains during the crucial sowing season (The Economic Times; April 16, 2024).
Chickpeas were the largest crop in India with production valued at 13.5 million tonnes in 2022, increasing 7.6% annually from 9.4 million tonnes produced in 2017. Madhya, Pradesh, Rajasthan, Maharashtra, Gujarat, Uttar Pradesh, Andhra Pradesh, Karnataka, Chhattisgarh, Bihar, and Jharkhand yield more than 95.0% of the country's chickpea production (Project Coordinator's Report 2021-22; ICAR-Indian Institute of Pulses Research).
Beans were the second largest crop produced with volumes registering 6.6 million tonnes in 2022, while pigeon and pea crops decreased in production by a compound annual growth rate (CAGR) of 2.8% and 0.1% respectively, from in the historic period.
Crops | 2017 | 2018 | 2019 | 2020 | 2021 | 2022 | CAGR* % 2017-2022 |
|---|---|---|---|---|---|---|---|
Chickpeas[1], dry | 9,377,560 | 11,379,190 | 9,937,990 | 11,078,500 | 11,911,180 | 13,543,630 | 7.6 |
Beans[1], dry | 6,340,000 | 6,220,000 | 5,310,000 | 5,460,000 | 6,120,000 | 6,610,000 | 0.8 |
Pigeon peas, dry | 4,873,240 | 4,289,820 | 3,315,440 | 3,891,730 | 4,315,900 | 4,220,190 | −2.8 |
Lentils[1], dry | 1,223,850 | 1,621,810 | 1,227,820 | 1,103,030 | 1,493,850 | 1,268,830 | 0.7 |
Other pulses, not elsewhere classified | 914,011 | 1,000,000 | 951,384 | 972,046 | 1,008,302 | 1,021,459 | 2.2 |
Peas[1], dry | 1,011,190 | 993,250 | 811,810 | 860,160 | 876,542 | 1,004,402 | −0.1 |
Source: FAOSTAT Agricultural Production, 2024 *CAGR: Compound Annual Growth Rate 1: Crops that are also produced in Canada | |||||||
Global trade overview of pulse imports
The global market for pulses has experienced positive value growth with a CAGR of 9.3% as imports increased from US$9.2 billion, (15.0 billion kilograms) in 2018 to US$14.3 billion, (19.8 billion kilograms) in 2023. India was the largest global market for pulses in 2023 with imports valued at US$3.1 billion (21.5% market share), 3.6 billion kilograms, representing a substantial increase in CAGR of 23.7% from US$1.1 billion in 2018, followed by China with imports valued at US$1.7 billion (12.0% market share), 3.4 billion kilograms, representing an increase in CAGR of 17.6% from US$765.9 million in 2018 and Türkiye, with import values of US$1.2 billion (8.2% market share), 1.6 billion kilograms, in 2023.
Canada in comparison, was the tenth largest global market for pulses with import values of US$292.1 million (2.0% market share), 313.6 million kilograms in 2023, representing a moderate increase in CAGR of 15.8% from imports of US$140.4 million in 2018.
Country | 2018 | 2019 | 2020 | 2021 | 2022 | 2023 | CAGR* % 2018-2023 | Market share % in 2023 |
|---|---|---|---|---|---|---|---|---|
World Total | 9,190.2 | 8,747.4 | 10,433.3 | 11,829.4 | 13,408.4 | 14,327.3 | 9.3 | 100.0 |
India | 1,063.1 | 1,548.8 | 1,563.6 | 2,094.8 | 1,948.7 | 3,082.5 | 23.7 | 21.5 |
China | 765.9 | 799.5 | 1,070.4 | 1,187.4 | 1,749.2 | 1,721.8 | 17.6 | 12.0 |
Türkiye | 411.5 | 388.7 | 553.4 | 670.4 | 856.1 | 1,180.2 | 23.5 | 8.2 |
United States | 436.6 | 357.5 | 456.3 | 550.9 | 683.0 | 659.0 | 8.6 | 4.6 |
Pakistan | 551.4 | 463.1 | 655.6 | 766.9 | 797.5 | 579.7 | 9.7 | 4.0 |
Egypt | 384.7 | 406.4 | 384.5 | 446.7 | 498.1 | 542.3 | 7.1 | 3.8 |
Mexico | 237.6 | 145.2 | 194.5 | 249.7 | 170.3 | 451.6 | 13.7 | 3.2 |
Spain | 318.8 | 214.0 | 227.2 | 193.8 | 219.6 | 420.7 | 5.7 | 2.9 |
Italy | 289.7 | 253.2 | 342.6 | 359.0 | 374.7 | 418.2 | 7.6 | 2.9 |
Canada (10) | 140.4 | 186.0 | 214.2 | 196.4 | 211.4 | 292.1 | 15.8 | 2.0 |
Source: Global Trade Tracker, 2024 1: HS code 0713 *CAGR: Compound Annual Growth Rate | ||||||||
Country | 2018 | 2019 | 2020 | 2021 | 2022 | 2023 | CAGR* % 2018-2023 | Market share % in 2023 |
|---|---|---|---|---|---|---|---|---|
World Total | 14,955.2 | 14,992.9 | 17,535.0 | 16,465.9 | 16,870.4 | 19,750.1 | 5.7 | 100.0 |
India | 2,394.0 | 3,218.1 | 2,518.2 | 2,601.9 | 2,419.2 | 3,633.3 | 8.7 | 18.4 |
China | 2,249.3 | 2,243.5 | 3,201.9 | 2,633.7 | 2,588.6 | 3,448.4 | 8.9 | 17.5 |
Türkiye | 719.2 | 718.7 | 943.5 | 973.3 | 1,224.5 | 1,641.6 | 17.9 | 8.3 |
Egypt | 2.5 | 119.6 | 807.9 | 605.3 | 1,039.2 | 1,604.8 | N/C | 8.1 |
Pakistan | 973.0 | 954.7 | 1276.7 | 1,226.2 | 1,087.3 | 875.3 | −2.1 (2018-08/2023) | 4.4 |
Spain | 780.4 | 383.6 | 365.0 | 267.8 | 226.5 | 792.7 | 0.3 | 4.0 |
United States | 651.0 | 518.0 | 490.9 | 657.0 | 725.7 | 720.7 | 2.1 | 3.6 |
Italy | 405.2 | 375.9 | 502.3 | 499.0 | 421.1 | 504.4 | 4.5 | 2.6 |
Vietnam[1] | 239.5 | 233.4 | 271.6 | 372.8 | 453.8 | 17.3 (2019-2023) | 2.3 | |
Mexico | 351.8 | 196.8 | 244.2 | 266.6 | 144.7 | 395.7 | 2.4 | 2.0 |
Canada (13) | 170.5 | 302.6 | 322.6 | 244.9 | 201.6 | 313.6 | 13.0 | 1.6 |
Source: Global Trade Tracker, 2024 *CAGR: Compound Annual Growth Rate N/C:; not calculable 1: reported data available only from January 2019 | ||||||||
India trade overview of pulse imports
India has a diverse network of pulse suppliers. In 2023, the top three suppliers of pulses to India were Myanmar with values of US$864.2 million (28.0% market share), 860.5 million kilograms, followed by Canada with values of US$670.4 million (21.7% market share), 858.4 million kilograms and representing a measurable increase in CAGR of 42.8% from US$112.8 million in 2018, and Australia with values of US$539.6 million (17.5% market share), 787.5 million kilograms. Of the top suppling countries in 2023, Myanmar is Canada's primary competitor for pulse provision to India, in addition to Australia, which has increased its supply by 167.8% between 2022 to 2023, capturing some of Tanzania's and Mozambique's most recent (2023) market share presence.
Country | 2018 | 2019 | 2020 | 2021 | 2022 | 2023 | CAGR* % 2018-2023 | Market share % in 2023 |
|---|---|---|---|---|---|---|---|---|
World | 1,063.1 | 1,548.8 | 1,563.6 | 2,094.8 | 1,948.7 | 3,082.5 | 23.7 | 100.0 |
Myanmar | 293.2 | 343.1 | 384.8 | 614.0 | 685.3 | 864.2 | 24.1 | 28.0 |
Canada | 112.8 | 438.9 | 502.6 | 410.8 | 325.6 | 670.4 | 42.8 | 21.7 |
Australia | 98.0 | 40.9 | 72.6 | 120.5 | 201.5 | 539.6 | 40.7 | 17.5 |
Tanzania | 31.4 | 131.1 | 156.1 | 281.7 | 128.4 | 273.9 | 54.2 | 8.9 |
Mozambique | 104.1 | 114.7 | 159.9 | 208.4 | 329.5 | 269.8 | 21.0 | 8.8 |
Sudan | 45.5 | 29.8 | 24.7 | 91.6 | 29.3 | 127.8 | 22.9 | 4.1 |
Brazil | 38.0 | 58.5 | 39.8 | 92.3 | 82.0 | 68.6 | 12.6 | 2.2 |
Malawi | 10.3 | 32.9 | 1.7 | 34.7 | 43.9 | 46.6 | 35.2 | 1.5 |
Russia | 66.9 | 55.1 | 40.2 | 5.1 | 0.3 | 34.3 | −12.5 | 1.1 |
Ethiopia | 15.6 | 25.6 | 10.1 | 19.2 | 12.1 | 31.2 | 14.9 | 1.0 |
Source: Global Trade Tracker, 2024 *CAGR: Compound Annual Growth Rate | ||||||||
Country | 2018 | 2019 | 2020 | 2021 | 2022 | 2023 | CAGR* % 2018-2023 | Market share % in 2023 |
|---|---|---|---|---|---|---|---|---|
World | 2,394.0 | 3,218.1 | 2,518.2 | 2,601.9 | 2,419.2 | 3,633.3 | 8.7 | 100.0 |
Myanmar | 591.4 | 527.3 | 467.9 | 679.5 | 777.1 | 860.5 | 7.8 | 23.7 |
Canada | 309.8 | 1,200.4 | 970.4 | 568.2 | 401.8 | 858.4 | 22.6 | 23.6 |
Australia | 171.3 | 93.8 | 137.3 | 171.0 | 243.9 | 787.5 | 35.7 | 21.7 |
Mozambique | 217.4 | 173.7 | 234.5 | 274.0 | 492.5 | 330.8 | 8.8 | 9.1 |
Tanzania | 63.1 | 219.7 | 246.2 | 383.0 | 199.3 | 310.3 | 37.5 | 8.5 |
Sudan | 94.4 | 51.2 | 38.1 | 122.6 | 33.8 | 130.6 | 6.7 | 3.6 |
Brazil | 64.8 | 89.4 | 58.1 | 89.1 | 70.1 | 69.5 | 1.4 | 1.9 |
Malawi | 29.3 | 54.0 | 2.5 | 48.3 | 67.4 | 53.1 | 12.6 | 1.5 |
Russia | 254.4 | 167.4 | 100.4 | 11.9 | 0.8 | 36.8 | −32.1 | 1.0 |
Ethiopia | 25.4 | 44.9 | 13.1 | 21.0 | 14.8 | 32.9 | 5.3 | 0.9 |
Source: Global Trade Tracker, 2024 *CAGR: Compound Annual Growth Rate | ||||||||
India is a net importer of pulses. In 2023, India's pulse trade deficit was US$2.4 billion as imports were valued at US$3.1 billion, while exports were valued at US$704.7 million. The country's reliance on imports is multifaceted, and can be attributed in part, to insufficient domestic production (recent drought and stringent government regulations on the use of fertilizers and pesticides effecting production yields), coupled with increasing demand, and subsequent rising commodity prices (Hindustan Times; April 2024). Of note, the Indian government has recently extended duty-free imports of yellow peas to October 31, 2024, from earlier extension dates of March, April and June, 2024, and removed the import duty on desi chana (Bengal gram) until the end of fiscal year 2025 (Financial Express, May 2024). In addition, in response to addressing growing commodity prices, the government has imposed stock limits on pulses and has asked states to remain vigilant against hoardings (The Economic Times; April 17, 2024). India's increasing imports have also contributed to a greater variety in types and quality of pulses, each playing a distinct role in Indian cuisine and consumption patterns (Hindustan Times; April 2024).
India's top imported pulses were lentils (HS code 071340) with values of US$1.3 billion (40.6% market share), followed by pigeon peas (HS code 071360) with values of US$833.4 million (27.0% market share) and beans (HS code 071331) with values of US$603.6 million (19.6% market share).
Lentils experienced the greatest performance increasing 69.0% annually, while pigeon peas increased 33.1% annually from 2018 to 2023. Beans (HS code 071339) and broad beans (HS code 071350) also performed well, increasing 34.6% and 34.2% respectively, in the historic period while red 'adzuki' beans increased 442.3% from US$1,859 in 2021 to US$54,678 in 2023. Peas (HS code 071310) in contrast, declined 52.9 % annually from US$233.7 million in 2018 to US$5.4 million in 2023.
HS Code | Description | 2018 | 2019 | 2020 | 2021 | 2022 | 2023 | CAGR* % 2018-2023 | Market share % in 2023 |
|---|---|---|---|---|---|---|---|---|---|
Pulse Total (HS code 0713) | 1,063.1 | 1,548.8 | 1,563.6 | 2,094.8 | 1,948.7 | 3,082.5 | 23.7 | 100.0 | |
071340 | Dried, shelled lentils | 90.7 | 345.5 | 577.0 | 524.5 | 537.7 | 1,251.5 | 69.0 | 40.6 |
071360 | Dried, shelled pigeon peas | 199.4 | 308.2 | 305.0 | 510.7 | 627.9 | 833.4 | 33.1 | 27.0 |
071331 | Dried, shelled beans, skinned or split, vigna species | 264.4 | 249.9 | 320.3 | 673.8 | 548.1 | 603.6 | 18.0 | 19.6 |
071320 | Dried, shelled chickpeas, skinned or split | 129.2 | 203.3 | 162.9 | 164.3 | 49.7 | 172.0 | 5.9 | 5.6 |
071333 | Dried, shelled kidney beans, skinned or split | 101.1 | 104.5 | 103.2 | 144.0 | 124.1 | 141.8 | 7.0 | 4.6 |
071339 | Dried, shelled beans, skinned or split | 8.6 | 21.6 | 13.6 | 4.9 | 20.8 | 37.9 | 34.6 | 1.2 |
071335 | Dried, shelled cow peas, skinned or split | 31.4 | 43.6 | 34.4 | 56.7 | 29.3 | 26.1 | −3.6 | 0.8 |
071350 | Dried, shelled broad beans, skinned or split | 1.7 | 1.2 | 6.8 | 8.8 | 1.7 | 7.4 | 34.2 | 0.2 |
071310 | Dried, shelled peas, skinned or split | 233.7 | 264.6 | 28.4 | 0.0 | 0.5 | 5.4 | −52.9 | 0.2 |
071390 | Dried, shelled leguminous vegetables, skinned or split | 2.9 | 6.3 | 11.9 | 7.2 | 8.7 | 3.1 | 1.6 | 0.1 |
071334 | Dried, shelled bambara beans, skinned or split | 0.2 | 0.1 | −65.2 (2022-2023) | 0.0 | ||||
071332 | Dried, shelled small red "adzuki" beans ", skinned or split | 0.0 | 0.1 | 442.3 (2021-2023) | 0.0 | ||||
*CAGR: Compound Annual Growth Rate | |||||||||
India imported US$3.1 billion, 3.6 billion kilograms in pulses in 2023, supplied primarily by Myanmar, Canada and Australia. Of the country's pulse imports, lentils (HS code: 071340) were the largest with values of US$1.3 billion (40.6% market share), 1.7 billion kilograms, supplied mainly by Canada and Australia, followed by pigeon peas (HS code: 071360) with values of US$833.4 million (27.0% market share), 887.3 million kilograms provided mainly by Mozambique and Myanmar, and beans (HS code: 071331) with values of US$603.6 million (19.6% market share), 610.4 million kilograms, supplied primarily by Myanmar, in 2023.
HS Code | Description | Import value (US$M) | Import volume (million kilograms) | Top suppliers and market value share | Canada's value share | ||
|---|---|---|---|---|---|---|---|
1 | 2 | 3 | |||||
Pulse Total (HS code 0713) | 3,082.5 | 3,633.3 | Myanmar: 28.0 | Canada: 21.8 | Australia: 17.5 | 21.8 | |
071340 | Dried, shelled lentils | 1,251.5 | 1,681.2 | Canada: 53.0 | Australia: 42.4 | Russia: 2.7 | 53.0 |
071360 | Dried, shelled pigeon peas | 833.4 | 887.3 | Mozambique: 31.9 | Myanmar: 30.6 | Tanzania: 21.6 | |
071331 | Dried, shelled beans, skinned or split, vigna species | 603.6 | 610.4 | Myanmar: 96.3 | Singapore: 2.0 | Brazil: 1.0 | |
071320 | Dried, shelled chickpeas, skinned or split | 172.0 | 223.8 | Tanzania: 51.4 | Sudan: 35.0 | Canada: 3.9 | 3.9 |
071333 | Dried, shelled kidney beans, skinned or split | 141.8 | 116.0 | Brazil: 25.5 | China: 18.1 | Ethiopa: 17.4 | 0.0 |
071339 | Dried, shelled beans, skinned or split | 37.9 | 46.3 | Brazil: 49.7 | Afghanistan: 27.6 | Madagascar: 8.8 | |
071335 | Dried, shelled cow peas, skinned or split | 26.1 | 35.3 | Brazil: 32.5 | Madagascar: 25.9 | Myanmar: 24.7 | |
071350 | Dried, shelled broad beans, skinned or split | 7.4 | 17.8 | Australia: 97.8 | United Arab Emirates: 1.4 | Singapore: 0.8 | |
071310 | Dried, shelled peas, skinned or split | 5.4 | 11.0 | Lithuania: 83.1 | United Arab Emirates: 16.9 | Canada: 0.0 | 0.0 |
071390 | Dried, shelled leguminous vegetables, skinned or split | 3.1 | 4.0 | Malawi: 36.6 | Brazil: 24.1 | United Arab Emirates: 11.6 | 0.7 |
071334 | Dried, shelled bambara beans, skinned or split | 0.1 | 0.1 | Ghana: 99.97 | Burkina Faso: 0.03 | ||
071332 | Dried, shelled small red "adzuki" beans ", skinned or split | 0.1 | 0.0 | Kyrgyzstan: 100.0 | |||
Source: Global Trade Tracker, 2024 | |||||||
Canada's performance
Canada's export market
Canada, unlike India, is a net exporter of pulses. In 2023, Canada enjoyed a pulse trade surplus of US$3.1 billion with imports of US$292.1 million, and exports valued at US$3.1 billion (+10.6% from exports of US$2.1 billion in 2018). Of interest, Canada was the largest global exporter of pulses, followed by Australia and Myanmar, in 2023.
Top export markets for Canadian pulses in 2023 were China (18.0% market share), India (17.4% market share) and Türkiye (11.3% market share). India, as the second largest export market for Canadian pulses, attained values of US$593.5 million in 2023, representing an increase in annual growth of 37.3% from US$121.5 million in 2018.
Canada's top pulses exported to India were lentils (HS code: 071340) with values of US$543.9 million (91.6% market share), representing a significant increase in growth of 53.9% from US$63.1 million in 2018, followed by peas (HS code: 071310) with values of US$41.9 million (7.1% market share), (and recently increasing to US$275.8 million from January -April 2024), and chickpeas (HS code: 071320) with values of US$7.6 million in 2023 (+49.6% from US$1.0 million in 2018). Kidney beans (HS code 071333) in contrast, contracted by 69.5% as Canadian exports decreased from US$513,989 in 2018 to US$1,352 in 2023.
HS Code | Description | 2018 | 2019 | 2020 | 2021 | 2022 | 2023 | CAGR* % 2018-2023 | Market share % in 2023 |
|---|---|---|---|---|---|---|---|---|---|
Pulse Total (HS code 0713) | 121.5 | 317.6 | 528.2 | 325.4 | 297.7 | 593.5 | 37.3 | 100.0 | |
071340 | Dried, shelled lentils | 63.1 | 243.6 | 508.4 | 315.2 | 297.1 | 543.9 | 53.9 | 91.6 |
071310 | Dried, shelled peas, skinned or split | 56.8 | 65.8 | 15.8 | 7.8 | 0.5 | 41.9 | −5.9 | 7.1 |
071320 | Dried, shelled chickpeas, skinned or split | 1.0 | 6.9 | 2.3 | 1.8 | 0.2 | 7.6 | 49.6 | 1.3 |
071332 | Dried, shelled small red "adzuki" beans ", skinned or split | 0.4 | 0.3 | 0.2 | −19.3 (2019-2023) | 0.0 | |||
071339 | Dried, shelled beans, skinned or split | 0.1 | 0.2 | 0.6 | 0.0 | 0.0 | −10.9 | 0.0 | |
071333 | Dried, shelled kidney beans, skinned or split | 0.5 | 0.6 | 0.5 | 0.0 | −69.5 | 0.0 | ||
071390 | Dried, shelled leguminous vegetables, skinned or split | 0.1 | N/C | 0.0 | |||||
071350 | Dried, shelled broad beans, skinned or split | 0.6 | 0.3 | −55.9 (2019-2020) | 0.0 | ||||
Source: Global trade tracker, 2024 *CAGR: Compound Annual Growth Rate N/C: not calculable | |||||||||
Saskatchewan was predominant in supplying pulses to India, occupying an 87.1% market share, followed by Alberta with a 12.9% market share and Ontario, representing an 0.04% market share in 2023.
Canada's largest pulse export to India was lentils (HS code 071340), supplied mainly by Saskatchewan with 91.2%, while peas, as the second largest pulse export segment, was provided by Alberta and Saskatchewan, supplying 66.5% and 33.5% respectively, in 2023.
HS Code | Description | Export value (US$) | Export volume (kilograms) | Top provincial suppliers and market value share | ||
|---|---|---|---|---|---|---|
Pulse Total (HS code 0713) | 593.5 | 828.5 | Saskatchewan: 87.1 | Alberta: 12.9 | Ontario: 0.04 | |
071340 | Dried, shelled lentils | 543.9 | 715.9 | Saskatchewan: 91.2 | Alberta: 8.9 | |
071310 | Dried, shelled peas, skinned or split | 41.9 | 105.2 | Alberta: 66.5 | Saskatchewan: 33.5 | |
071320 | Dried, shelled chickpeas, skinned or split | 7.6 | 7.1 | Saskatchewan: 100.0 | ||
071332 | Dried, shelled small red "adzuki" beans", skinned or split | 0.2 | 0.3 | Ontario: 100.0 | ||
071339 | Dried, shelled beans, skinned or split | 0.0 | 0.0 | Ontario: 100.0 | ||
071333 | Dried, shelled kidney beans, skinned or split | 0.0 | 0.0 | Ontario: 100.0 | ||
Source: Global trade tracker, 2024 | ||||||
Market size
India's per capita pulse retail sales were equivalent to US$54.5 in 2023 (+0.3% from US53.7 in 2018), with other pulses attaining the majority of retail sales (US$41.2) or an 75.6% market share. Peas were the second largest pulse segment with per capita retail sales of US$9.0 (16.5% market share) in 2023, representing an annual increase of 4.9% from US$7.1 in 2018.
In the forecast period, India's per capita pulse retail sales will remain positive, strengthening 3.1% annually, with beans expecting the greatest growth (7.2%) as per capita retail sales increase from US$4.3 in 2023 to US$6.1 by 2028.
Category | 2018 | 2023 | CAGR* % 2018-2023 | 2024 | 2028 | CAGR* % 2023-2028 | Market share % in 2023 |
|---|---|---|---|---|---|---|---|
Pulses[1] (total) | 53.7 | 54.5 | 0.3 | 56.6 | 63.6 | 3.1 | 100.0 |
Beans | 3.3 | 4.3 | 5.4 | 4.6 | 6.1 | 7.2 | 7.9 |
Peas | 7.1 | 9.0 | 4.9 | 9.7 | 12.4 | 6.6 | 16.5 |
Other Pulses | 43.3 | 41.2 | −1.0 | 42.3 | 45.1 | 1.8 | 75.6 |
Source: Euromonitor International, 2024 *CAGR: Compound Annual Growth Rate 1: the aggregation of dry beans (mung beans, red beans, broad beans, and horse beans), peas (dry peas, whole or split, packaged or unpackaged) and other pulses (all other unprocessed pulses whether packaged or unpackaged such as chickpeas, cow peas, pigeon peas, lentils, bambara beans, lupins etc.) as defined by Euromonitor International. | |||||||
India's per capita pulse volume sales were equivalent to 22.3 kilograms in 2023, declining slightly from 22.5 kilograms in 2018. The country's per capita pulse volumes sales were highest in the retail channel with 17.8 kilograms (79.8% market share), while per capita pulse volume sales in the foodservice channel were equivalent to 4.4 kilograms (19.7% market share) in 2023 (−2.9% from 5.1 kilograms in 2018).
In the forecast period, India's per capita pulse volume sales will improve, increasing 2.1% in annual growth to attain 24.7 kilograms by 2028. Per capita pulse volume sales in the retail channel will remain the largest (18.8 kilograms), while per capita pulse volume sales in the foodservice channel will experience the greatest performance, increasing 5.7% annually to 5.8 kilograms by 2028.
Channel | 2018 | 2023 | CAGR* % 2018-2023 | 2024 | 2028 | CAGR* % 2023-2028 | Market share % in 2023 |
|---|---|---|---|---|---|---|---|
Pulses (Total Volume) | 22.5 | 22.3 | −0.2 | 22.9 | 24.7 | 2.1 | 100.0 |
Retail | 17.4 | 17.8 | 0.5 | 18.1 | 18.8 | 1.1 | 79.8 |
Foodservice[1] | 5.1 | 4.4 | −2.9 | 4.7 | 5.8 | 5.7 | 19.7 |
Institutional[2] | 0.1 | 0.1 | 0.0 | 0.1 | 0.1 | 0.0 | 0.4 |
Source: Euromonitor International, 2024 *CAGR: Compound Annual Growth Rate 1: hotels, restaurant, cafés, bars, etc. 2: school/office, canteens, prisons/jails, hospitals, military, etc. | |||||||
Retail sales of pulses
Global retail sales of pulses
Global retail sales of pulses have increased 2.9% yearly from US$87.1 billion in 2018 to US$100.8 billion in 2023 and are expected to increase by an additional 7.0% as retail sales attain US$141.3 billion by 2028.
India was the largest global pulse market with retail sales of US$77.8 billion (77.2% market share), followed by Türkiye with retail sales of US$3.9 billion (4.0% market share) and Brazil with retail sales of US$3.3 billion (3.3% market share) in 2023. Of interest, Argentina experienced the largest increase in CAGR, as the country's retail sales of pulses grew 83.4% from US$41.2 billion in 2018 to US$854.3 billion in 2023 and is forecast to increase by 64.0% annually, to reach US$10.1 billion by 2028.
India, as the largest retail sales market for pulses, experienced a measured increase in CAGR of 1.2% from retail sales of US$73.5 billion in 2018, and is expected to grow an additional 4.0% in the forecast period to attain US$94.8 billion by 2028. Canada in comparison, was the twenty-fifth largest retail sales market for pulses, accounting for a 0.1% retail sale market share with values of US$142.9 million in 2023. Canada is also expected to achieve positive growth with an increase in CAGR of 3.4% as retail sales are anticipated to reach US$169.2 million by 2028.
Geography | 2018 | 2023 | CAGR* % 2018-2023 | 2024 | 2028 | CAGR* % 2023-2028 |
|---|---|---|---|---|---|---|
Global retail sales of pulses (total) | 87,143.9 | 100,768.6 | 2.9 | 108,010.8 | 141,309.1 | 7.0 |
India | 73,469.8 | 77,808.3 | 1.2 | 81,626.6 | 94,806.2 | 4.0 |
Türkiye | 929.4 | 3,995.0 | 33.9 | 5,318.0 | 11,334.8 | 23.2 |
Brazil | 1,491.5 | 3,308.3 | 17.3 | 3,771.4 | 5,709.5 | 11.5 |
Egypt | 2,266.6 | 2,759.7 | 4.0 | 2,997.6 | 3,704.0 | 6.1 |
United States | 1,163.6 | 1,597.4 | 6.5 | 1,697.7 | 1,975.9 | 4.3 |
Mexico | 1,101.6 | 1,559.2 | 7.2 | 1,664.8 | 2,050.3 | 5.6 |
Italy | 1,013.1 | 1,261.2 | 4.5 | 1,317.0 | 1,519.7 | 3.8 |
Argentina | 41.2 | 854.3 | 83.4 | 1,540.2 | 10,128.0 | 64.0 |
United Arab Emirates | 557.9 | 785.4 | 7.1 | 846.7 | 1,087.8 | 6.7 |
China | 583.6 | 721.6 | 4.3 | 772.8 | 983.5 | 6.4 |
Canada (25) | 119.3 | 142.9 | 3.7 | 145.7 | 169.2 | 3.4 |
Source: Euromonitor International, 2024 *CAGR: Compound Annual Growth Rate | ||||||
Retail sales of pulses in India
According to Euromonitor International, pulses are utilized in a wide variety of traditional dishes ranging from dals (lentil soups) to curries and are an economical and nutrient rich element in daily meals. Relatedly, as a significant portion of the population is vegetarian, and increasingly vegan, pulses remain an important source of plant-based protein for sustainable dietary choices and healthier lifestyles (Euromonitor International; April 2024).
Recently, inflation has prompted low-to middle-income consumers to look for more economical pulse options and price points. Euromonitor International reports that unpackaged products have been in high demand, given their lower price point while in urban areas, private label lines from leading online and offline retailers have also become increasingly popular as they are cheaper, and as nutritional in value (Euromonitor International; April 2024). Relatedly, continued implementation of government incentives such as the National Food Security Mission Pulses Program, is anticipated to incentivize farmers to increase pulse production and supply of high yielding varieties to meet demand and help balance price offerings (Euromonitor International; April 2024).
In terms of pulse retail sales, other pulses were India's largest segment with retail sales of US$58.8 billion (75.6% market share), followed by peas with retail sales of US$12.9 billion (16.5% market share), and beans with US$6.1 billion (7.8% market share) in 2023. Of interest, beans experienced the greatest performance, increasing 6.3% in annual growth from retail sales of US$4.5 billion in 2018 to US$6.1 billion in 2023, (or 35.7%in total). Peas also experienced a large increase in annual growth (5.9%), as retail sales grew from US$9.7 billion in 2018 to US$11.7 billion in 2023 (or 32.9% in total).
Category | 2018 | 2019 | 2020 | 2021 | 2022 | 2023 |
|---|---|---|---|---|---|---|
Pulses | 73,469.8 | 70,486.5 | 69,437.7 | 69,608.6 | 73,370.8 | 77,808.3 |
Beans | 4,491.1 | 4,127.5 | 4,587.8 | 4,930.5 | 5,518.2 | 6,094.9 |
Peas | 9,683.1 | 8,427.3 | 10,567.9 | 10,776.0 | 11,724.3 | 12,868.6 |
Other Pulses | 59,295.5 | 57,931.7 | 54,282.0 | 53,902.1 | 56,128.2 | 58,844.8 |
Source: Euromonitor International, 2024 | ||||||
Category | Annual growth % 2022-2023 | CAGR* % 2018-2023 | Total growth % 2018-2023 |
|---|---|---|---|
Pulses | 6.0 | 1.2 | 5.9 |
Beans | 10.5 | 6.3 | 35.7 |
Peas | 9.8 | 5.9 | 32.9 |
Other Pulses | 4.8 | −0.2 | −0.8 |
Source: Euromonitor International, 2024 *CAGR: Compound Annual Growth Rate | |||
In the forecast period, the Indian pulse market is expected to remain positive with a higher growth rate of 4.0% between 2023 to 2028. The bean and pea segments, similar to the historic period, are anticipated to experience the greatest performance, increasing 8.2% and 7.5% respectively, from 2023 to 2028. Further, the growing prominence of healthier lifestyles and diet are expected to generate increased demand for pulses as a sustainable option for plant-based proteins (Euromonitor International; April 2024).
Category | 2024 | 2025 | 2026 | 2027 | 2028 |
|---|---|---|---|---|---|
Pulses | 81,626.6 | 85,316.6 | 88,625.1 | 91,715.1 | 94,806.2 |
Beans | 6,659.0 | 7,242.2 | 7,824.0 | 8,415.9 | 9,034.0 |
Peas | 13,971.2 | 15,100.9 | 16,206.9 | 17,303.3 | 18,442.9 |
Other Pulses | 60,996.4 | 62,973.5 | 64,594.2 | 65,995.9 | 67,329.3 |
Source: Euromonitor International, 2024 | |||||
Category | Annual growth % 2023-2024 | CAGR* % 2023-2028 | Total growth % 2023-2028 |
|---|---|---|---|
Pulses | 4.9 | 4.0 | 21.8 |
Beans | 9.3 | 8.2 | 48.2 |
Peas | 8.6 | 7.5 | 43.3 |
Other Pulses | 3.7 | 2.7 | 14.4 |
Source: Euromonitor International, 2024 *CAGR: Compound Annual Growth Rate | |||
Volume sales of pulses in India
Total volume sales (retail, foodservice and institutional) of pulses in India was equivalent to 31.9 million tonnes in 2023 (+0.7% from 30.8 million tonnes in 2018). Pulse volume sales were the largest through the retail channel, equivalent to 25.4 million tonnes (79.7% market share), followed by volume sales to the foodservice channel equal to 6.3 million tonnes (19.8% market share) and volume sales to institutional channels worth 139.9 thousand tonnes (0.4% market share) in 2023. Of note, pulse volume sales to foodservice and institutional channels declined by 28.2% and 30.9% respectively from 2019 to 2020 with the onset of the pandemic, and have both since recovered, attaining recent annual volume sales of 8.1% and 10.5% respectively, from 2022 to 2023.
Category | 2018 | 2019 | 2020 | 2021 | 2022 | 2023 |
|---|---|---|---|---|---|---|
Pulses (Total Volume) | 30,846.0 | 28,880.4 | 28,828.1 | 29,534.7 | 30,565.9 | 31,873.9 |
Retail | 23,775.5 | 22,029.4 | 23,913.9 | 24,061.7 | 24,586.0 | 25,407.5 |
Foodservice | 6,916.5 | 6,713.1 | 4,818.8 | 5,373.6 | 5,853.3 | 6,326.5 |
Institutional | 154.0 | 138.0 | 95.4 | 99.4 | 126.6 | 139.9 |
Source: Euromonitor International, 2024 | ||||||
Category | Annual growth % 2022-2023 | CAGR* % 2018-2023 | Total growth % 2018-2023 |
|---|---|---|---|
Pulses (Total Volume) | 4.3 | 0.7 | 3.3 |
Retail | 3.3 | 1.3 | 6.9 |
Foodservice | 8.1 | −1.8 | −8.5 |
Institutional | 10.5 | −1.9 | −9.2 |
Source: Euromonitor International, 2024 *CAGR: Compound Annual Growth Rate | |||
In the forecast period, total volume sales of pulses are anticipated to increase in CAGR by 2.9% to attain 36.8 million tonnes by 2028. All pulse volume sale distribution channels will experience increased positive growth as volume sales to foodservice and institutional channels in particular, experience the greatest performance, increasing 6.3% and 7.7% respectively between 2023 and 2028 (+7.1% and +9.1% respectively from 2023 to 2024)
Category | 2024 | 2025 | 2026 | 2027 | 2028 |
|---|---|---|---|---|---|
Pulses (Total Volume) | 32,993.7 | 34,027.8 | 34,973.0 | 35,883.8 | 36,800.6 |
Retail | 26,065.2 | 26,641.8 | 27,129.9 | 27,575.6 | 28,010.5 |
Foodservice | 6,775.8 | 7,220.8 | 7,665.5 | 8,118.1 | 8,587.2 |
Institutional | 152.7 | 165.2 | 177.6 | 190.1 | 202.9 |
Source: Euromonitor International, 2024 | |||||
Category | Annual growth % 2023-2024 | CAGR* % 2023-2028 | Total growth % 2023-2028 |
|---|---|---|---|
Pulses (Total Volume) | 3.5 | 2.9 | 15.5 |
Retail | 2.6 | 2.0 | 10.2 |
Foodservice | 7.1 | 6.3 | 35.7 |
Institutional | 9.1 | 7.7 | 45.0 |
Source: Euromonitor International, 2024 *CAGR: Compound Annual Growth Rate | |||
New product launch analysis
According to Mintel, pulses- a type of legume which yields a grain seed in a pod where the dried seed is harvested- and legumes- a plant whose fruit is enclosed in a pod, are increasingly sought by consumers and used by food producers for their taste, versatility, sustainability, and nutritional features. Pulses constitute a vital component of the Indian diet as nearly 43.0% are vegetarian, with 48.0% living in urban versus rural (41.0%) dwellings (Mintel; Ingredient Insight: Pulses and Legumes, February 2017).
According to Mintel's Global New Products Database (GNPD), there were 5,440 new pulse products (searched as an ingredient/and all children), launched in India from January 2018 to December 2023, (with 314 new pulse products launched between January and April 2024). Of these 5,440 new products, 5,134 were food products, 196 were drink products, while 110 were categorized as pet product launches. The number of yearly new product pulse launches has increased in growth by a CAGR of 3.2% from a launch of 924 products in 2018, to its most recent launch of 1.084 products in 2023 (+20.0% from 2021 to 2022).
The predominant categories of new pulse products released were snacks (2,168 products), bakery products (862 products), fruit and vegetables (586 products), sauces and seasonings (519 products) and meals and meal centers (254 products). Of interest, within bakery products, (pulse flours [chickpea flour, pea flour, lupine flour, and soybean flour]), can provide essential nutrients such as protein, fiber, iron, zinc, calcium, and folate, missing, or in low quantity, in gluten-free products. Further, substituting conventional refined grains used in a number of processed foods for pulses, and/or using pulses in combination with other grains, can enhance the nutritional profile of processed foods in a natural way (Mintel; Ingredient Insight: Pulses and Legumes, pg. 18, February 2017). Popular product claims were vegetarian (5,219 products), no additives/preservatives (1,909 products) and social media with (1,699 products).
The companies with the highest number of new product launches were ITC with (146 products), followed by Bikanervala Foods (79 products) and BigBasket - Supermarket Grocery Supplies (68 products). Under half (44.0%) of the new product launches were categorized as new product launches (2,396 products), whereas 26.6% were new variety/range extension products (1,446 products) and 23.0% were new packaging products (1,251 products).
Top packaging types included flexible packaging (2,648 products), flexible stand-up pouch (1,605 products), jar (284 products), flexible sachet (197products) and tray (186 products). Top flavours were unflavoured/plain (1,938 products), masala (242 products), spice/spicy (141 products), chocolate (94 products) and sambar (sambhar) with (88 products), while top ingredient new product launches included chickpea (1,937 products), chickpea flour (1,689 products), black gram (1,027 products), mung beans (660 products) and peas (585 products). Of note, chickpeas in particular, are nutrient-dense and contain unique properties such as protein, minerals, and dietary fiber that can function to develop not only the nutritional quality of conventional foods but also the texture, absorption, and gelling of food systems (Mintel; Ingredient Insight: Pulses and Legumes, pg. 20, February 2017).
Product attributes | Number of new products by year | Total | |||||
|---|---|---|---|---|---|---|---|
2018 | 2019 | 2020 | 2021 | 2022 | 2023 | ||
Yearly product launches | 924 | 903 | 804 | 784 | 941 | 1,084 | 5,440 |
Top categories | |||||||
Snacks | 430 | 401 | 330 | 251 | 333 | 423 | 2,168 |
Bakery | 136 | 132 | 133 | 122 | 148 | 191 | 862 |
Fruit and vegetables | 63 | 71 | 104 | 114 | 148 | 86 | 586 |
Sauces and seasonings | 78 | 99 | 87 | 91 | 78 | 86 | 519 |
Meals and meal centers | 56 | 56 | 23 | 39 | 45 | 35 | 254 |
Breakfast cereals | 35 | 40 | 30 | 24 | 24 | 50 | 203 |
Nutritional drinks & other beverages | 20 | 11 | 20 | 49 | 38 | 38 | 176 |
Desserts and ice cream | 18 | 16 | 16 | 22 | 24 | 38 | 134 |
Sugar and gum confectionery | 29 | 22 | 13 | 14 | 22 | 23 | 123 |
Pet food | 8 | 19 | 13 | 9 | 22 | 39 | 110 |
Top claims | |||||||
Vegetarian | 888 | 878 | 781 | 751 | 887 | 1,034 | 5,219 |
No additives/preservatives | 257 | 295 | 280 | 278 | 342 | 457 | 1,909 |
Social media | 220 | 238 | 201 | 272 | 326 | 442 | 1,699 |
Free from added/artificial preservatives | 223 | 254 | 237 | 239 | 283 | 397 | 1,633 |
Ease of use | 227 | 204 | 156 | 171 | 196 | 261 | 1,215 |
Top companies | |||||||
ITC | 38 | 16 | 25 | 23 | 11 | 33 | 146 |
Bikanervala Foods | 16 | 16 | 6 | 7 | 18 | 16 | 79 |
BigBasket - Supermarket Grocery Supplies | 24 | 7 | 18 | 13 | 6 | 0 | 68 |
Haldiram Bhujiawala | 21 | 21 | 6 | 4 | 4 | 7 | 63 |
Haldiram Foods International | 9 | 7 | 10 | 5 | 7 | 10 | 48 |
Top store types | |||||||
Supermarket | 325 | 299 | 249 | 232 | 286 | 340 | 1,731 |
Internet/mail order | 108 | 192 | 287 | 340 | 320 | 348 | 1,595 |
Mass merchandise/hypermarket | 244 | 191 | 94 | 121 | 140 | 197 | 987 |
Traditional retail outlet | 76 | 32 | 53 | 29 | 51 | 29 | 270 |
Specialist retailer | 44 | 106 | 26 | 21 | 28 | 31 | 256 |
Top product launches | |||||||
New product | 342 | 339 | 437 | 385 | 450 | 443 | 2,396 |
New variety/range extension | 247 | 245 | 183 | 188 | 257 | 326 | 1,446 |
New packaging | 252 | 240 | 155 | 165 | 190 | 249 | 1,251 |
Relaunch | 82 | 78 | 28 | 43 | 43 | 63 | 337 |
New formulation | 1 | 1 | 1 | 3 | 1 | 3 | 10 |
Top flavours (including blend) | |||||||
Unflavoured/plain | 307 | 310 | 323 | 310 | 342 | 346 | 1,938 |
Masala | 52 | 52 | 29 | 27 | 38 | 44 | 242 |
Spice/spicy | 23 | 21 | 24 | 12 | 26 | 35 | 141 |
Chocolate | 8 | 11 | 4 | 21 | 19 | 31 | 94 |
Sambar (Sambhar) | 8 | 20 | 12 | 18 | 12 | 18 | 88 |
Vegetable | 14 | 8 | 5 | 11 | 13 | 16 | 67 |
Roasted/toasted | 10 | 12 | 14 | 7 | 10 | 11 | 64 |
Salt/salted | 11 | 11 | 4 | 6 | 7 | 16 | 55 |
Chickpea | 6 | 5 | 13 | 9 | 11 | 8 | 52 |
Mung bean/Green gram | 9 | 9 | 8 | 5 | 6 | 9 | 46 |
Top ingredients | |||||||
Chickpea | 320 | 315 | 305 | 274 | 339 | 384 | 1,937 |
Chickpea flour | 312 | 301 | 253 | 214 | 261 | 348 | 1,689 |
Black gram | 166 | 190 | 154 | 151 | 166 | 200 | 1,027 |
Mung beans | 111 | 140 | 102 | 84 | 96 | 127 | 660 |
Peas | 111 | 114 | 83 | 67 | 101 | 109 | 585 |
Pulses | 62 | 76 | 57 | 55 | 50 | 60 | 360 |
Pigeon pea | 37 | 39 | 25 | 31 | 23 | 34 | 189 |
Red lentil | 37 | 25 | 27 | 15 | 35 | 27 | 166 |
Pea protein | 15 | 11 | 10 | 26 | 26 | 48 | 136 |
Yellow pigeon peas | 15 | 19 | 23 | 18 | 14 | 19 | 108 |
Top package types | |||||||
Flexible | 503 | 429 | 395 | 384 | 444 | 493 | 2,648 |
Flexible stand-up pouch | 239 | 272 | 228 | 233 | 293 | 340 | 1,605 |
Jar | 19 | 44 | 50 | 62 | 51 | 58 | 284 |
Flexible sachet | 49 | 37 | 22 | 28 | 28 | 33 | 197 |
Tray | 31 | 24 | 34 | 25 | 40 | 32 | 186 |
Unit pack size | |||||||
200.00 grams | 166 | 144 | 137 | 131 | 154 | 181 | 913 |
500.00 grams | 99 | 105 | 120 | 102 | 118 | 118 | 662 |
1000.00 grams | 78 | 79 | 87 | 101 | 132 | 109 | 586 |
100.00 grams | 80 | 93 | 74 | 56 | 62 | 66 | 431 |
250.00 grams | 48 | 75 | 55 | 45 | 59 | 70 | 352 |
Source: Mintel Global New Product Database (GNPD), 2024 | |||||||
Sub-category | Number of products | Average price per product (in US$) |
|---|---|---|
Snacks | 2168 | 1.32 |
Bakery | 862 | 1.68 |
Fruit and vegetables | 586 | 2.79 |
Sauces and seasonings | 519 | 1.37 |
Meals and meal centers | 254 | 1.35 |
Breakfast cereals | 203 | 1.81 |
Nutritional drinks and other beverages | 176 | 10.60 |
Desserts and ice cream | 134 | 2.61 |
Sugar and gum confectionery | 123 | 1.98 |
Pet food | 110 | 6.88 |
Other | 305 | 2.63 |
Total | 5,440 | 2.09 |
Source: Mintel Global New Product Database (GNPD), 2024 | ||
Examples of new products
Birthday Cake Soft Chew Protein Wafer Bar
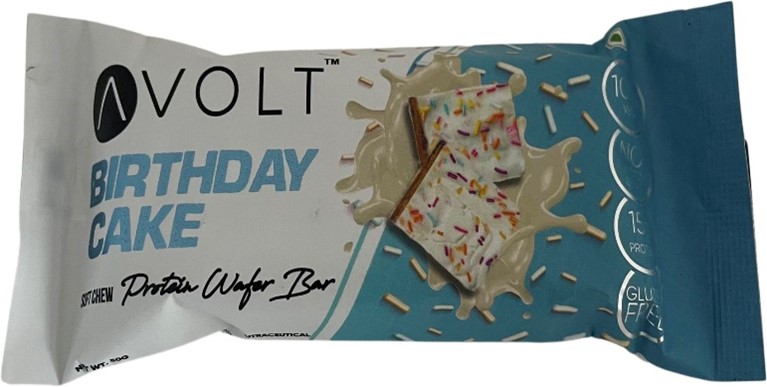
Source: Mintel Global New Product Database (GNPD), 2024
Company | Avoss Healthtech |
|---|---|
Brand | Avolt |
Category | Snacks |
Sub-category | Snack / cereal / energy bars |
Market | India |
Store type | Supermarket |
Date published | December 2023 |
Launch type | New product |
Price in US dollars | 1.98 |
Avolt Birthday Cake Soft Chew Protein Wafer Bar is now available, and retails in a 50 gram pack. - 100% veg - No added sugar - 15 gram protein - Gluten free - Whey protein - Non-GMO - Nutraceutical - Benzoate - and paraben free - Gluten free- Logos and certifications: Vegetarian green dot, FSSAI, GMP, ISO 22000, HACCP
Whole Wheat Digestive Cookies

Source: Mintel Global New Product Database (GNPD), 2024
Company | Ruchi Soya Industries |
|---|---|
Brand | Patanjali |
Category | Bakery |
Sub-category | Sweet biscuits / cookies |
Market | India |
Location of manufacture | India |
Import status | Not imported |
Store type | Specialist retailer |
Date published | August 2022 |
Launch type | New packaging |
Price in US dollars | 0.63 |
Patanjali Whole Wheat Digestive Cookies have been repacked. The product is made with 100% wheat flour, enriched with barley, oat, water caltrop, amaranth, corn, gram. It is free from trans fat, is high in dietary fibres to aid digestion and weight loss and is said to prolong activity. This easy to digest product is suitable for vegetarians and retails in a 250 gram pack.
Organic Split Chickpeas
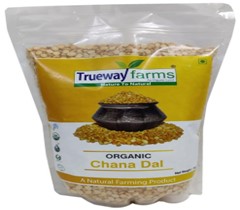
Source: Mintel Global New Product Database (GNPD), 2024
Company | Trueway Organic |
|---|---|
Brand | Trueway Farms |
Category | Fruit and vegetables |
Sub-category | Vegetables |
Market | India |
Store type | Internet / mail order |
Date published | July 2021 |
Launch type | New product |
Price in US dollars | 3.34 |
Trueway Farms Organic Chana Dal (Organic Split Chickpeas) are a great source of vitamins B1, B2, B3 and B9, proteins, minerals such as calcium, potassium, zinc, magnesium and phosphorus, as well as fibres. It contains folic acid which is said to reduce the risk of blood clots and hardening of arteries. The product is said to build immunity power, is described as a great antioxidant, and is claimed to increase metabolism, hormone production, to treat night blindness, strengthen bones, maintain pH level and folic acid. It is also said to increase the formation of red blood cells, maintain the body weight due to being free from fat and cholesterol. The product is free from all kinds of chemical fertilisers and artificial additives. It is 100% certified natural and organic, is suitable for vegetarians and is retailed in a 1 kilogram pack, bearing India Organic, USDA Organic, RSOCA Rajasthan State Seed and Organic Certification Agency, Jaivik Bharat, Facebook and Instagram logos and the ISO 9001 certification.
Lentil Spice Mix Powder with Garlic
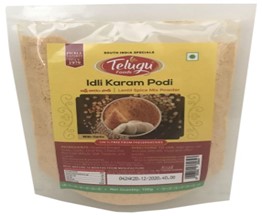
Source: Mintel Global New Product Database (GNPD), 2024
Company | Tejas Food Industries |
|---|---|
Brand | Telugu Foods |
Category | Sauces and seasonings |
Sub-category | Seasonings |
Market | India |
Store type | Internet / mail order |
Date published | December 2020 |
Launch type | New variety / range extension |
Price in US dollars | 0.54 |
Telugu Foods Idli Karam Podi (Lentil Spice Mix Powder with Garlic) is now available. The vegetarian product is free from preservatives, and retails in a 100 gram pack featuring an ISO 22000 certification.
Heat 'n' Eat Punjabi Choley
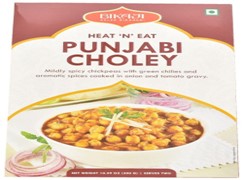
Source: Mintel Global New Product Database (GNPD), 2024
Company | Bikaji Foods International |
|---|---|
Brand | Bikaji |
Category | Meals and meal centers |
Sub-category | Prepared meals |
Market | India |
Store type | Supermarket |
Date published | December 2019 |
Launch type | New product |
Price in US dollars | 1.98 |
Bikaji Heat 'n' Eat Punjabi Choley is described as mildly spicy chickpeas with green chillies and aromatic spices cooked in an onion and tomato gravy. It is ISO 9001 and ISO 22000 certified, is suitable for vegetarians, and retails in a 300 gram partially recyclable pack sufficient for two servings and bearing the Facebook and Twitter logos and cooking instructions.
Opportunities for Canada
The pulse market in India is a measurable and expansive sector, driven by increasing population and income growth. India remains the largest producer and consumer of pulses in the world; however, increasingly growing consumption has exceeded domestic production, requiring support supplementation from imports.
In 2023, India was the largest global market for pulses with imports valued at US$3.1 billion, representing a 21.5% market share, with Myanmar, Canada and Australia, as key suppliers. Canadian pulse exports to India have grown by 37.3% annually from US$121.5 million in 2018 to US$593.5 million in 2023, demonstrating increasing reliability in Canada's production and supply capacity. Relatedly, the Indian government's recent decision to extend duty-free imports of yellow peas to October 2024, represents additional and limited opportunity for Canadian exporters to address increasing consumer demand within India's growing pulse market.
Pulses are utilized in a wide variety of traditional dishes ranging from dals (lentil soups) to curries and are an economical and nutrient rich element in daily meals. India was the largest global retail sales market for pulses, attaining US$77.8 billion in 2023, increasing 1.2% annually from US$73.5 billion in 2018. In terms of pulse retail sales, other pulses were India's largest segment with retail sales of US$58.8 billion (75.6% market share) in 2023. In the forecast period, the Indian pulse retail sale market is expected to remain positive with a higher growth rate of 4.0%, achieving US$94.8 billion by 2028.
Given the expected and continued growth in the Indian pulse market, Canadian producers have an opportunity to expand their presence and exports within the Indian pulse sector. That said, it is important for Canadian suppliers to work closely with their importing partners and Trade Commissioners to understand and ensure that India's import requirements and duties are met. It is also important to note and appreciate the value of commitment, and market development efforts needed to further access the Indian market in relation to competitors who may yield a price competitiveness and freight advantage due to their proximity to India.
For more information
The Canadian Trade Commissioner Service:
International Trade Commissioners can provide Canadian industry with on-the-ground expertise regarding market potential, current conditions and local business contacts, and are an excellent point of contact for export advice.
More agri-food market intelligence:
Agri-food market intelligence service
Canadian agri-food and seafood businesses can take advantage of a customized service of reports and analysis, and join our email subscription service to have the latest reports delivered directly to their inbox.
More on Canada's agriculture and agri-food sectors:
Canada's agriculture sectors
Information on the agriculture industry by sector. Data on international markets. Initiatives to support awareness of the industry in Canada. How the department engages with the industry.
Resources
- Agriculture in India; Role and importance of pulse crop in Indian agriculture
- Agriculture Times: Top ten types of kharif crops in India. January 27, 2023.
- Euromonitor International, 2024
- Country Report; Pulses in India, April 2024.
- FinancialExpress; FE Bureau. Govt removes import duty on chana, extends duty free imports of yellow pea, May 7, 2024.
- FinancialExpress Business; India to receive "above normal" monsoon this year, says IMD. April 15, 2024.
- Global Trade Tracker, 2024
- Hindustan Times; Prakash, Anjal. How India can achieve self-sufficiency in pulse production. April 21, 2024.
- Hindustan Times; Haq, Zia. India inks deal with Brazil, Argentina for pulse imports, April 15, 2024.
- Mintel Global New Products Database, 2024
- Mintel; Ingredient Insight: Pulses and Legumes, February 2017.
- ICAR-Indian Institute of Pulses Research; Dixit, Dr. G. P., Project Coordinator's Report 2021-22, page 3
- Reuters; Indian farmers reject support price contract offered by government. February 19, 2024.
- ScienceDirect; Venkidasamy, B., Selvaraj, D., Nile, A., Ramalingam, S., Kai, G. and Nile, S.H., Abstract from "Indian pulses: A review on nutritional, functional and biochemical properties with future perspectives". Trends in Food Science & Technology, volume 88, June 2019, pages 228 to 242.
- The Economic Times; India's kharif crop planting area rises; paddy leding year-on-year August 13, 2023.
- The Economic Times; Bhosale, J. Area under kharif pulses may go up ny 15.0% driven by higher prices. April 16, 2024.
- Vikaspedia; Pulses in India, January 12, 2021.
Sector Trend Analysis – Pulse trends in India
Global Analysis Report
Prepared by: Laurie Bernardi, International Market Research Analyst
© His Majesty the King in Right of Canada, represented by the Minister of Agriculture and Agri-Food (2024).
Photo credits
All photographs reproduced in this publication are used by permission of the rights holders.
All images, unless otherwise noted, are copyright His Majesty the King in Right of Canada.
To join our distribution list or to suggest additional report topics or markets, please contact:
Agriculture and Agri-Food Canada, Global Analysis
1341 Baseline Rd, Tower 5, 3rd floor
Ottawa ON K1A 0C5
Canada
Email: aafc.mas-sam.aac@agr.gc.ca
The Government of Canada has prepared this report based on primary and secondary sources of information. Although every effort has been made to ensure that the information is accurate, Agriculture and Agri-Food Canada (AAFC) assumes no liability for any actions taken based on the information contained herein.
Reproduction or redistribution of this document, in whole or in part, must include acknowledgement of agriculture and agri-food Canada as the owner of the copyright in the document, through a reference citing AAFC, the title of the document and the year. Where the reproduction or redistribution includes data from this document, it must also include an acknowledgement of the specific data source(s), as noted in this document.
Agriculture and Agri-Food Canada provides this document and other report services to agriculture and food industry clients free of charge.