For more information
Media Relations
Agriculture and Agri-Food Canada
1-866-345-7972
aafc.mediarelations-relationsmedias.aac@agr.gc.ca
Rapid and extreme changes in climate and land use have led to worsening floods and seemingly endless droughts across Canada. For farmers whose crops and livestock depend on water, not knowing how their water resources change from day-to-day or year-over-year can lead to immense consequences for Canada’s food systems.
To help farmers and other decision makers, researchers are building next generation water-modelling tools that will help predict floods, droughts and other climate-related water challenges before they happen. The tools will also provide the sector with options to use and manage groundwater and surface water resources more efficiently, helping them prepare for predicted climate change scenarios.
Known as Canada1Water (C1W), the project is Canada’s first 3D model describing the entire water (hydrological) cycle of Canada. It tracks every part; from evaporation and transpiration to precipitation and snowmelt runoff. It will show how water is stored and moved across Canada’s different landscapes, like the Rockies in the west and the Canadian Shield in central Canada. What’s more, the model will predict how the groundwater and surface water could be affected by current and future climate conditions, as well as shifts in land use.
The project is led by research scientists Dr. Hazen Russell with the Geological Survey of Canada at Natural Resources Canada (NRCan) and Dr. Steven Frey of Aquanty Inc. Core funding for the project comes from the Canadian Public Safety and Security Program co-managed by Defence Research Development Canada (DRDC), along with support from Agriculture and Agri-Food Canada (AAFC) through the Environmental Change One Health Observatory and the Geological Survey of Canada.
“A major shortcoming has been the ability to look at how water resources are changing with time. Canada1Water is modelling the complete water cycle of Canada to help decision makers when making adaptation choices to climate change.”
- Dr. Hazen Russell, Research Scientist, Geological Survey of Canada
Historically, the Earth’s climate has cycled between long droughts or wet periods that have a great impact on precipitation, melting glaciers, and the amount of water evaporating from plants and soil. “The real challenge is to understand and describe both groundwater and surface water behaviour, [not only] within current and historic time periods, but under forecasted climate change scenarios,” Dr. Russell says.
For Agriculture and Agri-Food Canada (AAFC) researcher and AAFC’s lead on the C1W project, Dr. David Lapen, “prediction is the cornerstone of mitigation and adaptation.” He would like to see the C1W model take in weather and climate forecasts, then give farmers and watershed stewards information they can use. The model would create virtual scenarios that include groundwater levels, flood and drought forecasts, field soil moisture, disease risks, and the fate of agricultural inputs. "If you can forecast soil moisture over short time periods, for example, you can deal with some important crop disease risks proactively," he says. By predicting the risk weeks before a problem happens, growers can be proactive, rather than reactive in protecting their crop.
“With C1W, you're not just forecasting rainfall or other weather conditions; you're forecasting the actual soil or landscape hydrological endpoints that matter to farmers."
- Dr. David Lapen, Research Scientist, Agriculture and Agri-Food Canada
“Canada1Water is currently an R&D project focused on mid- and late-century climate change scenarios and how this affects seasonal changes in the water cycle and the availability of water resources,” Dr. Russell says. “For example, will the spring snow melt occur earlier? Or will it be completely disrupted and segmented by multiple midwinter melt events?”
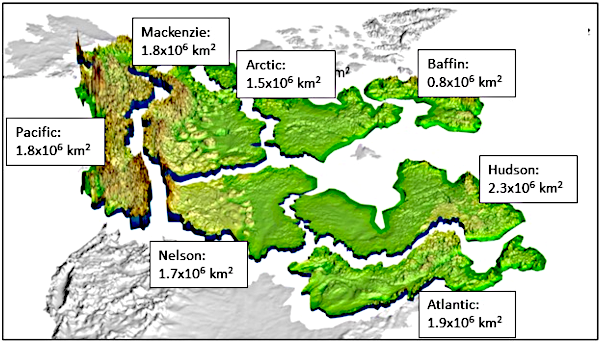
To make this massive water model more easily computable, the researchers divided Canada into seven large drainage basins. But what’s impressive is the potential for taking this coarse model and making finer-scale decisions for individual watersheds.
Map of Canada with drainage basins

Description of the above image
Canada was divided into 7 large drainage basins: Nelson River (1.7 x 10⁶ km2), Mackenzie River (1.8 x 10⁶ km2), Atlantic which includes the Great Lakes–St. Lawrence (1.9 x 10⁶ km2), Baffin Island (0.8 x 10⁶ km2), Hudson (2.3 x 10⁶ km2), the Arctic (1.5 x 10⁶ km2) and the Pacific (1.8 x 10⁶ km2).
“The great thing about C1W is that it brings together all of the data sets you need to build a fully integrated water model anywhere in Canada,” Dr. Frey explains. Known as “nested modelling,” the underlying data sets within the model can be selected by the user. This way, they can customize their own regional model to focus on a single watershed. This provides more accurate predictions tailored to their region’s geography and ultimately reduces the costs and time involved in building a model from scratch.
Producers could use it to decide which crops and land management practices are best suited for their watershed, knowing that it will be particularly dry or wet in 20 years. Or perhaps they might look to purchase new land knowing that their current farm may not be suitable for agriculture in 50 years due to constant droughts and low groundwater levels, says Dr. Lapen, who points to the long-lasting impacts of drought on crop production. C1W could also pinpoint new areas that have the potential to support agriculture in the future, due to shifting water resources in a changing climate. For instance, groundwater could sustain agriculture in regions where surface water is known to be seasonally scarce.
What’s next? The team is hard at work, creating a web-based portal that will present outputs from the model in an easily understandable and useable format. This way, users can more easily interpret this information and put it to use.
The team is also continuing to test and improve their model to increase the accuracy of their outputs. Currently in the R&D stages, the dream is for this first national model to evolve into sustained, long-term research on groundwater–surface water modelling and the ability to support agricultural users down to the scale of a single field. The finer the resolution, the greater the capacity for on-farm decision making, and ultimately providing the agricultural community with key insights they can use.
Quick facts
- Canada1Water is a nationwide, climate-driven 3D model that will predict the impacts of climate change and land use on Canada’s water resources.
- The data sets supporting the model will be open access, allowing others to customize their own models and include other activities to reflect their local environment and geography.
- For farmers, the model could provide useful information such as groundwater levels, soil moisture, nutrients and ecosystem services. It could also highlight areas that will become suitable or unsuitable for agriculture in the years to come.
- This first model is in the mid-to-late developmental stages. Once complete, Canada1Water will be open access and researchers hope to take the project to the next level with added support, further refining the model to increase capacity for on-farm decision-making at field-scale.
- Co-lead and partner, Aquanty, is a groundwater analytics and software company that will offer a low-cost decision-support tool to help interpret data from C1W geared towards non-technical users.
Sample projections
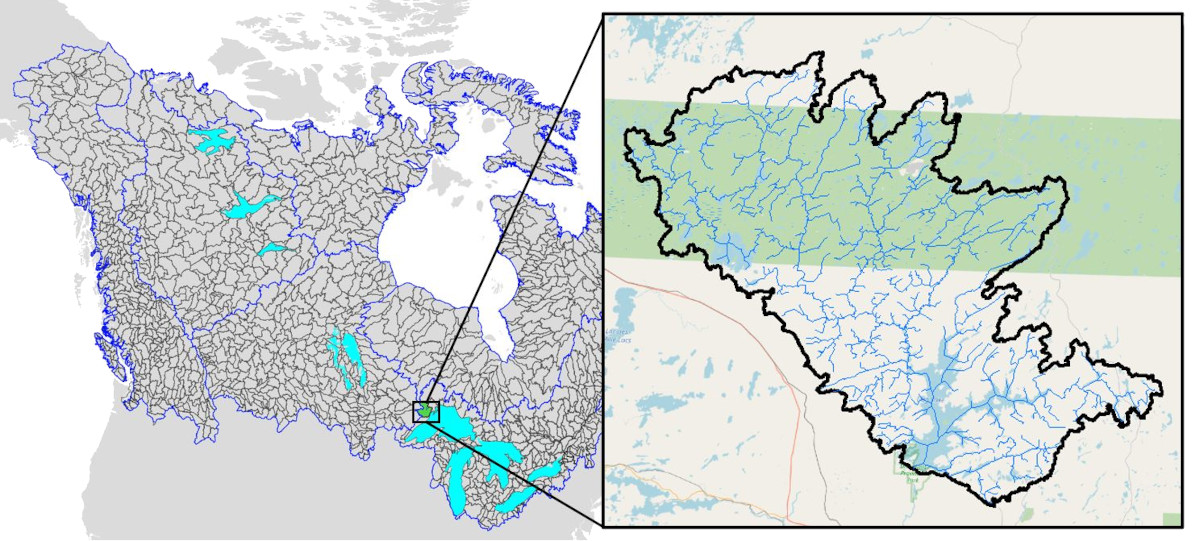
Map of Canada and zoom into area of Ontario

The C1W data library and model framework could be used to zoom in on smaller, local-scale areas such as this pictured example of a 3,446 km2 watershed in Ontario. C1W can be used to predict how changes in climate and wetland area impact the watershed’s capacity to mitigate floods and droughts.
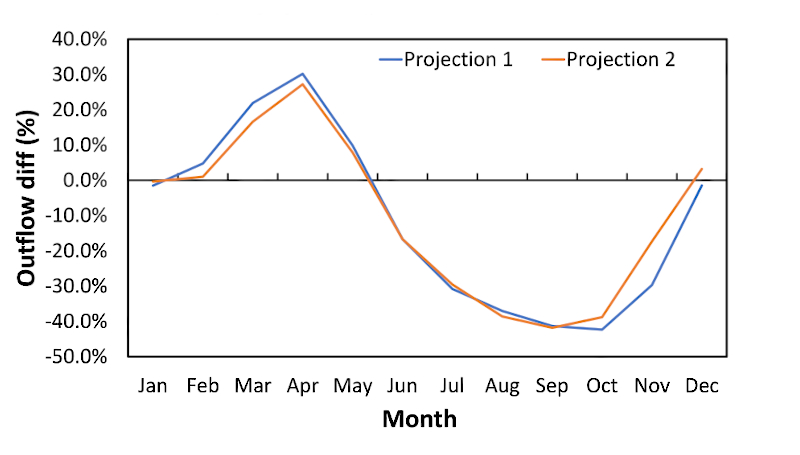
100% Reduction in wetland area

Description of the above image
| Month | Outflow difference (%): Projection 1 |
Outflow difference (%): Projection 2 |
|---|---|---|
| January | -1.50 | -0.38 |
| February | 4.77 | 1.01 |
| March | 21.90 | 16.59 |
| April | 30.19 | 27.22 |
| May | 9.81 | 7.85 |
| June | -16.68 | -16.70 |
| July | -30.82 | -29.57 |
| August | -37.05 | -38.60 |
| September | -41.31 | -41.82 |
| October | -42.34 | -38.82 |
| November | -29.71 | -17.33 |
| December | -1.49 | 3.20 |
Using the 3,446 km2 watershed in Ontario as an example, this graph shows predicted changes to river outflow if all wetland area (100%) is removed from this watershed. Projections 1 and 2 each use a different climate model simulation to create monthly predictions for the end of the 21st century, showing the combined impact of changes to climate and wetland area.
15% Increase in wetland area

Description of the above image
| Month | Outflow difference (%): Projection 1 |
Outflow difference (%): Projection 2 |
|---|---|---|
| January | -0.44 | -0.37 |
| February | 1.25 | 1.47 |
| March | -1.56 | -2.72 |
| April | -2.00 | -1.10 |
| May | -0.38 | -1.28 |
| June | 0.13 | 0.70 |
| July | 1.05 | 1.76 |
| August | 1.69 | 2.66 |
| September | 3.16 | 3.54 |
| October | 5.76 | 3.23 |
| November | 5.88 | 0.63 |
| December | 8.35 | 2.83 |
Using the same watershed as in the previous example, this graph illustrates predicted changes to river outflow if wetland area increases by 15%. Projections 1 and 2 each use a different climate model simulation to create monthly predictions for the end of the 21st century, showing the combined impact of changes to climate and wetland area.