
For more information
Media Relations
Agriculture and Agri-Food Canada
1-866-345-7972
aafc.mediarelations-relationsmedias.aac@agr.gc.ca
Researchers need to be able to respond rapidly to emerging pest threats to protect crops from costly damage. As biovigilance – a holistic approach to pest management that helps forecast, anticipate and respond to pest threats – continues to gain traction in the research community, there remains a gap of available tools to support researchers in this work.
Agriculture and Agri-Food Canada (AAFC) research scientist, Dr. Michelle Franklin saw an opportunity to help fill that gap when a small, long-nosed weevil was found to have established in the Fraser Valley and Metro Vancouver regions of British Columbia in 2019. Dr. Franklin's research into the weevil, known as the strawberry blossom weevil, aims to deliver a biovigilance framework for the small fruit industry that includes the development of standardized tools – starting with a new template for conducting pest surveys.
"One of the goals of our biovigilance project was to start to develop standardized tools that can be used further than just one insect. And I think we’ve done it here. We have a survey tool and the templates now that will serve the biovigilance community and can be used by other teams for other insects or pathogens."
- Dr. Michelle Franklin, Research Scientist, Agriculture and Agri-Food Canada
A digital upgrade helps make light work
When a new pest emerges, a pest survey is an important first step for understanding where the pest is occurring. It can also help identify related pests and natural enemies that could be potential biological control agents and contributes to general horizon scanning for new pests.
Typically recorded on paper, partners participating in Dr. Franklin's strawberry blossom weevil survey this past year ditched their pencils in favour of a smartphone app, developed on the Survey 123 platform by AAFC Geomatics team members Ryan Tondevold and Matthew McBurney. Launched by a QR code, the survey automatically captures exact latitude and longitude coordinates and provides options to select the type of survey method and host plant sampled. Samples collected in the field were linked to the information entered into the app by scanning the SKU included on the sticky card or vial provided to partners, the design of which is credited to Dr. Franklin's technician Yonathan Uriel.
The transition from paper records to the app has been a game changer for Dr. Franklin, who says that the standardized data collection offered through the app has made the data set easy to work with, and has reduced the chance for data entry errors and the need to process the data after-the-fact. This has ultimately resulted in time and cost savings for her research team. It will also make it easy to look back on the progression of the strawberry blossom weevil in the future.
Dr. Franklin realized two other advantages through this transition: 1) the data collected could be used in real time to see what areas and what plants were being surveyed; 2) the app leveraged the smartphone camera to allow photos to be submitted with the record, which provided interesting information like whether the plant was flowering or had fruit.
Charting the course for a successful pest survey through story mapping
Partners participating in the survey may have varied knowledge on the pest that they're surveying. To help bridge the gap, Dr Franklin worked with Ross Weiss and Mark Berry from the Saskatoon Research and Development Centre to create what is known as a story map. Linked within the app, the story map provided a general overview of the strawberry blossom weevil and a series of interactive maps that survey partners could use to better understand where the weevil might be found.
Included among the interactive maps was a climate map that showed areas that have highly suitable climatic conditions for the strawberry blossom weevil to give an idea of their potential distribution. The map was developed based on a climate matching analysis, which looked at the native distribution of the weevil and matched the climate in those regions with similar climates that exist in North America. With this information, survey partners were able to see if they were in an area where the pest was likely to establish. Other maps provided allowed survey partners to see where suitable host plants existed throughout Canada.
Survey, analyze, repeat
Dr. Franklin and her team are now starting to look through the sticky cards and vials that they received for the presence – and absence – of the strawberry blossom weevil. They'll also be looking for related weevils, natural enemies and parasitoids. These results will feed into new maps that will chart out the distribution of the strawberry blossom weevil and related weevils, led by Sheldon Hann, Land Resource Support Biologist at AAFC. This will help to further focus survey efforts for the next strawberry blossom weevil survey slated to start in spring 2023.
With the templates and expertise now in place, the survey app will be that much quicker and easier to implement – not only for the strawberry blossom weevil, but other emerging pests.
Key Discoveries/Benefits:
- The survey tool and templates will help researchers respond more rapidly to other emerging pests and pathogens
- Data collected in the app is standardized, making it easier for researchers to work with, reducing the chance for data entry errors, and saving resources that would have been spent on manual data entry. Added bonus: the data is available in real time!
- The story map feature provides information to help familiarize survey partners with the pest and where it may be found in their area. The data collected each year will help refine this information to further focus survey efforts
Photo gallery
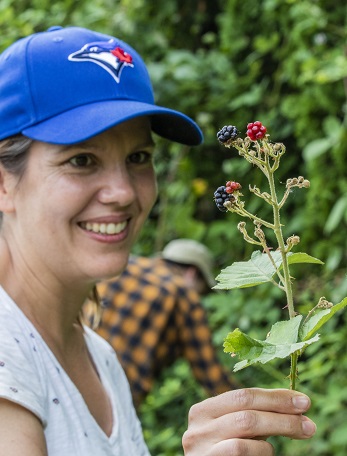
Dr. Michelle Franklin (photo courtesy of Warren Wong)
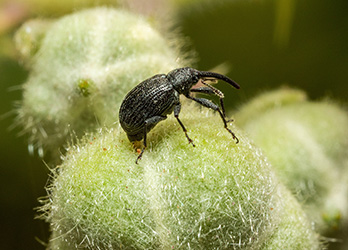
The strawberry blossom weevil (photo courtesy of Warren Wong)
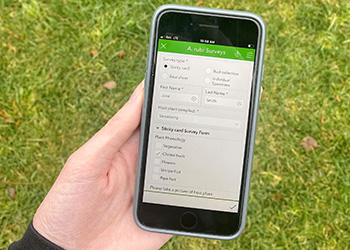
Interface of the pest survey app