
Summary
This analysis summarises the data and analyses that have been publicly released by provinces and industry associations, or which have been received by Agriculture and Agri-Food Canada (AAFC) from external sources regarding the cost of drying grains in 2019, and the associated costs from the Government of Canada's pollution pricing programFootnote 1, in jurisdictions where it applies.Footnote 2
Based on the information received, the average per-farm cost of pollution pricing associated with grain drying by province ranges from 0.05% to 0.38% of net operating costs for an average farm, equivalent to $210 to $774, depending on the province in question (Annex 1).
All of the estimates above are limited to direct costs to farmers. None of the figures above include indirect costs that may be associated with increased costs due to carbon pollution pricing impacts elsewhere in the supply chain that may be passed on to farmers.
Conversely, the preceding estimates do not include money returned to farmers under the federal carbon pollution pricing system. All direct revenue from the federal carbon pollution pricing system is returned to the jurisdiction of origin. In Alberta, Saskatchewan, Manitoba and Ontario, the majority of the direct revenue from the federal fuel charge goes directly to individuals and households through Climate Action Incentive payments.Footnote 3 Most Canadian households receive more in Climate Action Incentive's payments than they incur in total costs resulting from the federal carbon pollution pricing system. There is also a supplementary amount of 10% for people who live in rural and small communities.
Additionally, it should be noted that the federal carbon pollution pricing system provides significant relief to farmers in the jurisdictions where it applies: biological sources (for example, livestock) are not priced; the federal fuel charge does not apply to gasoline and diesel used in tractors, trucks and other machinery used on-farm; partial relief from the fuel charge is also provided for natural gas and propane used in commercial greenhouses.
What AAFC received
AAFC has received estimates of the cost of grain drying and carbon pollution pricing costs associated with grain drying from the following:
- Alberta’s Ministry of Agriculture and Forestry provided an internal report.
- Agricultural Producers Association of Saskatchewan (APAS) provided estimates of financial impacts of the carbon pollution price on drying wheat products. https://apas.ca/policy/carbon-tax
- Manitoba’s Ministry of Agriculture and Resource Development sent a letter to AAFC’s Deputy Minister.
- The GFO has issued press releases and has been quoted in the media regarding the costs of drying grain in Ontario:
Each of these groups has arrived at estimates of the cost of grain drying or the carbon pollution pricing associated with this activity using different underlying assumptions, which makes direct comparisons difficult.
Considerations and comparisons
Regional and Time Variations Among Estimates Received
- In the various estimates produced, the carbon pollution price associated with grain drying increases operating costs from between $0.16 per acre to $1.92 per acre, depending on the province in question, or as high as $5.50 per acre for corn.
- Grain drying costs vary regionally due to the types of crops grown and climate. For example, a large proportion of Canada’s corn is grown in Ontario, which is typically wetter than the prairies, resulting in higher drying costs for Ontario corn compared to prairie wheat.
- The estimates from GFO and Manitoba are for the 2019 wet harvest, whereas APAS and Alberta’s estimates are based on historical data. AAFC has not made any modifications to the estimates to adjust for the different years used as the basis for the submitted estimates.
- Given these regional and time variations, along with other factors such as variation in fuel prices and the degree to which grain is dried commercially, it is challenging to estimate the fuel costs for grain drying.
Scope of Estimates Received
- Alberta estimated that federal carbon pollution pricing associated with grain drying would cost farms in Alberta 16 cents per acre, which is equivalent to about $210 for an average-sized farm of 1,300 acres. This estimate is at the low end of those received from external sources, likely because it does not factor in the specific conditions of 2019. Alberta estimates include all grain and oilseed farms.
- Saskatchewan: The APAS estimate of $0.51 per acre of wheat for the carbon pollution price associated with grain drying is based on the moisture level and drying cost of wheat. To allow this estimate to be more readily compared with other estimates received, $0.51 per acre cost has been applied to all other grains and oilseeds harvested in this province.
- Manitoba estimated that federal carbon pollution pricing costs associated with grain drying would be between $2-3 million; which is equivalent to $311-$467 per farm or $0.23-0.33 per acre of all grain and oilseed farms. This estimate is in the middle of external estimates received.
- According to media quotes, GFO has estimated that the carbon pollution price increased grain drying costs for Ontario farmers by over $12 million in 2019, most of which was associated with the costs of drying corn. That would be an average cost of slightly over $750 for an average sized farm of nearly 400 acres, or about 0.38% of farm operating costs in Ontario. GFO has also stated in a press release that the carbon pollution price added $5.50 to the cost per acre for drying corn.
Results
These results do not represent AAFC’s estimates for the costs of pollution pricing associated with grain drying to farmers. Rather, they represent a standardization of results from the various groups providing this information to arrive at more comparable results.
AAFC did complete its own analysis of carbon pollution pricing and the implications for Canadian farms. That analysis was completed in 2018, and was based primarily on 2016 data available at the time. That AAFC analysis is available at:
- The English version of the 2018 analysis is available here: /sites/default/files/legacy/pack/pdf/carbon_price_presentation-eng.pdf
- The French version is available here: /sites/default/files/legacy/pack/pdf/carbon_price_presentation-fra.pdf
Based on the information received, the average per-farm cost of pollution pricing associated with grain drying by province ranges from $210 to $774, which is the equivalent of 0.05% to 0.38% of net operating costs for an average farm, depending on the province in question (Annex 1).
- The estimates from the lower end of the range (Alberta and Saskatchewan data) are based on historical averages; therefore, it could be considered an estimate of an average year in those provinces.
- The estimates at the middle and high end of the range (Manitoba and Ontario) are based on 2019 (a wet year); therefore, it could be considered an estimate for a year with higher-than-normal moisture levels.
Fuels most commonly used on-farm are gasoline and diesel, which are exempt from the federal fuel charge in jurisdictions where it applies. Most grain drying equipment is powered with natural gas or propane, which are subject to the federal fuel charge in jurisdictions where it applies.
Costs are expected to vary by farm size, with larger farms having above average costs and smaller farms having below average costs. A breakdown of Canadian grain and oilseed farms by revenue size is shown in Annex 2. Although drying costs are not necessarily directly proportional to farm size, there is expected to be a strong correlation. While the average Canadian grain and oilseed farm has gross revenues of $460,000 per year, there are over 2,000 farms with revenues above $2 million per year that could see carbon pollution pricing costs that are significantly higher than the provincial averages.
- Corn is also more expensive to dry; therefore, farms growing primarily corn would be expected to have costs above the average provincial estimates.
- The effect of carbon pollution pricing at the provincial level will vary depending on a multiplicity of factors, including the mix of farm types in the province, average farm size and the provincial carbon pollution pricing system in effect.
- All of the estimates above are limited to direct costs to farmers and therefore do not include indirect costs of carbon pollution pricing impacts elsewhere in the supply chain, that may be passed on to farmers.
- Conversely, the preceding estimates do not include rebates under the federal carbon pollution pricing system. All direct revenue from the federal carbon pollution pricing system is returned to the jurisdiction of origin. In Alberta, Saskatchewan, Manitoba and Ontario, the majority of the direct revenue from the federal fuel charges goes directly to individuals and households through Climate Action Incentive’s payments. Most Canadian households receive more in Climate Action Incentive’s payments than they incur in total costs resulting from the federal carbon pollution pricing system. There is also a supplementary amount of 10% for people who live in rural and small communities.Footnote 4
| Basic Farm Statistics (from 2018) | Alberta | Saskatchewan | Manitoba | Ontario All G&O Farms |
Ontario Corn Only |
|---|---|---|---|---|---|
| Number of grain and oilseed farms: | 12,965 | 19,585 | 6,425 | 16,000 | N/A |
| Acres of grain and oilseeds: | 17,011,000 | 29,734,700 | 9,105,100 | 6,251,300 | N/A |
| Average acres per farm: | 1,312 | 1,518 | 1,417 | 391 | N/A |
| Total operating expenses for grain farmers ($ million): | $5,375 | $8,507 | $3,140 | $3,143 | N/A |
| Average operating expenses per farm: | $414,578 | $434,363 | $488,716 | $196,438 | N/A |
| Average net operating income per farm: | $126,897 | $123,883 | $144,583 | $49,783 | N/A |
| Alberta | Saskatchewan | Manitoba | Ontario All G&O Farms |
Ontario Corn Only |
|
|---|---|---|---|---|---|
| Estimated Carbon Pollution Price Paid, Provincial Total ($ million): | $3 | $15 | $3 | $12 | N/A |
| Average Carbon Pollution Price per farm: | $210 | $774 | $467 | $750 | N/A |
| Average Carbon Pollution Price per acre: | $0.16 | $0.51 | $0.33 | $1.92 | $5.50 |
| Average Carbon Pollution Price as a % of opperating costs: | 0.05% | 0.18% | 0.10% | 0.38% | N/A |
| Average Carbon Pollution Price as a % of net income: | 0.17% | 0.62% | 0.32% | 1.51% | N/A |
| Alberta | Saskatchewan | Manitoba | Ontario All G&O Farms |
Ontario Corn Only |
|
|---|---|---|---|---|---|
| Total provincial grain drying costs ($ million): | $23 | $140 | $38 | N/A | N/A |
| Average grain drying cost per farm without pollution price: | $1,735 | $7,169 | $5,914 | N/A | N/A |
| Total grain drying cost / acre: | $1.32 | $4.72 | $4.17 | N/A | N/A |
| Grain drying as a fraction of operating expenses: | 0.42% | 1.65% | 1.21% | N/A | N/A |
| Grain drying as a fraction of net income: | 1.36% | 5.78% | 4.09% | N/A | N/A |
|
Additional sources: All basic farm data from Statistics Canada (Acreage from Table: 32-10-0359-01; Farm counts and farm financial information from Agricultural Taxation Data Program) |
|||||
| Alberta | Saskatchewan | Manitoba | Ontario | Canada | % of Canada’s Total | |
|---|---|---|---|---|---|---|
| $25,000 to $100,000 | 2,935 | 4,445 | 1,180 | 6,200 | 16,330 | 27% |
| $100,000 to $999,999 | 7,170 | 10,755 | 3,765 | 6,690 | 31,070 | 52% |
| $1,000,000 to $1,999,999 | 1,230 | 2,115 | 790 | 565 | 4,975 | 8% |
| $2,000,000 and over | 615 | 945 | 375 | 235 | 2,260 | 4% |
| Total Farm Numbers, all sizes: | 12,990 | 19,605 | 6,430 | 16,040 | 60,090 | |
| Average gross revenues (all revenue classes) | $549,454 | $560,156 | $628,220 | $244,520 | $460,572 | |
|
Source: Statistics Canada; Agricultural Taxation Data Program, 2018; AAFC’s calculations. |
||||||
Annex 3: Breakdown of Farm Expenses
Data from Statistics Canada indicates the largest farm operating expenses have historically been wages, fertilizer, feed, interest and overall energy. While most expense items have increased over time, and sometimes show large year to year shifts, some items show more recent variability than others. For example, machinery fuel expenses, which are the largest component of energy expenses, are influenced by crude oil prices and international energy markets, and have shown notable increases and decreases over the past 10 years. Interest expenses have also increased in recent years, partly due to increases in interest rates.
Conversely, other expenses, such as wages and feed, have shown more consistent growth and less year to year variation. Fertilizer prices are influenced by international supply and demand, and show slightly more variability, but have been within a consistent range in recent years.
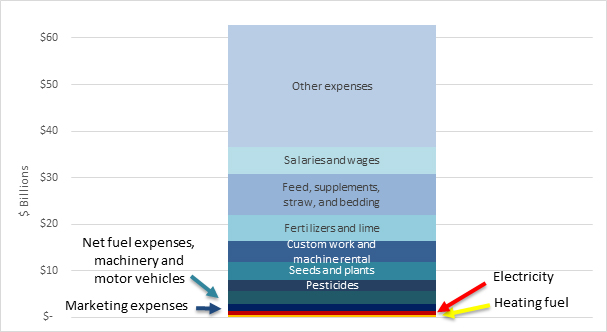
Description of above image
| 2018 All Farms | Canada |
|---|---|
| Heating fuel and curing fuel | $559,380,289 |
| Electricity | $853,791,527 |
| Marketing expenses | $1,438,472,727 |
| Net fuel expenses, machinery and motor vehicles | $2,892,933,625 |
| Pesticides | $2,371,277,457 |
| Seeds and plants | $3,807,487,253 |
| Custom work and machine rental | $4,399,906,811 |
| Fertilizers and lime | $5,689,661,912 |
| Feed, supplements, straw, and bedding | $8,814,709,303 |
| Salaries and wages | $5,799,544,882 |
| Other expenses | $26,120,899,462 |
| Expense - Total operating expenses | $62,748,065,248 |
Source: Statistics Canada; Agricultural Taxation Data Program, 2018; AAFC’s calculations.
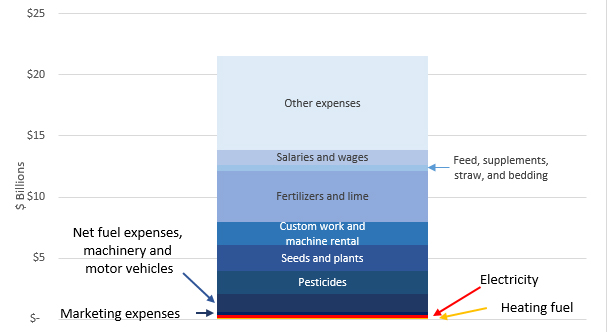
Description of above image
| 2018 Oilseed and grain farms | Canada |
|---|---|
| Heating fuel and curing fuel | $95,741,425 |
| Electricity | $223,463,734 |
| Marketing expenses | $274,321,042 |
| Net fuel expenses, machinery and motor vehicles | $1,511,327,234 |
| Pesticides | $1,835,790,786 |
| Seeds and plants | $2,143,765,897 |
| Custom work and machine rental | $1,910,339,400 |
| Fertilizers and lime | $4,144,943,556 |
| Feed, supplements, straw, and bedding | $496,782,395 |
| Salaries and wages | $1,225,137,093 |
| Other expenses | $7,690,625,250 |
| Expense - Total operating expenses | $21,552,237,812 |
Source: Statistics Canada; Agricultural Taxation Data Program, 2018; AAFC’s calculations.
Estimated costs of carbon pollution pricing in relation to grain drying in 2019 (PDF)