
For your convenience, this report is available in the following format:
PDF (1.9 MB)
Overview
Beekeeping is an important agricultural industry in Canada, producing honey and other hive products, and delivering valuable pollination services to farmers of orchard fruits, many berries, vegetables, forage, and the production of hybrid canola seed. AAFC has updated the estimate of the total annual economic contribution of honey bee pollination through direct additional harvest value; honey bees were directly tied to $3.18 billion in additional harvest value. When the estimated contribution of honey bee pollination to the production of hybrid canola seed is added, the total estimated contribution rises to $7 billion per year.
Like the previous year, the 2021 beekeeping season was affected by the disruptions in travel and transportation related to the COVID-19 pandemic. Limited travel options for Seasonal and Temporary Foreign Workers prevented or delayed the arrival of the workforce critical to many beekeeping operations. COVID-related transportation disruptions also affected the supply of imported replacement queen and package bees. These important supplies are shipped from a limited number of approved places including Australia, New Zealand, Chile, California, and Hawaii for queens; and Australia, New Zealand, Chile for ‘package’ bees (about one kilogram of worker bees and a mated queen bee to be placed in a hive box on arrival). These replacement bees complement domestic supplies, and typically arrive in the early spring to address hive losses and replace weak queen bees after the winter has passed.
Despite these challenges, beekeepers grew the numbers of honey bee colonies to a record high 810,496, 6.0% more than the previous year. Honey production in Canada in 2021, by volume, rose 7.9% from a year earlier to 89.8 million pounds. Thanks to higher volumes and sustained robust prices for honey, the total value of the 2021 harvest rose 39.4% (over 2020) to $278.0 million.
While beekeepers operate in all provinces, the majority (67.6%) of Canadian honey bee colonies are kept in the Prairie provinces (Manitoba, Saskatchewan and Alberta) where long summer days and large areas of good forage crops for bees make it possible for beekeepers in those provinces to produce honey well in surplus to provincial demand. In contrast, the majority (57.4%) of beekeepers (anyone with one or more honey bee colonies) operate in Ontario and British Columbia, managing 20.3% of the national total of colonies. The three Prairie Provinces produced 81.6% of the total national honey production in 2021, totalling 73,220 thousand pounds (out of a total national production of 89,773 thousand pounds).
This regional concentration of honey production is echoed in the regional balance of honey exports. The Prairie Provinces are the origin for 75.8% of export shipments of honey, almost all of the remainder (22.9%) of Canadian honey exports leave Canada from Ontario and Quebec. The United States has been the major export destination for Canadian honey for many years, with Japan following far behind; this has shifted recently. Since the start of 2020 many months have seen Japan emerge as the major export destination for Canadian honey. In the most recent complete year (2021), Japan was the destination for 54.5% (4,000 MT) of honey exports from Canada while the United States received 40.8% (2992 MT) of total annual exports.
Canadian beekeepers import queen bees and package bees (a few pounds of worker bees and a mated queen) each spring to supplement domestic supplies of bees. These imported bees are used to rapidly replace over-winter queen and hive losses and to grow beekeeping operations over the season. Queens can be imported from certain countries and regions which have been evaluated to ensure that bees from these places do not pose any unacceptable risk to Canada. Most imported queen bees come from California and Hawaii (84.1%), with contributions from Italy (5.5%), New Zealand (3.0%), Australia (2.1%), and Chile (2.1%).
Package bees come from a shorter list of approved sources: Australia, New Zealand and Chile. In 2021 supply and transportation challenges related to the COVID-19 pandemic stranded many sources of package bees overseas resulting in all 8,661 packages of bees arriving in Canada originating in Australia. The 2021 total of 8,661 represents 30% of the average quantity of packages received in each of the previous four years.
Section A: Statistical overview of Canadian honey and bee industry
1. Production
1.1 Number of beekeepers[1] by province
| 2017 | 2018 | 2019 | 2020 | 2021 | 2021 % Share | |
|---|---|---|---|---|---|---|
| Prince Edward Island | 46 | 50 | 50 | 30 | 30 | 0.2% |
| Nova Scotia | 604 | 631 | 690 | 788 | 874 | 6.7% |
| New Brunswick | 374 | 388 | 415 | 450 | 495 | 3.8% |
| Quebec | 402 | 425 | 440 | 485 | 511 | 3.9% |
| Ontario | 3,331 | 3,026 | 2,506 | 2,856 | 3,227 | 24.6% |
| Manitoba | 746 | 834 | 905 | 914 | 930 | 7.1% |
| Saskatchewan | 1,044 | 1,059 | 1,101 | 1,050 | 1,226 | 9.4% |
| Alberta | 1,420 | 1,572 | 1,653 | 1,621 | 1,512 | 11.5% |
| British Columbia | 2,640 | 2,676 | 2,763 | 3,800 | 4,300 | 32.8% |
| Canada[2] | 10,589 | 10,661 | 10,523 | 11,994 | 13,105 | 100.0% |
| Notes:
[1] Beekeeper numbers may include pollinators that may not extract honey. |
||||||
1.2. Number of colonies[1] by province
| 2017 | 2018 | 2019 | 2020 | 2021 | 2021 % Share | |
|---|---|---|---|---|---|---|
| Prince Edward Island | 6,300 | 4,453 | 3,591 | 4,250 | 3,436 | 0.4% |
| Nova Scotia | 26,426 | 25,446 | 25,716 | 21,600 | 27,596 | 3.4% |
| New Brunswick | 7,100 | 8,141 | 4,120 | 8,456 | 9,250 | 1.1% |
| Quebec | 61,020 | 60,439 | 66,700 | 67,173 | 57,498 | 7.1% |
| Ontario | 105,244 | 100,413 | 90,675 | 101,989 | 102,328 | 12.6% |
| Manitoba | 111,802 | 114,098 | 114,668 | 116,697 | 115,707 | 14.3% |
| Saskatchewan | 115,000 | 114,000 | 115,000 | 100,000 | 115,000 | 14.2% |
| Alberta | 317,000 | 311,000 | 314,800 | 283,000 | 317,500 | 39.2% |
| British Columbia | 40,776 | 52,033 | 55,781 | 56,769 | 62,181 | 7.7% |
| Canada[2] | 790,668 | 790,023 | 791,051 | 764,616 | 810,496 | 100.0% |
|
Notes: |
||||||
1.3. Number of beekeepers and number of colonies by province
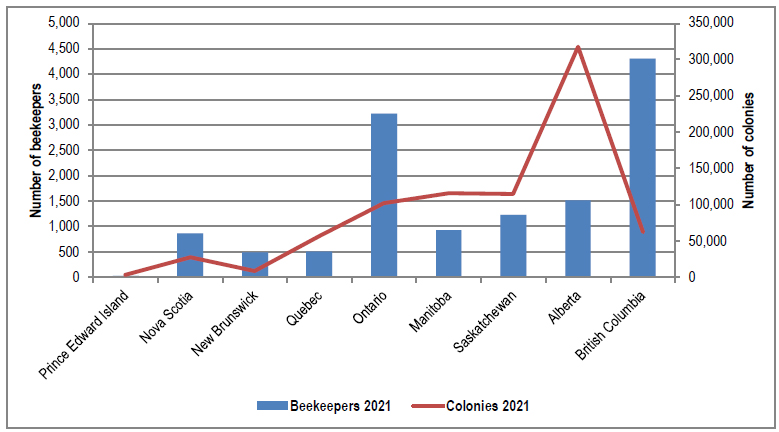
Source: Statistics Canada. Table 32-10-0353-01 Production and value of honey
Description of the image above.
Number of beekeepers and number of colonies by province
| Province | Number of beekeepers 2021 | Number of colonies 2021 |
|---|---|---|
| Prince Edward Island | 30 | 3,436 |
| Nova Scotia | 874 | 27,596 |
| New Brunswick | 495 | 9,250 |
| Quebec | 511 | 57,498 |
| Ontario | 3,227 | 102,328 |
| Manitoba | 930 | 115,707 |
| Saskatchewan | 1,226 | 115,000 |
| Alberta | 1,512 | 317,500 |
| British Columbia | 4,300 | 62,181 |
1.4. Total honey production[1] by province – thousands of pounds
| 2017 | 2018 | 2019 | 2020 | 2021 | 2021 % Share | |
|---|---|---|---|---|---|---|
| Prince Edward Island | 231 | 168 | 181 | 159 | 192 | 0.2% |
| Nova Scotia | 553 | 522 | 390 | 550 | 578 | 0.6% |
| New Brunswick | 201 | 469 | 218 | 346 | 406 | 0.5% |
| Quebec | 3,723 | 4,472 | 3,963 | 2,996 | 4,628 | 5.2% |
| Ontario | 6,087 | 8,174 | 7,963 | 8,535 | 6,402 | 7.1% |
| Manitoba | 19,120 | 18,710 | 18,350 | 20,300 | 18,630 | 20.8% |
| Saskatchewan | 21,965 | 20,520 | 20,240 | 15,700 | 19,665 | 21.9% |
| Alberta | 40,576 | 38,564 | 31,418 | 30,735 | 34,925 | 38.9% |
| British Columbia | 3,556 | 3,397 | 3,907 | 3,843 | 4,346 | 4.8% |
| Canada[2] | 96,012 | 94,996 | 86,630 | 83,165 | 89,773 | 100.0% |
|
Notes: |
||||||
1.5. Production value[1] of honey by province – thousands of Canadian dollars
| 2017 | 2018 | 2019 | 2020 | 2021 | 2021 % Share | |
|---|---|---|---|---|---|---|
| Prince Edward Island | 666 | 393 | 423 | 332 | 462 | 0.2% |
| Nova Scotia | 1,586 | 1,574 | 1,073 | 2,133 | 1,689 | 0.6% |
| New Brunswick | 511 | 1,430 | 666 | 1,399 | 1,809 | 0.7% |
| Quebec | 15,120 | 16,655 | 15,408 | 8,136 | 17,000 | 6.1% |
| Ontario | 20,257 | 34,329 | 29,437 | 32,007 | 30,088 | 10.8% |
| Manitoba | 32,268 | 32,786 | 32,997 | 43,435 | 48,938 | 20.6% |
| Saskatchewan | 34,045 | 33,858 | 32,384 | 31,400 | 57,380 | 21.2% |
| Alberta | 71,359 | 66,472 | 58,188 | 66,846 | 96,358 | 34.7% |
| British Columbia | 14,292 | 13,320 | 11,040 | 13,780 | 14,248 | 5.1% |
| Canada[2] | 190,104 | 200,816 | 181,615 | 199,468 | 278,029 | 100.0% |
| Notes: [1] Value excludes inventory sales except for in Quebec. [2] Newfoundland and Labrador is excluded since the province has limited beekeeping. Source: Statistics Canada. Table 32-10-0353-01 Production and value of honey |
||||||
2. Trade
2.1. Trade balance
2.1.1. Canada's honey trade balance – thousands of Canadian dollars
| 2017 | 2018 | 2019 | 2020 | 2021 | |
|---|---|---|---|---|---|
| Export | 76,986 | 78,011 | 53,827 | 47,371 | 44,663 |
| Import | 41,284 | 36,787 | 45,403 | 42,576 | 47,479 |
| Trade Balance (Exports − Imports) | 35,702 | 41,224 | 8,424 | 4,795 | -2,816 |
| Source: Statistics Canada. (CATSNET, February 2022) | |||||
2.2. Exports
2.2.1. Canada's honey exports by province[1] – by value (thousands of Canadian dollars)
| 2017 | 2018 | 2019 | 2020 | 2021 | 2021 % Share | |
|---|---|---|---|---|---|---|
| Prince Edward Island | 0 | 0 | 0 | 2 | 0 | 0.0% |
| Nova Scotia | 126 | 15 | 60 | 113 | 2 | 0.0% |
| Quebec | 5,446 | 4,602 | 4,098 | 6,200 | 5,314 | 11.9% |
| Ontario | 3,864 | 6,362 | 5,722 | 2,527 | 6,217 | 13.9% |
| Manitoba | 19,310 | 13,033 | 11,943 | 16,407 | 17,270 | 38.7% |
| Saskatchewan | 19,928 | 20,511 | 11,097 | 7,230 | 3,178 | 7.1% |
| Alberta | 27,150 | 31,749 | 19,735 | 14,387 | 12,080 | 27.0% |
| British Columbia | 1,160 | 1,739 | 1,172 | 506 | 602 | 1.3% |
| Canada | 76,986 | 78,011 | 53,827 | 47,371 | 44,663 | 100.0% |
| Notes: [1] Exports may include honey not produced in that province. Source: Statistics Canada. (CATSNET, February 2022) |
||||||
2.2.2. Canada's honey exports by province – by volume (metric tonnes)
| 2017 | 2018 | 2019 | 2020 | 2021 | 2021 % Share | |
|---|---|---|---|---|---|---|
| Prince Edward Island | 0 | 0 | 0 | 1 | 0 | 0.0% |
| Nova Scotia | 22 | 2 | 7 | 20 | 0 | 0.0% |
| Quebec | 1,006 | 838 | 611 | 965 | 736 | 10.0% |
| Ontario | 828 | 1,219 | 1,006 | 398 | 946 | 12.9% |
| Manitoba | 5,242 | 3,160 | 2,959 | 3,358 | 2,941 | 40.1% |
| Saskatchewan | 5,541 | 5,127 | 2,735 | 1,630 | 599 | 8.2% |
| Alberta | 6,372 | 7,958 | 4,358 | 2,852 | 2,020 | 27.5% |
| British Columbia | 186 | 284 | 171 | 85 | 98 | 1.3% |
| Total | 19,196 | 18,587 | 11,847 | 9,309 | 7,341 | 100.0% |
| Source: Statistics Canada. (CATSNET, February 2022) | ||||||
2.2.3. Canada's top honey export destinations – by value (thousands of Canadian dollars)
| 2017 | 2018 | 2019 | 2020 | 2021 | 2021 % Share | |
|---|---|---|---|---|---|---|
| Japan | 12,432 | 12,643 | 17,884 | 23,735 | 25,036 | 56.1% |
| United States | 60,878 | 62,005 | 33,615 | 19,363 | 17,574 | 39.3% |
| South Korea | 550 | 696 | 503 | 671 | 823 | 1.8% |
| China | 1,981 | 1,903 | 1,403 | 1,648 | 458 | 1.0% |
| United Kingdom | 0 | 0 | 0 | 93 | 178 | 0.4% |
| Hong Kong | 460 | 347 | 154 | 688 | 144 | 0.3% |
| India | 366 | 2 | 0 | 70 | 92 | 0.2% |
| Greece | 0 | 2 | 0 | 48 | 65 | 0.1% |
| Belgium | 0 | 0 | 37 | 0 | 51 | 0.1% |
| Kuwait | 23 | 13 | 5 | 60 | 42 | 0.1% |
| Others | 296 | 400 | 227 | 995 | 200 | 0.4% |
| Total | 76,986 | 78,011 | 53,827 | 47,371 | 44,663 | 100.0% |
| Source: Statistics Canada. (CATSNET, February 2022) | ||||||
2.2.4. Canada's top honey export destinations – by volume (metric tonnes)
| 2017 | 2018 | 2019 | 2020 | 2021 | 2021 % Share | |
|---|---|---|---|---|---|---|
| Japan | 2,799 | 2,785 | 3,575 | 4,362 | 4,002 | 54.5% |
| United States | 15,762 | 15,221 | 7,872 | 4,143 | 2,992 | 40.8% |
| South Korea | 109 | 124 | 128 | 135 | 141 | 1.9% |
| China | 323 | 326 | 209 | 295 | 82 | 1.1% |
| United Kingdom | 0 | 0 | 0 | 15 | 26 | 0.4% |
| Hong Kong | 72 | 55 | 19 | 120 | 20 | 0.3% |
| India | 75 | 0 | 0 | 13 | 17 | 0.2% |
| Greece | 0 | 0 | 0 | 15 | 14 | 0.2% |
| Belgium | 0 | 0 | 5 | 0 | 9 | 0.1% |
| Kuwait | 4 | 2 | 1 | 11 | 8 | 0.1% |
| Others | 52 | 74 | 39 | 199 | 31 | 0.4% |
| Total | 19,196 | 18,587 | 11,847 | 9,309 | 7,341 | 100.0% |
| Source: Statistics Canada. (CATSNET, February 2022) | ||||||
2.3. Imports
2.3.1. Canada's honey imports by province – by value (thousands of Canadian
dollars)
| 2017 | 2018 | 2019 | 2020 | 2021 | 2021 % Share | |
|---|---|---|---|---|---|---|
| Nova Scotia | 8 | 2 | 73 | 3 | 2 | 0.0% |
| New Brunswick | 7 | 30 | 7 | 0 | 22 | 0.0% |
| Quebec | 12,356 | 10,783 | 10,817 | 11,302 | 15,249 | 32.1% |
| Ontario | 24,631 | 19,685 | 27,543 | 24,404 | 24,214 | 51.0% |
| Manitoba | 72 | 15 | 44 | 28 | 378 | 0.8% |
| Saskatchewan | 5 | 20 | 69 | 1 | 550 | 1.2% |
| Alberta | 28 | 837 | 737 | 825 | 1,019 | 2.1% |
| British Columbia | 4,178 | 5,414 | 6,112 | 6,013 | 6,045 | 12.7% |
| Canada | 41,284 | 36,787 | 45,403 | 42,576 | 47,479 | 100.0% |
| Source: Statistics Canada. (CATSNET, February 2022) | ||||||
2.3.2. Canada's honey imports by province – by volume (metric tons)
| 2017 | 2018 | 2019 | 2020 | 2021 | 2021 % Share | |
|---|---|---|---|---|---|---|
| Nova Scotia | 1 | 0 | 22 | 1 | 0 | 0.0% |
| New Brunswick | 0 | 3 | 0 | 0 | 4 | 0.0% |
| Quebec | 2,633 | 2,501 | 2,896 | 3,080 | 3,460 | 42.2% |
| Ontario | 3,585 | 2,306 | 3,151 | 3,660 | 4,070 | 49.6% |
| Manitoba | 9 | 1 | 5 | 2 | 63 | 0.8% |
| Saskatchewan | 0 | 1 | 2 | 0 | 100 | 1.2% |
| Alberta | 3 | 24 | 25 | 26 | 120 | 1.5% |
| British Columbia | 418 | 369 | 412 | 376 | 383 | 4.7% |
| Canada | 6,650 | 5,207 | 6,513 | 7,144 | 8,200 | 100.0% |
| Source: Statistics Canada. (CATSNET, February 2022) | ||||||
2.3.3. Canada's top sources of honey imports – by value (thousands of Canadian
dollars)
| 2017 | 2018 | 2019 | 2020 | 2021 | 2021 % Share | |
|---|---|---|---|---|---|---|
| New Zealand | 9,560 | 12,759 | 17,470 | 14,122 | 12,918 | 27.2% |
| Brazil | 7,384 | 4,227 | 6,890 | 5,864 | 11,650 | 24.5% |
| United States | 2,667 | 3,213 | 2,539 | 4,931 | 3,518 | 7.4% |
| India | 2,018 | 2,315 | 3,397 | 3,342 | 3,391 | 7.1% |
| Spain | 3,121 | 1,490 | 2,606 | 2,013 | 3,162 | 6.7% |
| Australia | 3,102 | 3,008 | 3,110 | 2,719 | 2,594 | 5.5% |
| Thailand | 1,856 | 4,011 | 3,476 | 2,450 | 1,955 | 4.1% |
| Greece | 1,227 | 1,290 | 1,282 | 1,439 | 1,628 | 3.4% |
| Saudi Arabia | 951 | 959 | 1,297 | 990 | 1,373 | 2.9% |
| Viet Nam | 900 | 481 | 276 | 1,356 | 955 | 2.0% |
| Others | 8,498 | 3,033 | 3,058 | 3,351 | 4,335 | 9.1% |
| Total | 41,284 | 36,787 | 45,403 | 42,576 | 47,479 | 100.0% |
| Source: Statistics Canada. (CATSNET, February 2022) | ||||||
2.3.4. Canada's top sources of honey imports – by volume (metric tons)
| 2017 | 2018 | 2019 | 2020 | 2021 | 2021 % Share | |
|---|---|---|---|---|---|---|
| Brazil | 1,280 | 913 | 1,811 | 1,749 | 2,509 | 30.6% |
| India | 506 | 745 | 1,092 | 1,079 | 1,118 | 13.6% |
| United States | 469 | 566 | 575 | 1,148 | 807 | 9.8% |
| Spain | 735 | 315 | 529 | 416 | 795 | 9.7% |
| Thailand | 484 | 970 | 891 | 700 | 756 | 9.2% |
| Viet Nam | 326 | 216 | 129 | 544 | 438 | 5.3% |
| Greece | 178 | 138 | 142 | 255 | 338 | 4.1% |
| New Zealand | 346 | 344 | 412 | 331 | 285 | 3.5% |
| Australia | 334 | 324 | 279 | 223 | 219 | 2.7% |
| Argentina | 78 | 71 | 85 | 84 | 179 | 2.2% |
| Others | 1,916 | 604 | 567 | 614 | 755 | 9.2% |
| Total | 6,650 | 5,207 | 6,513 | 7,144 | 8,200 | 100.0% |
| Source: Statistics Canada. (CATSNET, February 2022) | ||||||
2.3.5. Canada's sources of package honey bee imports – by value (Canadian dollars)
| 2017 | 2018 | 2019 | 2020 | 2021 | 2021 % Share | |
|---|---|---|---|---|---|---|
| Australia | 331,206 | 853,887 | 1,255,269 | 84,870 | 736,172 | 100.0% |
| New Zealand | 1,510,369 | 1,278,340 | 1,988,220 | 951,273 | 0 | 0.0% |
| Chile | 316,067 | 651,930 | 167,180 | 86,400 | 0 | 0.0% |
| Total | 2,157,642 | 2,784,157 | 3,410,677 | 1,122,543 | 736,172 | 100.0% |
| Notes: Does not include queen bees and live bees that are not honey bees. Source: Statistics Canada. (CATSNET, February 2022) |
||||||
2.3.6. Canada's sources of package honey bee imports – by volume (kilograms)
| 2017 | 2018 | 2019 | 2020 | 2021 | 2021 % Share | |
|---|---|---|---|---|---|---|
| Australia | 2,880 | 7,959 | 13,462 | 720 | 8,661 | 100.0% |
| New Zealand | 20,637 | 16,839 | 25,308 | 12,010 | 0 | 0.0% |
| Chile | 3,870 | 6,840 | 2,569 | 1,016 | 0 | 0.0% |
| Total | 27,387 | 31,638 | 41,339 | 13,746 | 8,661 | 100.0% |
| Notes: Does not include queen bees and live bees that are not honey bees. Source: Statistics Canada. (CATSNET, February 2022) |
||||||
2.3.7. Canada's sources of queen bee imports – by value (Canadian dollars)
| 2017 | 2018 | 2019 | 2020 | 2021 | 2021 % Share | |
|---|---|---|---|---|---|---|
| United States | 7,138,232 | 7,111,970 | 7,177,805 | 7,313,155 | 7,327,062 | 85.9% |
| Italy | 0 | 0 | 0 | 136,325 | 471,134 | 5.5% |
| New Zealand | 63,232 | 884,234 | 103,034 | 318,928 | 254,707 | 3.0% |
| Australia | 265,108 | 212,140 | 191,143 | 106,147 | 179,022 | 2.1% |
| Chile | 217,937 | 225,279 | 504,080 | 143,554 | 177,519 | 2.1% |
| Others | 2,767 | 14,166 | 0 | 22,001 | 117,351 | 1.4% |
| Total | 7,687,276 | 8,447,789 | 7,976,062 | 8,040,110 | 8,526,795 | 100.0% |
| Source: Statistics Canada. (CATSNET, February 2022) | ||||||
2.3.8. Canada's sources of queen bee imports – by quantity (number)
| 2017 | 2018 | 2019 | 2020 | 2021 | 2021 % Share | |
|---|---|---|---|---|---|---|
| United States | 218,058 | 220,270 | 208,530 | 193,794 | 220,403 | 84.1% |
| Italy | 0 | 0 | 0 | 4,089 | 17,170 | 6.6% |
| New Zealand | 1,609 | 21,983 | 2,843 | 8,721 | 5,452 | 2.1% |
| Australia | 8,527 | 9,676 | 7,837 | 3,023 | 7,302 | 2.8% |
| Chile | 7,834 | 9,762 | 16,718 | 3,625 | 7,554 | 2.9% |
| Others | 82 | 427 | 0 | 691 | 4,132 | 1.6% |
| Total | 236,110 | 262,118 | 235,928 | 213,943 | 262,013 | 100.0% |
| Source: Statistics Canada. (CATSNET, February 2022) | ||||||
3. Consumption
3.1. Honey available[1] for consumption in Canada – kilograms per person
| 2017 | 2018 | 2019 | 2020 | 2021 | |
|---|---|---|---|---|---|
| Honey[2] | 0.90 | 0.85 | 0.95 | 0.98 | 1.14 |
| Notes: [1] Food available per person is calculated by dividing the domestic disappearance by the Canadian population as of July 1st of the reference year, at the retail level. Domestic disappearance represents the total food available for human consumption from the Canadian food supply chain. Total Supply = Beginning stocks + Production + Imports Domestic Disappearance = Total supply − Exports − Manufacturing − Waste − Ending stocks [2] Does not adjust for losses, such as waste and/or spoilage in stores, households, private institutions or restaurants or losses during preparation. Source: Statistics Canada. Table 32-10-0054-01 Food available in Canada |
|||||
4. World data
World trade data
4.1.1. Top exporters of honey worldwide – by value (thousands of Canadian dollars)
| 2017 | 2018 | 2019 | 2020 | 2021 | 2021 % Share | |
|---|---|---|---|---|---|---|
| New Zealand | 348,666 | 317,420 | 304,314 | 440,858 | 409,756 | 13.2% |
| China | 350,287 | 322,762 | 311,714 | 340,817 | 326,422 | 10.5% |
| Argentina | 238,189 | 226,370 | 194,508 | 230,082 | 274,924 | 8.8% |
| Brazil | 158,802 | 123,790 | 90,693 | 132,113 | 204,008 | 6.6% |
| Germany | 182,095 | 182,512 | 176,548 | 201,025 | 184,366 | 5.9% |
| Ukraine | 172,619 | 127,788 | 134,398 | 185,340 | 180,765 | 5.8% |
| India | 135,573 | 132,635 | 134,046 | 111,235 | 170,838 | 5.5% |
| Spain | 143,404 | 136,902 | 117,712 | 150,682 | 161,366 | 5.2% |
| Mexico | 136,753 | 156,140 | 90,040 | 91,148 | 147,438 | 4.7% |
| Hungary | 116,502 | 111,907 | 107,558 | 119,692 | 106,654 | 3.4% |
| Belgium | 100,054 | 101,179 | 86,187 | 101,367 | 81,272 | 2.6% |
| Poland | 55,506 | 55,894 | 57,868 | 83,525 | 79,129 | 2.5% |
| Romania | 67,107 | 63,658 | 56,262 | 65,794 | 66,172 | 2.1% |
| Bulgaria | 62,839 | 54,701 | 53,611 | 53,273 | 52,872 | 1.7% |
| Australia | 35,455 | 38,705 | 44,369 | 49,901 | 46,110 | 1.5% |
| Netherlands | 14,004 | 27,490 | 23,605 | 31,390 | 45,091 | 1.4% |
| Canada | 76,986 | 78,011 | 53,827 | 47,371 | 44,663 | 1.4% |
| Uruguay | 33,317 | 18,298 | 21,624 | 42,089 | 44,134 | 1.4% |
| France | 47,128 | 41,448 | 39,824 | 38,342 | 43,167 | 1.4% |
| Turkey | 30,245 | 33,190 | 32,850 | 35,080 | 39,127 | 1.3% |
| Others | 510,085 | 504,996 | 438,534 | 478,483 | 403,409 | 13.0% |
| Total | 3,015,616 | 2,855,796 | 2,570,092 | 3,029,665 | 3,111,683 | 100.0% |
| Source: Global Trade Tracker (February 2022) | ||||||
4.1.2. Top exporters of honey worldwide – by volume (metric tons)
| 2017 | 2018 | 2019 | 2020 | 2021 | 2021 % Share | |
|---|---|---|---|---|---|---|
| China | 129,274 | 123,478 | 120,845 | 132,469 | 145,886 | 21.1% |
| India | 52,980 | 58,231 | 65,351 | 54,834 | 70,514 | 10.2% |
| Argentina | 70,321 | 70,576 | 65,242 | 71,564 | 65,720 | 9.5% |
| Ukraine | 67,907 | 49,461 | 55,769 | 80,872 | 57,590 | 8.3% |
| Brazil | 27,053 | 28,524 | 30,039 | 45,728 | 47,190 | 6.8% |
| Mexico | 27,723 | 55,674 | 26,901 | 27,485 | 32,082 | 4.6% |
| Germany | 24,433 | 22,788 | 25,320 | 29,742 | 29,342 | 4.3% |
| Spain | 24,833 | 23,090 | 22,528 | 28,263 | 28,442 | 4.1% |
| Poland | 15,843 | 14,705 | 16,837 | 24,691 | 19,277 | 2.8% |
| Belgium | 19,720 | 19,837 | 19,324 | 22,512 | 18,194 | 2.6% |
| Hungary | 22,260 | 20,932 | 19,389 | 19,629 | 15,861 | 2.3% |
| New Zealand | 11,038 | 9,024 | 9,455 | 14,358 | 13,840 | 2.0% |
| Bulgaria | 13,302 | 10,719 | 12,950 | 12,834 | 10,793 | 1.6% |
| Romania | 12,250 | 10,509 | 10,497 | 13,185 | 10,767 | 1.6% |
| Uruguay | 9,186 | 5,803 | 7,904 | 15,778 | 10,600 | 1.5% |
| Thailand | 12,855 | 10,265 | 7,908 | 7,672 | 10,315 | 1.5% |
| Turkey | 6,455 | 6,418 | 5,548 | 6,038 | 9,995 | 1.4% |
| Portugal | 7,161 | 4,840 | 6,112 | 7,442 | 8,557 | 1.2% |
| Italy | 6,765 | 5,335 | 5,458 | 3,731 | 7,584 | 1.1% |
| Canada | 19,196 | 18,587 | 11,847 | 9,309 | 7,341 | 1.1% |
| Others | 84,144 | 84,664 | 78,561 | 90,098 | 70,230 | 10.2% |
| Total | 664,699 | 653,460 | 623,785 | 718,234 | 690,120 | 100.0% |
| Source: Global Trade Tracker (February 2022) | ||||||
4.1.3. Top importers of honey worldwide – by value (thousands of Canadian dollars)
| 2017 | 2018 | 2019 | 2020 | 2021 | 2021 % Share | |
|---|---|---|---|---|---|---|
| United States | 739,697 | 627,684 | 553,350 | 592,344 | 833,597 | 26.1% |
| Germany | 406,723 | 396,781 | 338,773 | 373,687 | 390,897 | 12.2% |
| Japan | 185,433 | 188,619 | 191,607 | 233,619 | 212,746 | 6.7% |
| United Kingdom | 169,545 | 166,461 | 147,531 | 161,610 | 164,218 | 5.1% |
| France | 169,489 | 168,417 | 157,580 | 173,210 | 151,321 | 4.7% |
| China | 118,605 | 91,170 | 112,618 | 119,270 | 132,001 | 4.1% |
| Poland | 75,759 | 81,491 | 84,143 | 105,908 | 114,464 | 3.6% |
| Italy | 106,654 | 130,572 | 105,873 | 108,676 | 111,636 | 3.5% |
| Spain | 100,241 | 88,671 | 77,001 | 88,430 | 104,310 | 3.3% |
| Belgium | 103,308 | 94,871 | 85,369 | 94,106 | 104,136 | 3.3% |
| Saudi Arabia | 86,795 | 99,313 | 99,935 | 140,765 | 100,412 | 3.1% |
| Netherlands | 79,273 | 84,481 | 70,282 | 75,328 | 86,964 | 2.7% |
| Switzerland | 47,447 | 51,507 | 47,995 | 50,582 | 54,432 | 1.7% |
| Canada | 41,284 | 36,787 | 45,403 | 42,576 | 47,479 | 1.5% |
| Australia | 59,244 | 69,352 | 48,783 | 55,041 | 44,955 | 1.4% |
| Indonesia | 7,536 | 10,316 | 16,663 | 35,204 | 40,768 | 1.3% |
| Austria | 39,286 | 37,426 | 33,708 | 33,657 | 32,777 | 1.0% |
| Singapore | 35,631 | 31,198 | 28,550 | 30,993 | 30,947 | 1.0% |
| Denmark | 28,504 | 25,273 | 23,056 | 21,168 | 30,145 | 0.9% |
| Portugal | 22,296 | 20,440 | 20,889 | 22,899 | 26,568 | 0.8% |
| Others | 377,539 | 346,903 | 321,128 | 369,321 | 377,286 | 11.8% |
| Total | 3,000,289 | 2,847,733 | 2,610,237 | 2,928,394 | 3,192,059 | 100.0% |
| Source: Global Trade Tracker (February 2022) | ||||||
4.1.4. Top importers of honey worldwide – by volume (metric tons)
| 2017 | 2018 | 2019 | 2020 | 2021 | 2021 % Share | |
|---|---|---|---|---|---|---|
| United States | 202,565 | 187,588 | 178,948 | 196,531 | 220,231 | 30.2% |
| Germany | 93,070 | 85,980 | 82,203 | 90,136 | 78,580 | 10.8% |
| Japan | 42,821 | 44,521 | 44,788 | 49,348 | 47,112 | 6.5% |
| United Kingdom | 46,092 | 50,590 | 48,830 | 52,655 | 45,852 | 6.3% |
| Poland | 26,449 | 25,726 | 29,802 | 37,343 | 37,594 | 5.2% |
| Spain | 32,251 | 27,920 | 26,547 | 31,690 | 31,628 | 4.3% |
| Belgium | 25,925 | 24,914 | 24,849 | 28,077 | 31,265 | 4.3% |
| France | 35,570 | 32,302 | 32,819 | 34,869 | 29,292 | 4.0% |
| Italy | 23,602 | 27,875 | 23,580 | 21,041 | 21,074 | 2.9% |
| Saudi Arabia | 16,294 | 16,969 | 18,512 | 23,529 | 19,292 | 2.6% |
| Netherlands | 16,341 | 16,846 | 15,115 | 13,584 | 16,313 | 2.2% |
| Portugal | 7,457 | 6,270 | 7,553 | 8,707 | 9,406 | 1.3% |
| Switzerland | 8,192 | 8,229 | 8,240 | 8,192 | 8,229 | 1.1% |
| Canada | 6,650 | 5,207 | 6,513 | 7,144 | 8,200 | 1.1% |
| Australia | 8,621 | 6,873 | 4,784 | 8,010 | 7,921 | 1.1% |
| Greece | 5,747 | 7,617 | 8,576 | 8,596 | 7,822 | 1.1% |
| Indonesia | 1,500 | 2,026 | 3,041 | 6,216 | 7,235 | 1.0% |
| South Africa | 4,206 | 4,407 | 5,261 | 6,003 | 6,868 | 0.9% |
| Austria | 8,140 | 7,081 | 6,619 | 6,899 | 6,212 | 0.9% |
| Czech Republic | 3,178 | 2,706 | 3,057 | 3,584 | 5,638 | 0.8% |
| Others | 79,775 | 68,765 | 68,315 | 80,985 | 83,027 | 11.4% |
| Total | 694,446 | 660,412 | 647,952 | 723,139 | 728,791 | 100.0% |
| Source: Global Trade Tracker (February 2022) | ||||||
4.2 World production
4.2.1. Top producers of honey worldwide[1] – by volume (metric tons)
| 2016 | 2017 | 2018 | 2019 | 2020 | 2020 % Share | |
|---|---|---|---|---|---|---|
| China | 555,000 | 542,544 | 446,879 | 444,054 | 458,100 | 28.2% |
| Turkey | 105,727 | 114,471 | 107,920 | 109,330 | 104,077 | 6.4% |
| Iran | 67,783 | 67,302 | 77,388 | 77,973 | 79,955 | 4.9% |
| Argentina | 68,123 | 76,379 | 79,468 | 78,844 | 74,403 | 4.6% |
| Ukraine | 59,294 | 66,231 | 71,279 | 69,937 | 68,028 | 4.2% |
| United States | 73,429 | 67,596 | 69,857 | 71,179 | 66,948 | 4.1% |
| Russia | 69,764 | 65,167 | 65,006 | 63,526 | 66,368 | 4.1% |
| India | 61,853 | 62,138 | 62,197 | 62,063 | 62,132 | 3.8% |
| Mexico | 55,358 | 51,066 | 64,253 | 61,986 | 54,165 | 3.3% |
| Brazil | 39,677 | 41,696 | 42,268 | 45,801 | 51,508 | 3.2% |
| Canada | 42,900 | 43,550 | 43,089 | 39,295 | 37,601 | 2.3% |
| Tanzania | 30,112 | 30,740 | 30,890 | 31,148 | 31,405 | 1.9% |
| Spain | 31,018 | 29,393 | 36,394 | 31,161 | 30,513 | 1.9% |
| South Korea | 32,328 | 25,866 | 26,414 | 29,744 | 29,375 | 1.8% |
| New Zealand | 19,885 | 14,855 | 20,000 | 23,000 | 27,000 | 1.7% |
| Others | 559,147 | 583,485 | 572,401 | 491,676 | 381,031 | 23.5% |
| Total | 1,871,398 | 1,882,479 | 1,815,703 | 1,730,717 | 1,622,609 | 100.0% |
| Note: 1. FAO production data for the year 2021 was not yet available at the time of writing this report. Source: Food and Agriculture Organization (FAO) of the United Nations | © FAO Statistics Division 2022 |
||||||
Section B: Honey bee pollination
5. Economic contribution of honey bee pollination to Canadian agriculture
5.1. Background
Honey bee pollination is a critical input for many agricultural commodities. An established methodology can be applied to estimate the value of the direct economic contribution to agriculture generated by honey bee pollination.
Honey bees placed near target crops by commercial and hobbyist beekeepers are the most common form of managed pollination, though alfalfa leafcutter bees, bumblebees and some other insect species are used in specific agricultural circumstances. This analysis attempts to exclude the contribution of natural and controlled pollinators other than honey bees. Pollination services for blueberry, cranberry, orchard fruit and canola seed production generate the bulk of the demand for honey bee pollination.
This analysis relies on 2021 Canadian farm gate value or farm cash receipts for key commodities. The estimation uses established coefficients for each crop to determine the proportion of the crop harvest reliant on insect pollination and the proportion of insect pollination that is delivered by honey bees.
5.2. Value of bee pollination by crop
The contribution of honey bee pollination to agricultural production can be estimated using an established formula:
-
V × D × P
where
V = Annual value of crop
D = Dependency of the crop on insect pollinators
P = Proportion of effective insect pollinators of the crop that are honey bees
The estimates used for D and P are those used by Morse and Calderone (2000).
5.3. Estimated contribution of Canadian honey bee pollination to value of key crops in 2021 (thousands of Canadian dollars)
| Crop | D[1] (1 = 100%) |
P[2] (1 = 100%) |
D × P[3] (1 = 100%) |
V[4] (CAN$ '000) |
Value of honey bee pollination D × P × V (CAN$ '000) |
|---|---|---|---|---|---|
| Tree fruits | 386,678 | 315,495 | |||
| Apples | 1 | 0.9 | 0.9 | 242,730 | 218,457 |
| Apricots | 0.7 | 0.8 | 0.56 | 1,950 | 1,092 |
| Sour Cherries | 0.9 | 0.9 | 0.81 | 4,301 | 3,484 |
| Sweet Cherries | 0.9 | 0.9 | 0.81 | 68,593 | 55,560 |
| Nectarines | 0.6 | 0.8 | 0.48 | 7,943 | 3,813 |
| Peaches | 0.6 | 0.8 | 0.48 | 41,411 | 19,877 |
| Pears | 0.7 | 0.9 | 0.63 | 11,203 | 7,058 |
| Prunes/Plums | 0.8 | 0.9 | 0.72 | 8,547 | 6,154 |
| Berries | 806,699 | 427,462 | |||
| Grapes | 0.1 | 0.1 | 0.01 | 202,997 | 2,030 |
| Blueberries | 1 | 0.9 | 0.9 | 311,658 | 280,492 |
| Raspberries | 0.8 | 0.9 | 0.72 | 26,471 | 19,059 |
| Strawberries | 0.2 | 0.1 | 0.02 | 128,562 | 2,571 |
| Cranberries | 1 | 0.9 | 0.9 | 137,011 | 123,310 |
| Cucurbits | 157,832 | 64,730 | |||
| Cucumbers | 0.9 | 0.9 | 0.81 | 46,413 | 37,595 |
| Melons | 0.8 | 0.9 | 0.72 | 27,155 | 19,552 |
| Pumpkins | 0.9 | 0.1 | 0.09 | 33,268 | 2,994 |
| Squash/Zucchini | 0.9 | 0.1 | 0.09 | 50,996 | 4,590 |
| Oilseeds | 15,089,847 | 2,355,169 | |||
| Canola | 0.2 | 0.9 | 0.18 | 12,033,069 | 2,165,952 |
| Sunflower | 1 | 0.9 | 0.9 | 31,710 | 28,539 |
| Mustard Seed | 0.2 | 0.8 | 0.16 | 85,672 | 13,708 |
| Soybeans | 0.1 | 0.5 | 0.05 | 2,939,396 | 146,970 |
| Forage seed | 134,713 | 13,471 | |||
| Alfalfa Seed | 1 | 0.1 | 0.1 | 134,713 | 9,407 |
| Total | 16,575,769 | 3,176,327 | |||
| Notes:
[1] D = Dependency of the crop on insect pollinators. Sources: |
|||||
5.4. Discussion of contribution of honey bee pollination to crop production
Fruits and Vegetables
Insect pollination is critical to the economic performance of key crops in the horticulture (fruit and vegetable) sector. In Table 5.3, the established methodology is used to estimate the contributions of honey bee pollination to the Canadian harvest of major insect-pollinated crops. Apple production in Canada in 2021 generated a total harvest value of $243 million (farm gate value) of which honey bees were responsible for 90% or $218 million. For berries, in the rapidly growing blueberry sector honey bees are responsible for $280 million out of $312 million (90%) in high-bush and low-bush blueberries combined. In total, the 2021 economic contribution of honey bee pollination to production of fruits and vegetables is estimated at $808 million.
Canola
Special consideration of the contribution of honey bees to the production of canola is merited. Most canola planted in Canada today is hybrid seed. The production of hybrid canola seed grown to be subsequently planted by farmers the following season requires precisely timed and thorough insect pollination to bring together the separate genetic lines of the male and female parent plant strains. Since hybrid canola seed is produced primarily with managed pollinators, a portion of the value of this crop can be included as part of the direct agricultural contribution of honey bees through pollination. Most of the hybrid canola seed produced in Canada is subsequently planted in Canada. While commodity canola is primarily wind-pollinated, research indicates that honey bees foraging on canola can add to harvest quantity and quality. Researchers offer a wide range of estimates for the increase in production linked to honey bee foraging depending on plant variety and a number of local conditions, including the abundance of natural pollinators. The highest estimates suggest a gain approaching 20% in additional harvest value, while more modest gains from 2% to 15% have also been reported. Most of the 548,207 hives in the Prairie provinces forage on commodity canola for several weeks in the peak of summer.
Honey bees are estimated to be responsible for about half of the pollination that makes the production of hybrid canola seed possible (with alfalfa leafcutter bees primarily responsible for the other half). One approach to estimating the magnitude of this contribution is to take this share (50%) of the total farm gate value of canola into account as a key economic contribution of honey bees to the total value produced by Canadian agriculture. Total farm cash receipts for producers of canola were $12.0 billion in 2021. If honey bees are credited with making 50% of the production of canola seed possible (for a contributed value $6 billion), in order to avoid double counting, the additional estimated contribution from honey bee pollination to commodity canola from Table 5.3 must be removed from the total contribution. The additional agricultural value of all other crop pollination, less canola, is $1.01 billion, generating a total estimate for the contribution of honey bees of $7 billion.
5.5. Estimated economic contribution of honey bee pollination to crop production
The 2021 total annual economic contribution of honey bee pollination through direct additional harvest value is estimated at $3.18 billion (Table 5.3). Value beyond this is created by the contribution of honey bees to the production of hybrid canola seed was estimated $6 billion per year in 2021. The contribution to canola production combined with other agricultural production which benefits from honey bee pollination suggests the economic harvest value contributed by honey bees could be as high as $7 billion per year.
While a more rigorous and detailed scientific assessment of each commodity in production could produce higher or lower estimates, this analysis shows that the value to agriculture of honey bee pollination is substantially greater than the value of honey and other hive products produced (about $280 million per year). This estimate does not capture the growing contribution of alfalfa leafcutting bees to canola and blueberry production, managed bumble bees, nor the valuable contribution of natural pollinators.
6. Key Resources
- Food and Agriculture Organization of the United Nations, Statistics Division
- Global Trade Tracker
- Morse&Calderone. (March 2020). “The Value of Honey Bees As Pollinators of U.S. Crops in 2000.” Beeculture. https://citeseerx.ist.psu.edu
- Statistics Canada. Table 32-10-0353-01 Production and value of honey
- Statistics Canada. Table 32-10-0054-01 Food available in Canada
- Statistics Canada. CATSNET
Import and export data is based on the following Harmonized System Codes (H.S. Codes):
- Honey for import: 0409000010; 0409000021; 0409000022; 0409000023; 0409000024; 0409000025; 0409000026; 0409000029; 0409000090
- Honey for export: 04090000
- Honey Bees for import: 0106410010; 0106410011; 0106410012; 0106900011; 0106900012
- Queen Bees for imports: 0106410020