
The Agricultural Ammonia Emission to the Atmosphere Indicator (official name: Ammonia Emissions from Agriculture Indicator) estimates ammonia emissions into the atmosphere associated with Canadian agricultural activities from 1981 to 2016. Ammonia is a basic, reactive and toxic trace gas composed of nitrogen and hydrogen that can have negative impacts on the environment and human health. It is released through naturally occurring processes, such as the breakdown of excreted urea (cattle and pigs) or uric acid (poultry) which occurs in animal production facilities and manure application. Ammonia emissions also come from applied nitrogen fertilizers containing ammonium, ammonia or urea.
Overall state and trend
Ammonia emissions to the atmosphere have been generally increasing in Canada as a result of agricultural activities. Since 1981, emissions from nitrogen fertilizer have more than doubled (from 58 kilotonnes of ammonia in 1981 to 143 kilotonnes of ammonia in 2016). Conversely, livestock-related emissions peaked in and have been decreasing since 2006. These trends reflect Canada’s national trend toward more land under annual crops, dynamic animal sectors with decreasing dairy, increasing poultry, fluctuating pigs and regional changes in beef.
Use the interactive map below to zoom in and explore emissions in different regions of Canada. Note that some of the highest emissions per hectare of agricultural land (relating to both livestock and nitrogen fertilizer emissions) occur in southern Ontario and Quebec due to both high livestock density and fertilizer rates. The high human population density in these regions increases the potential impact on human health. Other areas of relatively high emissions include regions of the Prairies that receive a greater amount of precipitation and the Lower Fraser Valley region of British Columbia.
Since 1981, there has been an increase in ammonia emissions across the Prairies. Eastern Canada shows a gradually declining trend in emissions over the same time period. The total national emissions rose from 329 kilotonnes of ammonia in 1981, to 389 kilotonnes in 2006, falling in 2011, before increasing to 396 kilotonnes in 2016. These trends can also be seen in Figure 2 and are described in more detail in the specific trends section. The decline in 2011 was due mainly to the temporary reduction of beef cattle numbers associated with the bovine spongiform encephalopathy (BSE) outbreak.
| Very low | Low | Moderate | High | Very high |
The interactive map in Figure 2 shows the change in ammonia emissions between 1981 and 2016. It is apparent that emissions are increasing in the Prairies and declining in Ontario, Quebec and the Atlantic Provinces.
| Large decrease | Moderate decrease | Little or no change | Moderate increase | Large increase |
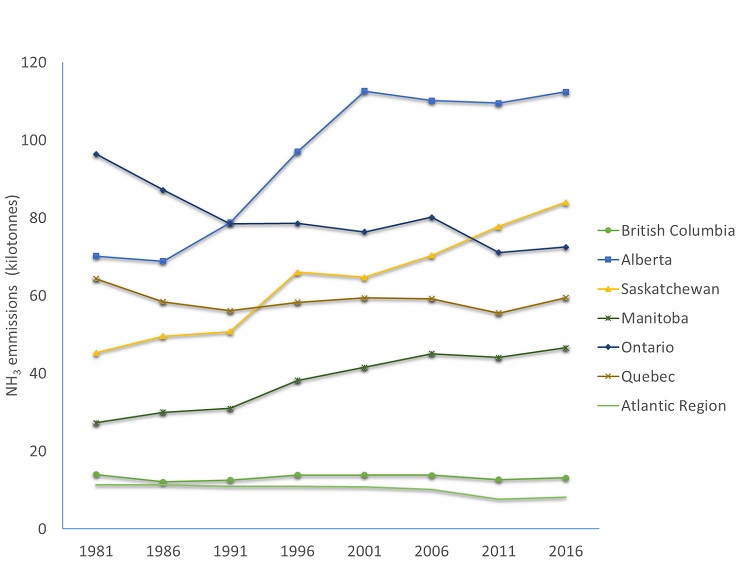
These emissions trends can also be seen in the graph below, which reports in actual emissions, measured in kilotonnes per year. The graph shows reductions in total emissions for Ontario, Quebec, British Columbia and the Atlantic region and an increase in total emissions for Manitoba, Saskatchewan and Alberta.
Description - Figure 3
| 1981 | 1986 | 1991 | 1996 | 2001 | 2006 | 2011 | 2016 | |
|---|---|---|---|---|---|---|---|---|
| British Columbia | 14.0 | 12.1 | 12.6 | 13.9 | 13.9 | 13.8 | 12.7 | 13.2 |
| Alberta | 70.2 | 68.9 | 78.8 | 97.0 | 112.6 | 110.2 | 109.5 | 112.4 |
| Saskatchewan | 45.3 | 49.6 | 50.8 | 66.0 | 64.7 | 70.3 | 77.8 | 84.0 |
| Manitoba | 27.3 | 30.0 | 31.0 | 38.2 | 41.6 | 45.1 | 44.1 | 46.6 |
| Ontario | 96.4 | 87.2 | 78.5 | 78.6 | 76.4 | 80.2 | 71.1 | 72.5 |
| Quebec | 64.4 | 58.4 | 56.1 | 58.3 | 59.4 | 59.2 | 55.5 | 59.5 |
| Atlantic Region | 11.4 | 11.3 | 10.9 | 11.0 | 10.8 | 10.2 | 7.7 | 8.2 |
Agricultural Ammonia Emissions performance index
The state and trend of agricultural ammonia emissions can also be seen in the performance index below.

Description - Figure 4
| Year | Index Value |
|---|---|
| 1981 | 60 |
| 1986 | 63 |
| 1991 | 65 |
| 1996 | 64 |
| 2001 | 62 |
| 2006 | 62 |
| 2011 | 65 |
| 2016 | 63 |
Figure 4 depicts a general assessment of the status of Canadian ammonia emissions across the national landscape. The multifactor index shows no overall trend after 1986 which reflects a lack of consistent increase or decrease in emissions and no clear shift toward concentrating or dispersing emission sources (despite clear regional differences). The lack of a trend in the ammonia performance index is in contrast with other critical air contaminants which have all been declining. However, this is similar to what is observed in many industrialized countries, so the performance could be seen as expected but needing improvement. A future index will take human and natural plant exposure to ammonia into account.
Specific trends
- Trend 1: Increased ammonia emissions from nitrogen fertilizer in the Prairies
- Trend 2: Lower emissions from livestock
The following is a list of noteworthy trends for atmospheric agricultural ammonia emission in Canada.
Trend 1 – Increased ammonia emissions from nitrogen fertilizer in the Prairies
Ammonia emissions result from application of nitrogen fertilizer and livestock manures from all stages of production and handling (housing, storages, land spreading and grazing). The map in Figure 5 shows the changes in ammonia emissions from nitrogen fertilizers on the Prairies, between 1981 findings (left) and 2016 findings (right). This region has seen significant increases in ammonia emissions from nitrogen fertilizer over the past 35 years, but the per hectare rates remain relatively low.
| Very low | Low | Moderate | High | Very high |
Reasons for this trend 1
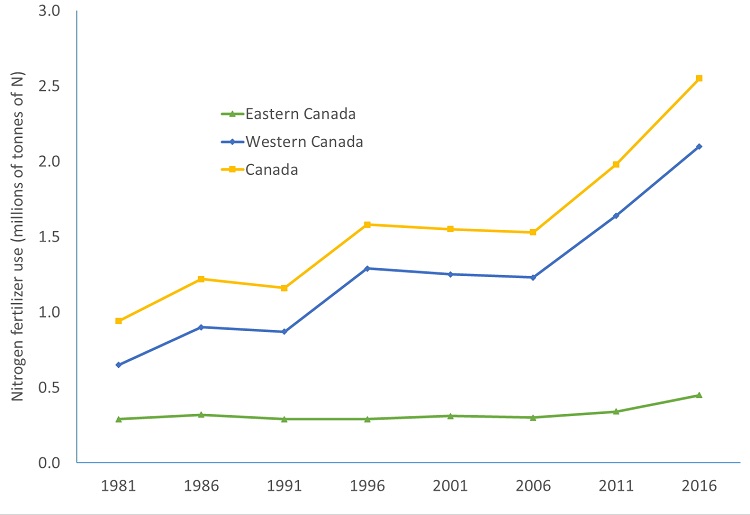
The primary reason for the increase in ammonia emissions from fertilizer is the increase in nitrogen application. In 2016, emissions from nitrogen fertilizers accounted for 36% of the total ammonia emissions, an increase from 23% in 2006. This increase has been caused by a reduction in the area of summerfallow and an increase in the rate of fertilizer application. Further, since 2006, the presence of smaller beef herds has resulted in a shift from perennial to annual cropping, which requires more inputs. The graph below (Figure 6) contrasts trends in consumption of nitrogen fertilizer in Western (MB, SK, AB and BC) and Eastern (ON, QC, NB, NS, PE) Canada and helps explain the increase in ammonia emissions. In 1981, national usage was about 0.94 million tonnes of nitrogen, which more than doubled to 2.5 million tonnes in 2016. Consumption in Western Canada has more than doubled, whereas consumption in Eastern Canada has increased by 42%.
Description - Figure 6
| Region | 1981 | 1986 | 1991 | 1996 | 2001 | 2006 | 2011 | 2016 |
|---|---|---|---|---|---|---|---|---|
| Eastern Canada | 0.29 | 0.32 | 0.29 | 0.29 | 0.31 | 0.30 | 0.34 | 0.45 |
| Western Canada | 0.65 | 0.90 | 0.87 | 1.29 | 1.25 | 1.23 | 1.64 | 2.10 |
| Canada | 0.94 | 1.22 | 1.16 | 1.58 | 1.55 | 1.53 | 1.98 | 2.55 |
Trend 2 – Lower emissions from livestock
The map in Figure 7 shows ammonia emissions from livestock production. Livestock emissions decreased by 15% from 2006 to 2016, with the largest declines occurring in the Prairie Provinces.
| Very low | Low | Moderate | High | Very high |
Reason for this trend 2
The decline in livestock emissions is due, in part, to the decline in Canada's beef cattle herd following the 2003 BSE outbreak. This, and other factors, has resulted in a reduction in the beef herd of about 3 million head, equaling a 22% decline since 2006. The long breeding cycle of cattle means that it has taken many years for the population to recover. Although the swine population is now increasing, there has also been a loss of about 2 million swine during this period due to challenging market conditions for producers. Further, the dairy herd size has experienced a gradual decline as the rate of milk production per cow increased. The only livestock sector that has seen an increase in emissions is poultry, as producers have increased production to meet increased demand.
These trends can also be seen in the graph below (Figure 8), which shows a decline in livestock-related emissions and a concurrent increase in nitrogen fertilizer-based emissions.

Description - Figure 8
| Livestock | Fertilizer | |
|---|---|---|
| 1981 | 271 | 58 |
| 1986 | 241 | 76 |
| 1991 | 245 | 74 |
| 1996 | 272 | 91 |
| 2001 | 288 | 91 |
| 2006 | 298 | 91 |
| 2011 | 258 | 121 |
| 2016 | 253 | 143 |
Why this indicator matters
Ammonia is a water-soluble basic (high pH) gas which readily reacts with several acid gases (SOx, NOx CL- and organic acids) in the atmosphere, generating ammonium compounds in the form of fine (secondary) particulate matter (PM2.5) which can contribute to smog, low visibility and compromised human health through cardiovascular and other diseases, and may shorten life spans. Further, gaseous ammonia can be toxic to some vegetation like lichens and mosses, and deposition of ammonia in nutrient poor ecosystems (e.g. bogs and alpine environments) can result in a loss of species.
The agricultural sector in Canada contributes the majority (93%) of the total anthropogenic ammonia emissions and hence secondary ammonium-based particles, especially in areas near large urban centres where ammonia reacts with acid pollutant gases from industry and transport such as NOx, SOx and others. Smog events can reduce visibility and have a negative impact on scenic tourism such as in the lower Fraser Valley of BC. Ammonium that is bound to particles or aerosols can travel long distances, crossing political boundaries which makes it challenging to regulate. In the soil, ammonia is rapidly transformed (oxidized) into nitrate; and subsequently nitrate to dinitrogen gas (denitrification) which gives rise to the greenhouse gas nitrous oxide.
Another important impact of ammonia emissions is direct loss of fertilizer quality nitrogen from agriculture, an essential and expensive crop nutrient, from agricultural operations and this loss must be replaced with de novo industrial or biologically fixed N. The loss of 396 kilotonnes of ammonia from farms in 2016 is equivalent to approximately 13% of all fertilizer nitrogen applied to crops, which represents an economic cost of $400 to $800 million in one year.
Farmers can mitigate ammonia emissions by implementing a range of proven measures at all stages of animal production and nitrogen fertilizer spreading.
Beneficial management practices
Practices to reduce ammonia emissions focus on reducing emissions from nitrogen fertilizer application and from livestock production. Some ammonia is lost from nitrogen fertilizer manufacturing but this is considered an industrial, not agricultural loss. Nutrient management strategies can help to reduce nitrogen fertilizer use and hence emissions, as well as emissions from application of manure, by only applying what crops need to grow. Livestock producers generally apply all the manure produced on their operation. Incorporating the fertilizer or manure rapidly into the soil through techniques such as side-banding, injection or rapid tillage greatly lowers the amount of ammonia emitted to the atmosphere.
As urinary nitrogen is the primary source of ammonia emissions from livestock, emissions can be reduced by limiting excess feed protein especially through staged or group feeding. Losses from housing can be reduced by adding chemicals to bedding (e.g. acidifying agents) and using barn designs that segregate feces from urine so that the urinary nitrogen remains as urea longer before hydrolyzing to ammonia and carbon dioxide. In ventilated barns, ammonia can be trapped with air scrubbers. In manure storages, ammonia loss may be reduced using floating covers or by naturally forming crusts, and low winter temperatures also mitigate emissions. Grazing reduces ammonia emissions since the urine infiltrates into the soil before hydrolysis; winter feeding of cattle on pastureland rather than in wintering feedlots also helps reduce emissions from cow-calf and stocker beef livestock operations.
About the performance indices
The agri-environmental performance index shows environmental performance state and trends over time, based on weighting the percentage of agricultural land in each indicator class, such that the index ranges from 0 (all land in the most undesirable category) to 100 (all land in the most desirable category). An index value that is increasing over time suggests improving environmental performance, while a decreasing index value suggests deteriorating environmental performance over time.
Related indicators
- The Particulate Matter Indicator estimates the contribution of primary particulate matter from agriculture into the atmosphere.
- The Agricultural Greenhouse Gas Indicator tracks the greenhouse gas emissions (carbon dioxide, methane and nitrous oxide) associated with Canadian agricultural activities.
- The Residual Soil Nitrogen Indicator estimates how efficiently nitrogen is used by crops and the amount of surplus nitrogen in agricultural soils.
Additional resources and downloads
- Discover and download geospatial data related to this and other indicators.