
The Nitrogen Indicator (official name: Indicator of the Risk of Water Contamination by Nitrogen) evaluates the risk of water contamination by nitrogen across agricultural areas in Canada. This indicator uses the Residual Soil Nitrogen Indicator, which calculates the amount of nitrogen left in the soil after harvest; as well as subsequent climatic factors to determine the risk of nitrogen reaching surface and ground water. It is important to note that the indicator examines risk of nitrate leaching—that is soluble nitrogen that has passed through the soil profile into ground water or into tile drainage water—rather than losses of nitrogen in surface runoff, which are considered to be minor. The indicator has tracked nitrogen risk associated with Canadian agricultural activities from 1981 to 2016.
Overall state and trend
In 1981, 80% of the farmland in Canada was in the very low risk category for the Indicator of Water Contamination by Nitrogen (IROWC-N). However, in 2016 only 49% of farmland was in the very low risk category, whereas 25% was in the low risk, 10% in the moderate risk and 16% in the high and very high risk categories. Over the past 36 years, the risk of annual nitrogen loss through leaching (percolating into the soil) has increased by 51% (from 4.3 kg N ha-1 to 6.5 kg N ha-1) and the nitrogen concentration in leached water has increased threefold from 3.2 to 9.7 mg N L-1.
The Residual Soil Nitrogen Indicator
The Residual Soil Nitrogen Indicator estimates how efficiently nitrogen is used in soils. It is estimated as the difference between total nitrogen inputs to agricultural soils (fertilizer and manure, fixation by leguminous plants, wet and dry atmospheric deposition) and total nitrogen outputs, which consist of harvested crops and gaseous losses, including ammonia and nitrous oxide. Surplus nitrogen, mostly in the form of water-soluble nitrate, may remain in the soil over the winter and be used by the next crop. Alternatively, it may be lost to the environment by leaching—a process in which water percolates through the soil, carrying nitrates into ground water or into drainage water from tile-drained fields. These nitrogen leaching losses are not included in the Residual Soil Nitrogen Indicator as the majority of these losses occur in the period between growing seasons. For these reasons, the Indicator of the Risk of Water Contamination by Nitrogen has been developed to estimate the leaching losses of nitrate from agricultural soils.
Current status of the Residual Soil Nitrogen Indicator
Residual soil nitrogen levels on farmland in Canada were in the ‘Desired’ risk class in 1981, but decreased to the “Good” risk class in 2016 (see performance index below) as a result of increases in nitrogen inputs such as fertilizer, particularly since the mid-1990s. However, the outputs did not increase to the same extent as the inputs.
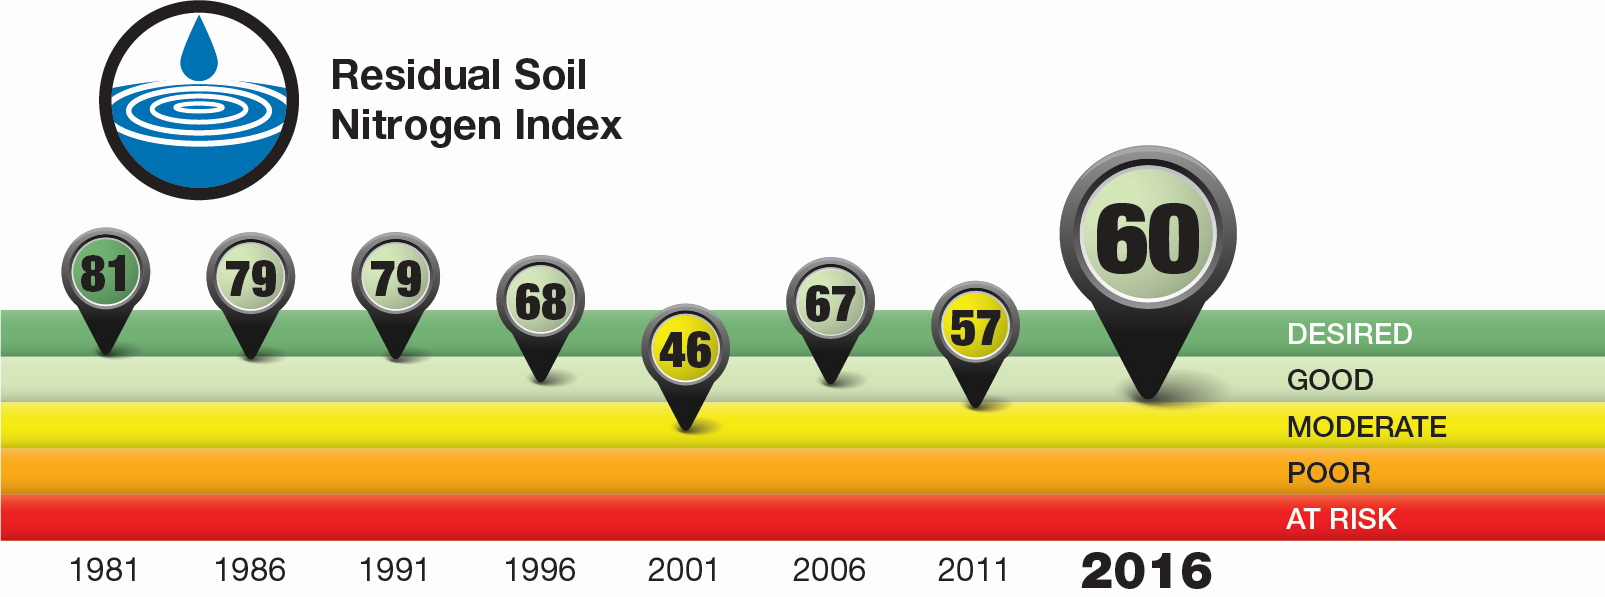
Description - Figure 1
| Year | Index Value |
|---|---|
| 1981 | 81 |
| 1986 | 79 |
| 1991 | 79 |
| 1996 | 68 |
| 2001 | 46 |
| 2006 | 67 |
| 2011 | 57 |
| 2016 | 60 |
The performance index tends to aggregate and generalize trends and so should be viewed as a policy tool to give a general overview of state and trend over time.
More results and information on the Residual Soil Nitrogen Indicator can be found in the publication entitled Environmental Sustainability of Canadian Agriculture, Agri-Environmental Indicator Report Series - Report #4 .
Use the interactive map below to zoom in and explore different regions. Although 80% of agricultural land in Canada was in the very low class in 1981, only 49% of the land was in the very low class in 2016 (Table 4). Note, however, that 55% and 64% of the agricultural land in Saskatchewan and Alberta, respectively, were in the very low risk class in 2016. This is owing to the lower amount of precipitation in these provinces, leading to a lower risk of drainage from agricultural soils. Higher risk classes can be observed in Central and Atlantic Canada, where precipitation rates are higher. Risk is also closely tied to nitrogen inputs and RSN levels, which have steadily increased over 35 years (Fig. 5).
From 1981 to 2016 there has been a steady increase in risk in many regions of Canada, particularly in the Maritimes and in parts of Quebec, Manitoba, central British Columbia, and northern areas of Saskatchewan and Alberta.
| Very Low | Low | Moderate | High | Very High |
You can also explore the change in water contamination risk from nitrogen in the interactive map in Figure 3. This map uses a colour scheme to illustrate negative changes (browns) and positive changes (greens) between 1981 and 2016. It is apparent that the increase in risk is occurring across Canada, but is particularly evident in parts of Manitoba and the Maritimes.
| Two or more class decreased risk | One class decreased risk | No change | One class increased risk | Two or more class increased risk |
Nitrogen performance index
The state and trend of the Nitrogen Indicator can also be seen in the performance index below.
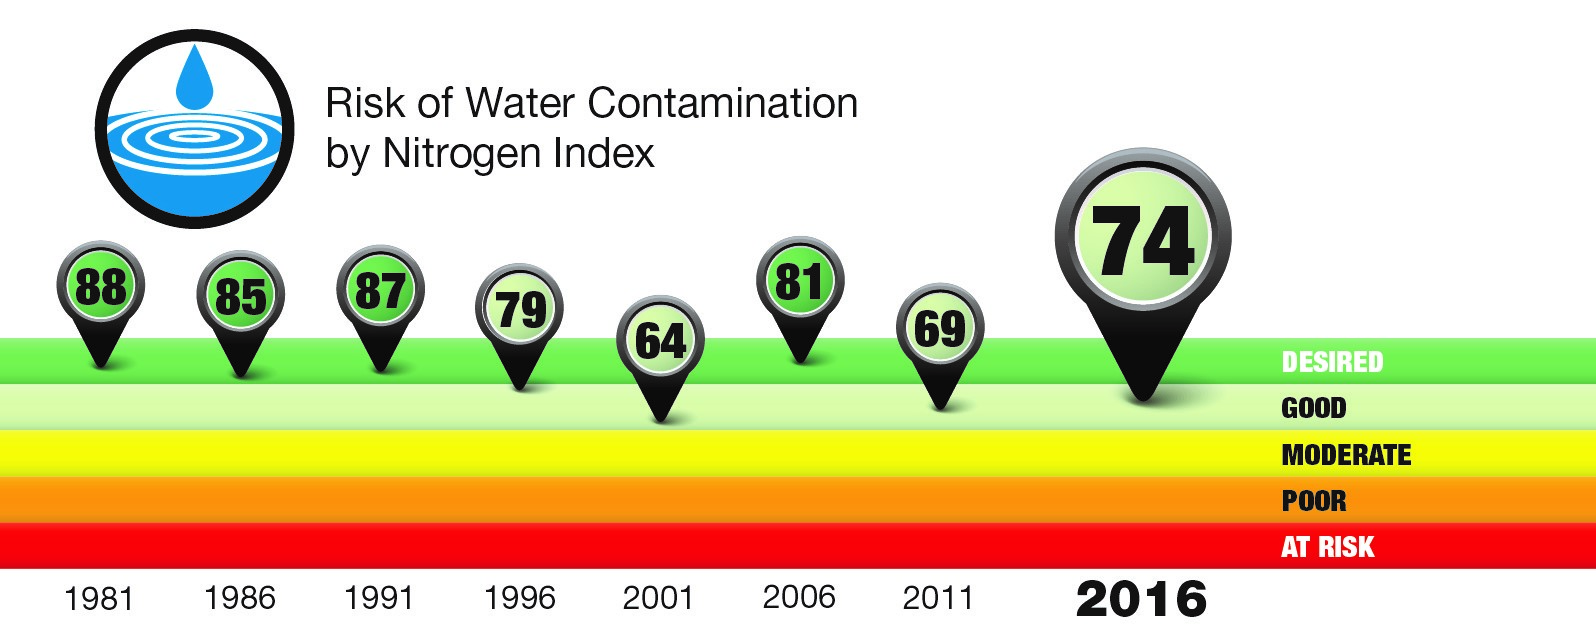
Description - Figure 4
| Year | Index Value |
|---|---|
| 1981 | 88 |
| 1986 | 85 |
| 1991 | 87 |
| 1996 | 79 |
| 2001 | 64 |
| 2006 | 81 |
| 2011 | 69 |
| 2016 | 74 |
As illustrated by the performance index above, in 2001, 2011, and 2016 the risk of water contamination by nitrogen on farmland in Canada was higher than in the 1981-to-1996 period, and has decreased from the ‘Desired’ to the ‘Good’ category with values from 64 to 74. The index illustrates a fairly stable, yet slightly declining, trend from a high index value of 88 in 1981 to 64 in 2001, although there was a modest increase by 2016 to a value of 74. While this indicator has remained in the “Good” class in 2016, more and more farmland has been moving from lower risk categories to higher risk categories, and some pockets of farmland are now in the high risk and very high risk classes.
The index tends to aggregate and generalize trends and so should be viewed as a policy tool to give a general overview of state and trend over time.
Specific trends
Nitrogen build-up in soils across Canada increases risk to ground water
Nitrogen is applied to crops most often during or shortly after planting, although crop nitrogen requirements are highest during the later stages of plant development—often weeks after application. Once the growing season is over, any unused nitrogen remains in the soil as residual soil nitrogen until it is removed from the soil via drainage water following precipitation, lost from denitrification or it remains in the soil and is used by the next year's crop.
Figure 5 (below) shows the nitrogen inputs and outputs as well as residual soil nitrogen levels from 1981 to 2016. On a national basis, average nitrogen inputs have almost doubled over the past 36 years (from 55.3 kilograms per hectare in 1981 to 103.2 kilograms per hectare in 2016), whereas average nitrogen outputs increased by 72% (from 47.9 kilograms per hectare in 1981 to 82.3 kilograms per hectare in 2016) over the same time period. The greater increase in nitrogen inputs compared to outputs over time has resulted in an increase of residual soil nitrogen values by almost threefold (from 7.4 kilograms of nitrogen per hectare in 1981 to 21.0 kilograms per hectare in 2016). The residual soil nitrogen value of 32.7 kilograms per hectare calculated for 2001 was primarily attributable to the low level of nitrogen outputs that year caused by the reduction in yields and crop nitrogen uptake associated with droughts in many regions in Canada. Because uptake and removal of nitrogen by crops accounts for 95% of the Canadian nitrogen output during the growing season, any variations in yield can dramatically affect the amount of nitrogen left in the soil. The elevated levels of residual nitrogen in agricultural soils has increased the likelihood of higher concentrations of nitrates in drainage water and consequently increased the risk of water contamination in many parts of the country.
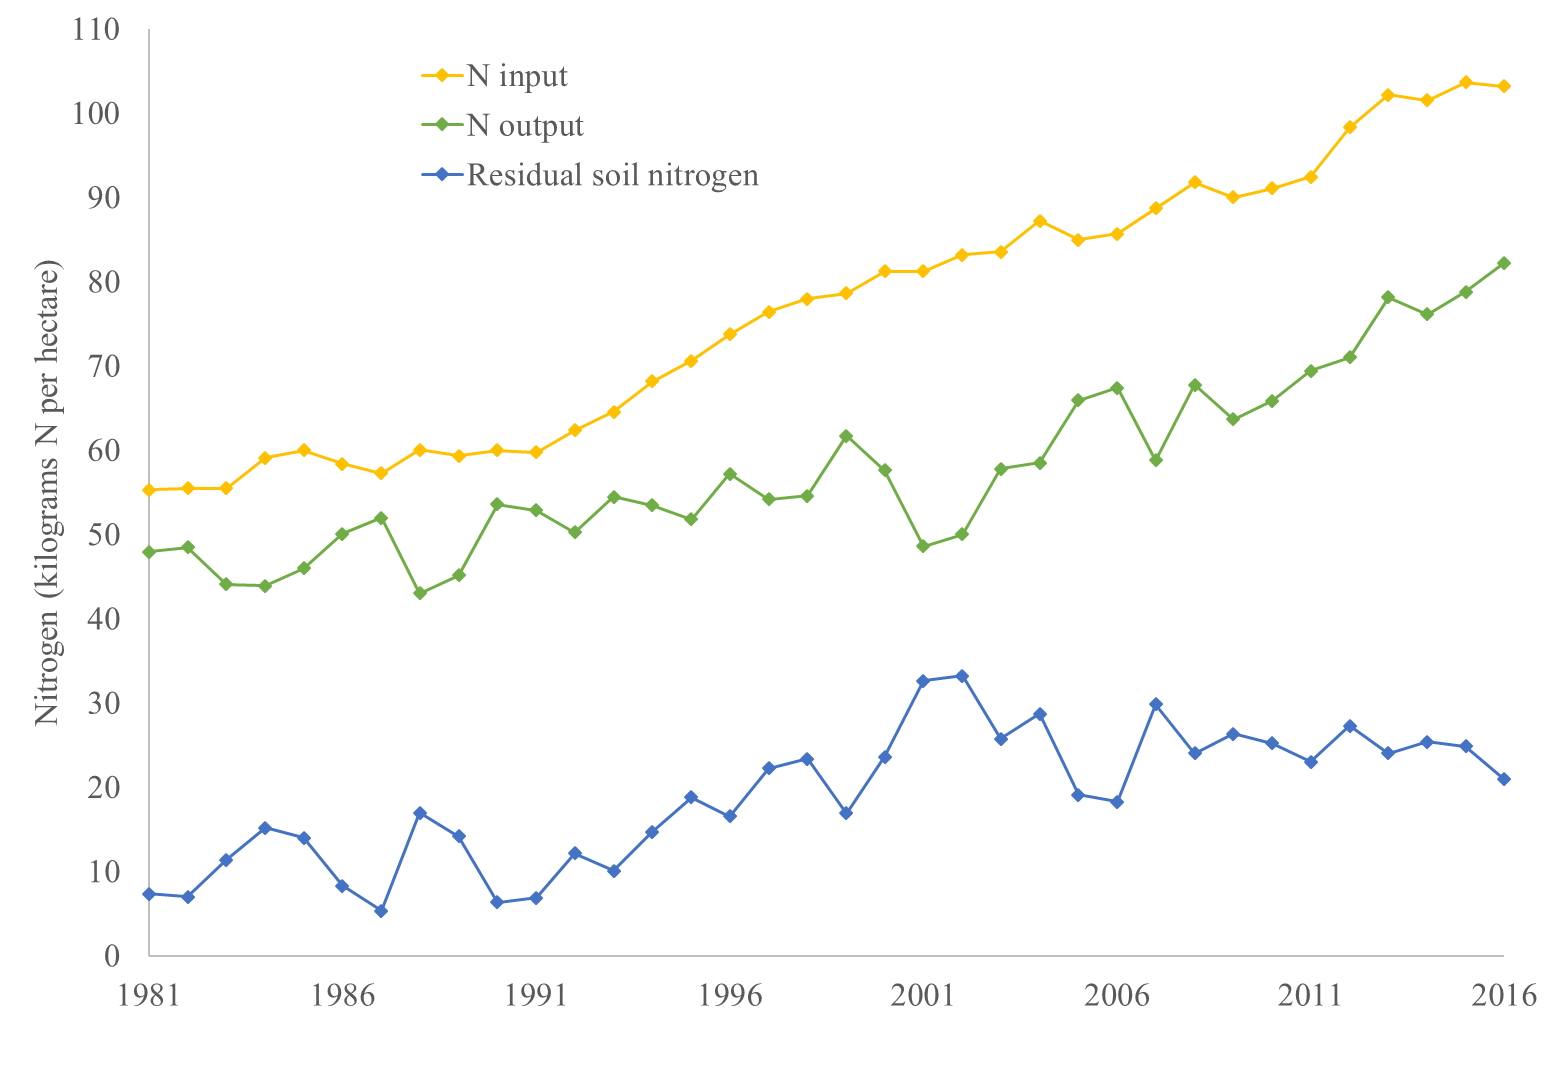
Description - Figure 5
| Year | N input | N output | Residual soil nitrogen |
|---|---|---|---|
| 1981 | 55.3 | 47.9 | 7.37 |
| 1982 | 55.5 | 48.5 | 6.99 |
| 1983 | 55.5 | 44.1 | 11.4 |
| 1984 | 59.1 | 43.9 | 15.2 |
| 1985 | 60.0 | 46.0 | 14.0 |
| 1986 | 58.4 | 50.1 | 8.28 |
| 1987 | 57.3 | 52.0 | 5.32 |
| 1988 | 60.0 | 43.0 | 17.0 |
| 1989 | 59.3 | 45.2 | 14.2 |
| 1990 | 60.0 | 53.6 | 6.37 |
| 1991 | 59.7 | 52.9 | 6.90 |
| 1992 | 62.4 | 50.2 | 12.1 |
| 1993 | 64.6 | 54.5 | 10.1 |
| 1994 | 68.2 | 53.5 | 14.7 |
| 1995 | 70.6 | 51.8 | 18.8 |
| 1996 | 73.8 | 57.2 | 16.5 |
| 1997 | 76.4 | 54.2 | 22.3 |
| 1998 | 77.9 | 54.6 | 23.4 |
| 1999 | 78.6 | 61.7 | 16.9 |
| 2000 | 81.2 | 57.6 | 23.6 |
| 2001 | 81.3 | 48.6 | 32.7 |
| 2002 | 83.2 | 50.0 | 33.2 |
| 2003 | 83.5 | 57.8 | 25.8 |
| 2004 | 87.2 | 58.5 | 28.7 |
| 2005 | 85.0 | 65.9 | 19.1 |
| 2006 | 85.7 | 67.4 | 18.3 |
| 2007 | 88.7 | 58.8 | 29.9 |
| 2008 | 91.8 | 67.8 | 24.0 |
| 2009 | 90.0 | 63.7 | 26.4 |
| 2010 | 91.1 | 65.9 | 25.2 |
| 2011 | 92.5 | 69.4 | 23.0 |
| 2012 | 98.3 | 71.0 | 27.3 |
| 2013 | 102 | 78.2 | 24.0 |
| 2014 | 102 | 76.1 | 25.4 |
| 2015 | 104 | 78.8 | 24.9 |
| 2016 | 103 | 82.3 | 21.0 |
Why this indicator matters
Nitrogen is an essential nutrient for all plants and animals. It is applied to soils in the form of fertilizers and manures in order to maintain crop yields or fixed in the nodules of legume crops. Incomplete nitrogen uptake by crops inevitably results in some inorganic nitrogen remaining in the soil at the end of the growing season (see Residual Soil Nitrogen). The environmental risk is greater when large surpluses of nitrogen are present in the soil in regions that receive considerable precipitation. Most of the residual inorganic nitrogen, which is in the form of nitrate, is water soluble and can readily leach through the soil into ground water or can move from tile drains into ditches, streams and lakes. High nitrate levels in surface waters contribute to algae growth and eutrophication. High levels (≥10 mg N L-1) in ground water that is used for drinking water (that is, from wells or aquifers) have been linked to human health impacts.
Agriculture has the potential to mitigate risk from nitrogen by implementing beneficial management practices (BMPs) that enhance crop N uptake and reduce N losses from soils and therefore prevent nitrates from reaching water bodies.
Beneficial management practices
Strategies for reducing the risk of water contamination by nitrogen include managing nitrogen inputs (for example, enhanced efficiency fertilizers), adjusting N application rates (nitrate soil tests and/or accounting for previous inputs), improving N application methods and timing to avoid N losses from the soil.
Split application of nitrogen—whereby producers make two or more fertilizer applications during the growing season rather than providing all of the crop’s nitrogen requirements with a single treatment prior to, or at, planting—is a method that can be used to reduce N losses from the soils via leaching or denitrification and during the growing season. For example, side-dressing is a practice used by many producers to apply nitrogen when the crop is already emerged (for example, 5-6 leaf stage for corn) to ensure the nitrogen is available when the crop needs it. Applying fertilizer as close as possible to the period of rapid crop uptake will minimize nitrogen losses from the field and will ensure adequate nitrogen availability to the crop during critical growth periods. Analyses of plant nitrogen status can also help producers choose more economical application rates. Using a urease to slow urea hydrolysis (urease inhibitor) and a nitrification inhibitor to slow the conversion of ammonium to nitrate is an option that can reduce ammonia volatilization and nitrous oxide losses and improve nitrogen uptake by crops. Non-leguminous cover crops growing in the fall and early spring may also provide a solution as they can capture residual nitrogen from the soil, convert it to organic nitrogen in their tissues and then make it available to the next crop as their tissues decompose over the following spring and summer.
Management practices that enhance soil quality (for example, those practices that increase soil organic matter levels and improve soil structure) can be implemented to increase the water holding capacity of the soil and allow excess water to drain from fields during high rainfall events.
Lastly, a number of end-of-pipe solutions are available for producers to control or mitigate the surface water impacts of nitrate leaching from tile-drained fields. These include controlled tile drainage systems to manage the water table and retain the nitrate in the fields, where it can be used by growing crops; constructed or natural wetlands to trap nitrates, and reactive biofilters to reduce the amount of nitrate in drainage before it gets to local surface waters. Some of these methods may enhance denitrification losses from soils, and could result in pollution-swapping trade-offs (for example, nitrous oxide emissions or phosphorus losses in surface runoff); and as well tend to have much higher installation and operating expenses, therefore reducing nitrogen inputs via nutrient management is the desired practice.
About the performance indices
The agri-environmental performance index shows environmental performance state and trends over time, based on weighting the percentage of agricultural land in each indicator class, such that the index ranges from 0 (all land in the most undesirable category) to 100 (all land in the most desirable category). An index value that is increasing over time suggests improving environmental performance, while a decreasing index value suggests deteriorating environmental performance over time.
Related indicators
- The Phosphorus Indicator tracks the risk of water contamination from phosphorus.
- The Coliforms Indicator calculates the risk of water contamination from agricultural coliforms.
- The Pesticide Indicator examines risk to water from pesticides.
- The Soil Organic Matter Indicator tracks the health of Canadian Agricultural Soils as it relates to soil carbon content and soil carbon exchange.
Additional resources and downloads
- For detailed information on this indicator please see the publication entitled Environmental Sustainability of Canadian Agriculture, Agri-Environmental Indicator Report Series - Report #5.
- Discover and download geospatial data related to this and other indicators.