
Authors: D.K. Reid, D. Lapen, T. Martin, T. Rounce, T. Jamieson
Status: National coverage, 1981 to 2016
Summary
Animal manure is an important and valuable fertilizer source. However, animal manure may also be a potential source of pathogens (that is, viruses, bacteria and protozoa). Inappropriate use of manure as a fertilizer, or inappropriate management of grazing livestock, can heighten the risk of pathogen contamination in water. Thermotolerant coliform bacteria levels are often used as an indicator of fecal contamination in water.
The indicator of the Risk of Water Contamination by Coliforms (IROWC-Coliform) was created to assess the risk of surface water contamination by enteric microorganisms from agricultural sources. The IROWC-Coliform indicator has two major components: one that quantifies the source of fecal material and the coliform bacteria coming from it, and the other describes transport processes and connectivity between agricultural land and waterbodies.
The risk of pathogen contamination from manure varies widely across Canada. In both Eastern and Western Canada the largest source of thermotolerant coliform bacteria is usually associated with higher density livestock farming practices, although the timing and densities of fecal indicators in water vary with climate and physiographic conditions. In the Prairies, runoff from pastures during the spring thaw period accounts for almost 90% of the risk to water. In Eastern Canada, runoff occurs over a much larger portion of the year, and a greater proportion of bacteria come from manure spread from confined livestock operations. This increases the annual water risk in Eastern Canada, relative to the source loads. The risk in an individual year is highly sensitive to weather conditions during the spreading and grazing periods.
Overall, in 2016 a few areas with high and very high coliform loads were found in British Columbia, Alberta, Manitoba and Nova Scotia. Very high or high risk to waterbodies occurred in those provinces as well as in Ontario and Quebec. Most agricultural areas in Canada were at very low to moderate risk levels.
Description of image above
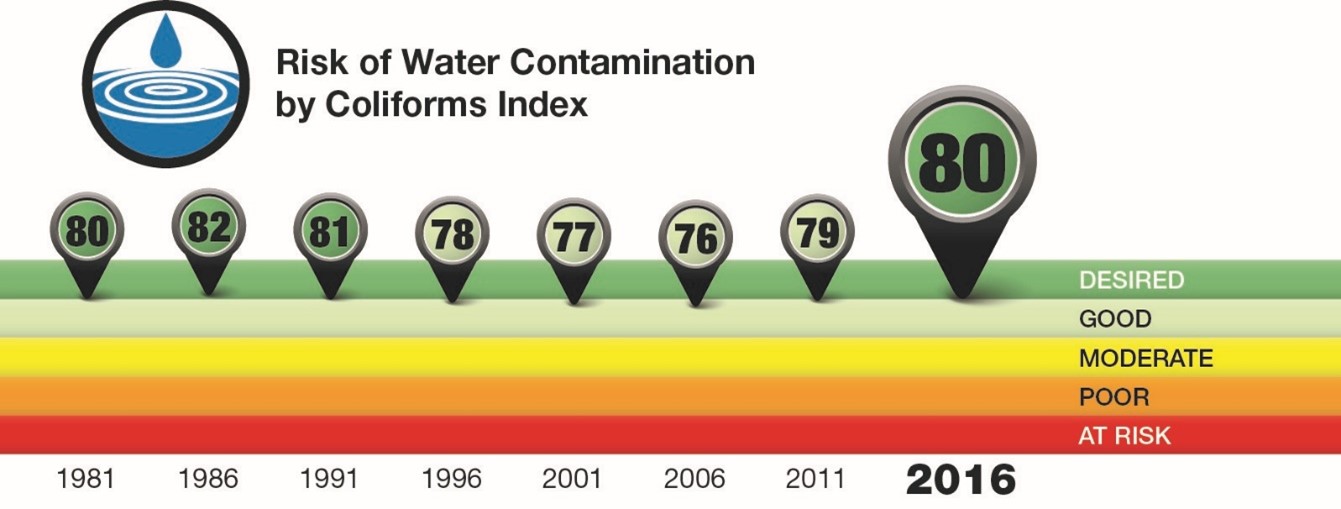
The Risk of Water Contamination by Coliforms Index covers the years 1981 to 2016 in five-year increments. The index value ranges from 0 to 100 in twenty-point increments with each increment assigned a qualitative rating: 0-19 is At risk; 20-39 is Poor; 40-59 is Moderate; 60-79 is Good; 80-100 is Desired.
| Year | Index Value | Index rating |
|---|---|---|
| 1981 | 80 | Desired |
| 1986 | 82 | Desired |
| 1991 | 81 | Desired |
| 1996 | 78 | Good |
| 2001 | 77 | Good |
| 2006 | 76 | Good |
| 2011 | 79 | Good |
| 2016 | 80 | Desired |
The issue and why it matters
Thermotolerant coliform bacteria are universally found in animal feces, and their presence in waterbodies is monitored as an indication of water contamination by fecal material. Some of the consequences of water contamination by coliforms include increased cost for water treatment, loss of use of recreational waters, constraints to the expansion of the livestock industry and potential for human health effects. In mixed watersheds, sources of surface water contamination are often numerous and can include municipal wastewater discharge, leaking septic systems, wildlife and livestock operations.
Livestock manure is commonly used in agriculture as a valuable source of nutrients for crop growth, but one that is relatively expensive to store and transport. Bacteria make up a large part of all types of manure, but the microbial composition of manure varies widely with the type of livestock (for example poultry, swine and cattle), storage, treatment, and herd health. The use of animal manure as crop fertilizer may pose risks to environmental and human health when pathogens from the manure contaminate nearby surface water or shallow groundwater. The risk of contamination of surface water by coliforms is likely highest in areas associated with relatively higher manure production, dense water drainage networks, high susceptibility to surface runoff, preferential flow and soil erosion. Risk of groundwater contamination is increased in areas with shallow groundwater or shallow soils over fractured bedrock.
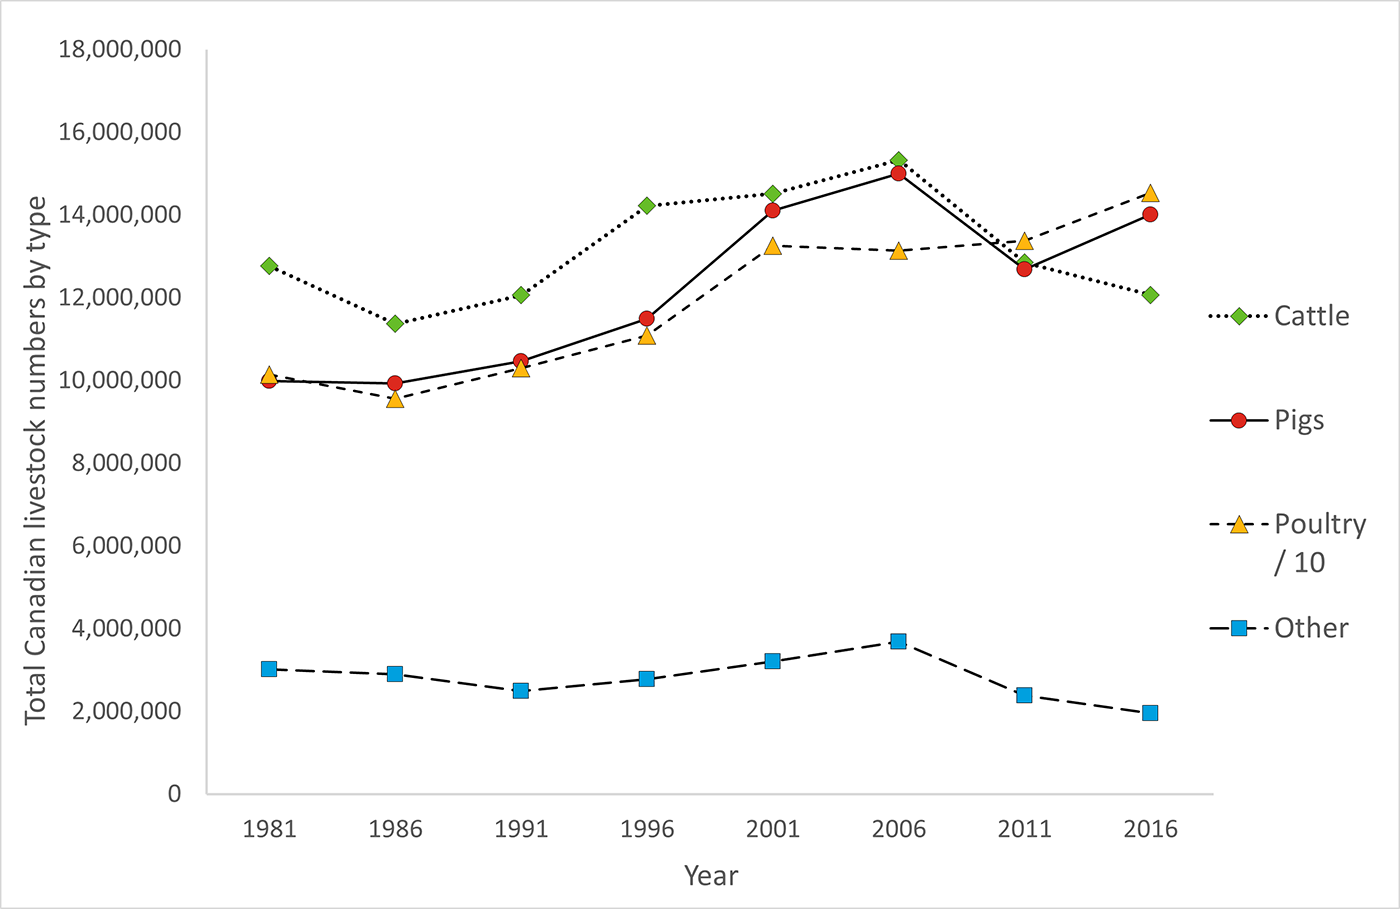
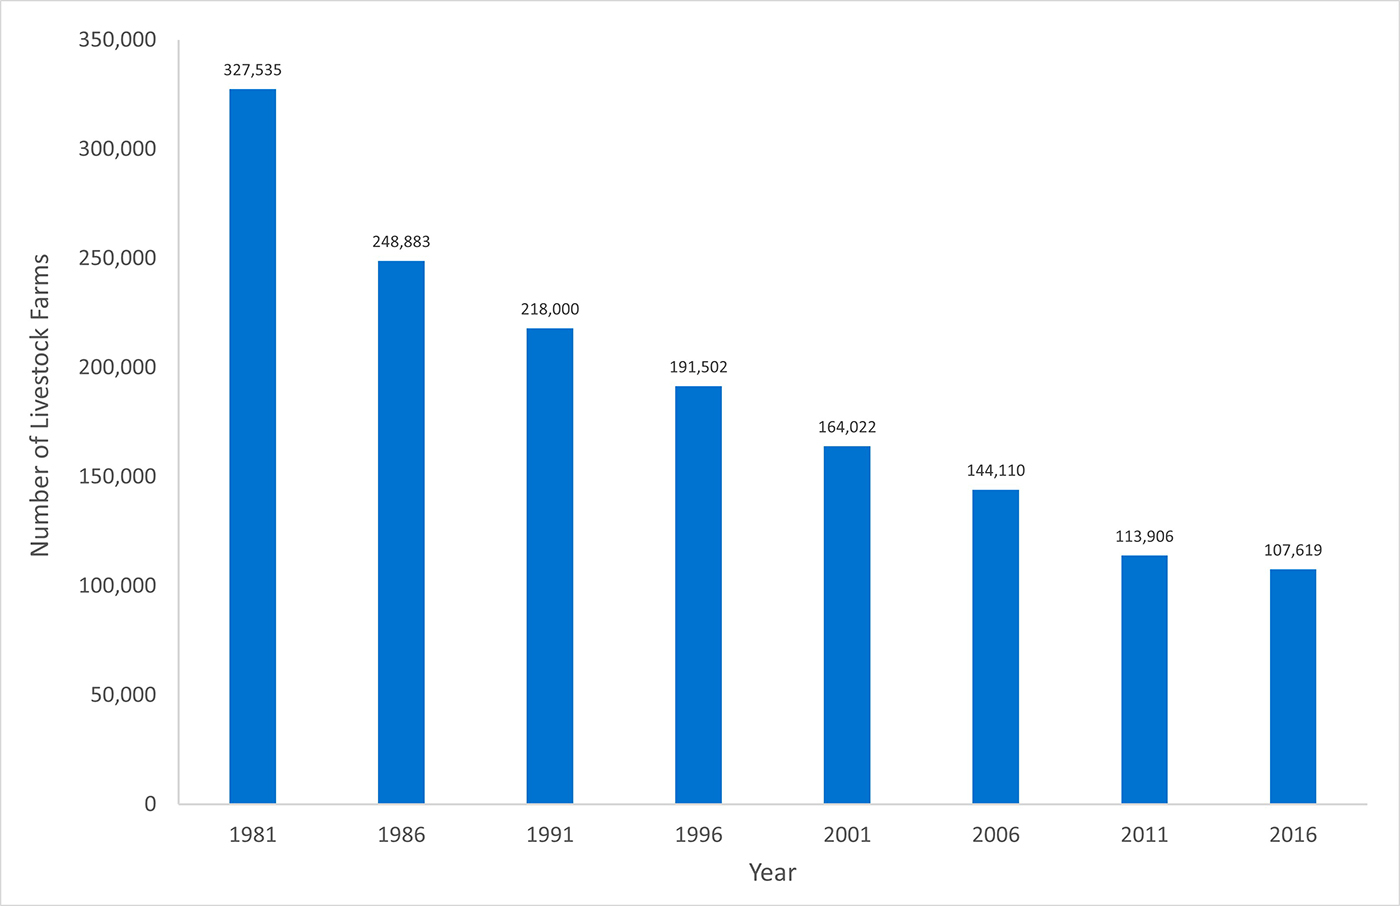
Since 1981 livestock numbers in Canada have generally been increasing over time (Figure 1). Both cattle and pig production numbers peaked in 2005, then decreased significantly to 2010, after which time pig numbers recovered while cattle numbers continued to decline. Poultry numbers experienced a plateau between 2001 and 2011, then continued to grow to 2016. Also significant is the observation that livestock production has experienced a notable intensification onto fewer and larger farms, as livestock farm numbers decreased to one-third what they were in 1981 (Figure 2). This concentration of animals onto fewer farms has continued between 2005 and 2016 despite the volatility in overall growth trends.
Manure management in agricultural production is of critical importance for environmental and water quality protection and to ensure agro-ecosystem sustainability. Without it, valuable surface and ground-water resources may come under threat, hindering agricultural production, food safety and human health. Awareness of at-risk agricultural lands and waters, and an understanding of land-use practices that can mitigate potentially negative impacts, will help ensure that Canada continues to play an important role in minimizing risk of water contamination by coliforms and in maintaining sustainable agricultural landscapes.
Description of Figure 1
| Year | Cattle | Pigs | Other | Poultry10 |
|---|---|---|---|---|
| 1981 | 12,765,200 | 9,989,000 | 3,022,119 | 10,142,250 |
| 1986 | 11,371,749 | 9,924,700 | 2,901,825 | 9,564,075 |
| 1991 | 12,065,900 | 10,461,300 | 2,495,922 | 10,294,968 |
| 1996 | 14,226,550 | 11,490,300 | 2,783,343 | 11,084,134 |
| 2001 | 14,516,350 | 14,107,000 | 3,215,429 | 13,260,947 |
| 2006 | 15,327,499 | 15,005,000 | 3,682,212 | 13,145,295 |
| 2011 | 12,850,000 | 12,690,250 | 2,387,026 | 13,380,652 |
| 2016 | 12,070,001 | 14,007,000 | 1,951,771 | 14,538,024 |
Description of Figure 2
Number of livestock farms by year.
Number of farms reporting
- 1981: 327,535
- 1986: 248,883
- 1991: 218,000
- 1996: 191,502
- 2001: 164,022
- 2006: 144,110
- 2011: 113,906
- 2016: 107,619
The indicator
The IROWC-Coliform model assesses the relative risk of fecal material from agricultural sources contaminating surface waterbodies, using thermotolerant coliforms as a marker. It also evaluates how this risk is changing over time. It provides a tool to predict and evaluate which farm practices can be managed differently to minimize the risk. This version of the indicator builds on the previous work described in van Bochove et al (2010a), with modifications by Keith Reid and Kim Schneider.
The risk of water contamination by coliforms is determined by estimating both the potential numbers of thermotolerant coliforms of agricultural origin (coliform source) and the likelihood of their movement to surface waters (transport). Calculations are on the basis of live coliform daily population sizes, and risk is indicated in five classes called very low, low, moderate, high and very high. The risk classes are arbitrary rankings that were selected to allow mapping of spatial and temporal trends.
The coliform source component considers the manures of four livestock types: cattle, pigs, poultry and other livestock. The average populations of coliforms from pastured animals and from confined animals were estimated on a daily basis using manure production coefficients, fecal coliform coefficients (ASAE, 2003) and a daily decay rate (Himathongkham et al., 1999). Coliforms from pastured-animal manure were considered to be available for transport the same day they were produced, while those from confined-animal manure were assumed to be available for transport only when manure was spread on fields. Four two-week spreading periods per year were assumed for each province based on the first and the last day of soil freezing, and on typical seeding and harvest dates.
The transport component was adapted from the IROWC-Phosphorus model (van Bochove et al., 2010b) which has been substantially revised by Keith Reid and Kim Schneider (Reid et al., 2022). Since coliforms tend to be filtered out by soil, transport is assumed to be by surface flow or rapid tile drainage. Topography, soil texture, daily precipitation, soil erosion risk and surface waterbody spatial density are all considered in the transport model. Annual coliform transport risk is calculated as the cumulative daily risk.
Modeled daily weather data (5 degree grid scale), from The Power Project, were used with DNDC to model soil hydrology. To disambiguate the impacts of annual weather variability from those of practice change, the model was run both using actual weather data for each year, and a synthetic weather file based on the monthly average temperatures and precipitation as well as the expected distribution of precipitation intensity within each month.
Limitations
Coliform contamination from municipal wastewater discharge, leaking septic systems and wildlife were not considered within the scope of this indicator. Also, it was assumed that grazing livestock have no direct access to surface waterbodies. Manure spreading periods were available at provincial and eco-district levels and uniformly applied to polygons within the data scale.
The IROWC-Coliform values reflect the timing of surface runoff from storm events in relation to the active population of coliforms present on agricultural land when such events occur. Days when surface runoff occurs are spatially and annually random because such events are triggered by particular climatic conditions that vary from location to location and year to year. More work is needed to more fully disambiguate these impacts.
Though model calculations are on the basis of live coliform daily population sizes, the assumptions, uncertainties and modeling unknowns result in risk estimates that cannot be interpreted in a directly quantitative way. Risk level is indicated in five somewhat arbitrary classes that allow exploration of spatial and temporal trends, but the labels very low, low, moderate, high and very high may not correlate well with actual risk levels. More work would be needed to relate these risk estimates with actual surface water monitoring data, but large uncertainty will remain due to the difficulties associated with disambiguating agricultural and non-agricultural sources.
Results and interpretation
High risk of coliform loading generally corresponds to areas with intensive animal production, and therefore high volumes of livestock manure by area. In 2016 only 3.6% of Canadian farmland was rated at high or very high soil coliform load risk (Figure 3, Table 1a). These risk areas were found in Alberta and in British Columbia, and to a lesser extent in Manitoba and Nova Scotia (Figure 4).
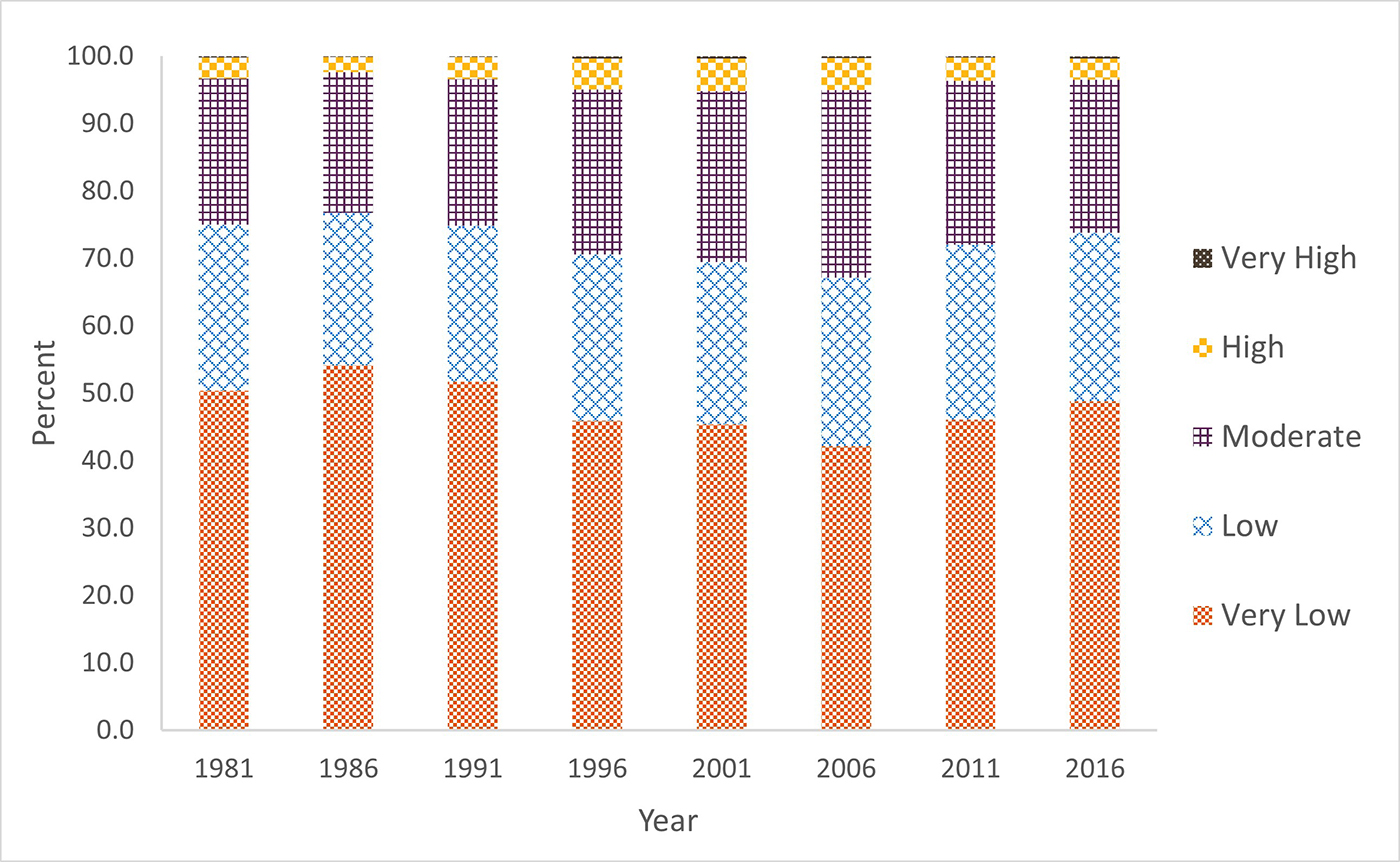
Figure 3: Percentage area of farmland in IROWC-Coliform risk classes, 1981 to 2016
Description of Figure 3
| 1981 | 1986 | 1991 | 1996 | 2001 | 2006 | 2011 | 2016 | |
|---|---|---|---|---|---|---|---|---|
| Very Low | 50.4 | 54.2 | 51.8 | 46.0 | 45.4 | 42.2 | 46.2 | 48.8 |
| Low | 24.6 | 22.7 | 23.1 | 24.7 | 24.1 | 24.9 | 25.9 | 25.0 |
| Moderate | 21.7 | 20.8 | 21.8 | 24.5 | 25.3 | 27.9 | 24.3 | 22.7 |
| High | 3.1 | 2.2 | 3.3 | 4.6 | 4.8 | 4.8 | 3.5 | 3.2 |
| Very High | 0.2 | 0.1 | 0.1 | 0.3 | 0.4 | 0.3 | 0.2 | 0.3 |
Table 1a: Proportion of farmland in various classes of risk of soil coliform load, 1981 to 2016
| Class | Year | Alta. | B.C. | Man. | N.B. | N.L. | N.S. | Ont. | P.E.I. | Que. | Sask. | Can. |
|---|---|---|---|---|---|---|---|---|---|---|---|---|
| Very low | 1981 | 39.5 | 32.1 | 47.9 | 97.9 | 79.8 | 0.3 | 53.8 | 54.5 | 53.5 | 94.9 | 65.9 |
| 1986 | 45.5 | 29.3 | 57.4 | 85.4 | 89.5 | 1.0 | 65.3 | 43.2 | 57.4 | 97.4 | 70.8 | |
| 1991 | 38.5 | 11.9 | 58.8 | 79.0 | 53.0 | 0.5 | 64.6 | 44.0 | 53.8 | 96.1 | 67.5 | |
| 1996 | 31.1 | 4.8 | 36.8 | 82.3 | 63.9 | 0.9 | 58.3 | 42.5 | 39.8 | 88.4 | 58.4 | |
| 2001 | 26.3 | 4.3 | 23.9 | 82.1 | 83.9 | 2.0 | 68.5 | 53.8 | 47.2 | 89.3 | 57.1 | |
| 2006 | 23.2 | 4.8 | 18.4 | 84.3 | 53.6 | 1.1 | 67.8 | 50.7 | 40.6 | 72.8 | 48.2 | |
| 2011 | 30.8 | 8.4 | 25.1 | 88.0 | 72.2 | 4.8 | 77.1 | 75.5 | 51.3 | 84.5 | 57.5 | |
| 2016 | 31.0 | 12.4 | 43.1 | 91.6 | 86.0 | 4.5 | 78.9 | 73.2 | 61.0 | 89.3 | 62.3 | |
| Low | 1981 | 34.4 | 16.0 | 49.9 | 2.1 | 20.0 | 8.4 | 44.1 | 45.5 | 46.2 | 5.1 | 24.6 |
| 1986 | 34.8 | 20.9 | 41.7 | 14.6 | 10.5 | 1.6 | 34.6 | 56.8 | 41.6 | 2.6 | 21.8 | |
| 1991 | 34.3 | 32.4 | 41.0 | 21.0 | 47.0 | 4.5 | 35.1 | 56.0 | 44.6 | 3.8 | 22.5 | |
| 1996 | 31.6 | 26.4 | 55.5 | 17.7 | 36.1 | 2.6 | 39.7 | 57.5 | 56.7 | 11.4 | 27.1 | |
| 2001 | 29.3 | 18.8 | 68.2 | 18.0 | 16.1 | 14.0 | 30.4 | 46.2 | 50.1 | 10.3 | 26.0 | |
| 2006 | 31.0 | 8.0 | 53.8 | 15.7 | 46.4 | 9.1 | 31.1 | 49.3 | 50.2 | 26.2 | 31.7 | |
| 2011 | 33.1 | 31.2 | 66.1 | 12.0 | 27.8 | 29.3 | 22.1 | 24.5 | 43.4 | 15.0 | 28.2 | |
| 2016 | 34.2 | 23.6 | 50.2 | 8.5 | 13.2 | 31.2 | 20.6 | 26.8 | 36.8 | 10.2 | 24.3 | |
| Moderate | 1981 | 19.2 | 13.1 | 2.1 | 0.0 | 0.2 | 51.2 | 2.1 | 0.0 | 0.4 | 0.0 | 6.6 |
| 1986 | 16.4 | 18.4 | 0.9 | 0.0 | 0.0 | 45.3 | 0.1 | 0.0 | 1.0 | 0.0 | 5.7 | |
| 1991 | 18.8 | 16.3 | 0.2 | 0.0 | 0.0 | 28.5 | 0.3 | 0.0 | 1.5 | 0.1 | 6.4 | |
| 1996 | 21.3 | 28.7 | 7.6 | 0.0 | 0.0 | 22.0 | 2.0 | 0.0 | 3.5 | 0.2 | 8.5 | |
| 2001 | 22.4 | 29.6 | 7.7 | 0.0 | 0.0 | 38.6 | 1.1 | 0.0 | 2.8 | 0.4 | 8.9 | |
| 2006 | 24.1 | 36.2 | 25.6 | 0.0 | 0.0 | 50.7 | 1.1 | 0.0 | 9.2 | 1.0 | 12.0 | |
| 2011 | 25.6 | 30.9 | 8.7 | 0.0 | 0.0 | 52.9 | 0.7 | 0.0 | 5.2 | 0.5 | 10.4 | |
| 2016 | 25.7 | 29.5 | 6.3 | 0.0 | 0.8 | 47.1 | 0.5 | 0.0 | 2.1 | 0.5 | 9.8 | |
| High | 1981 | 6.8 | 30.9 | 0.2 | 0.0 | 0.0 | 40.1 | 0.0 | 0.0 | 0.0 | 0.0 | 2.8 |
| 1986 | 3.3 | 26.9 | 0.0 | 0.0 | 0.0 | 52.0 | 0.0 | 0.0 | 0.0 | 0.0 | 1.7 | |
| 1991 | 8.1 | 35.1 | 0.0 | 0.0 | 0.0 | 66.2 | 0.0 | 0.0 | 0.1 | 0.0 | 3.4 | |
| 1996 | 15.3 | 31.1 | 0.1 | 0.0 | 0.0 | 73.3 | 0.0 | 0.0 | 0.0 | 0.0 | 5.6 | |
| 2001 | 19.6 | 41.7 | 0.2 | 0.0 | 0.0 | 44.9 | 0.0 | 0.0 | 0.0 | 0.0 | 7.1 | |
| 2006 | 20.3 | 45.3 | 2.2 | 0.0 | 0.0 | 38.6 | 0.0 | 0.0 | 0.1 | 0.0 | 7.6 | |
| 2011 | 8.9 | 27.9 | 0.1 | 0.0 | 0.0 | 13.0 | 0.0 | 0.0 | 0.2 | 0.0 | 3.5 | |
| 2016 | 7.7 | 31.1 | 0.4 | 0.0 | 0.0 | 17.1 | 0.0 | 0.0 | 0.1 | 0.0 | 3.1 | |
| Very high | 1981 | 0.1 | 7.9 | 0.0 | 0.0 | 0.0 | 0.0 | 0.0 | 0.0 | 0.0 | 0.0 | 0.2 |
| 1986 | 0.0 | 4.4 | 0.0 | 0.0 | 0.0 | 0.1 | 0.0 | 0.0 | 0.0 | 0.0 | 0.1 | |
| 1991 | 0.3 | 4.3 | 0.0 | 0.0 | 0.0 | 0.3 | 0.0 | 0.0 | 0.0 | 0.0 | 0.2 | |
| 1996 | 0.8 | 9.0 | 0.0 | 0.0 | 0.0 | 1.1 | 0.0 | 0.0 | 0.0 | 0.0 | 0.4 | |
| 2001 | 2.4 | 5.7 | 0.0 | 0.0 | 0.0 | 0.6 | 0.0 | 0.0 | 0.0 | 0.0 | 0.9 | |
| 2006 | 1.4 | 5.8 | 0.0 | 0.0 | 0.0 | 0.5 | 0.0 | 0.0 | 0.0 | 0.0 | 0.6 | |
| 2011 | 1.7 | 1.7 | 0.0 | 0.0 | 0.0 | 0.1 | 0.0 | 0.0 | 0.0 | 0.0 | 0.6 | |
| 2016 | 1.3 | 3.4 | 0.0 | 0.0 | 0.0 | 0.2 | 0.0 | 0.0 | 0.0 | 0.0 | 0.5 |
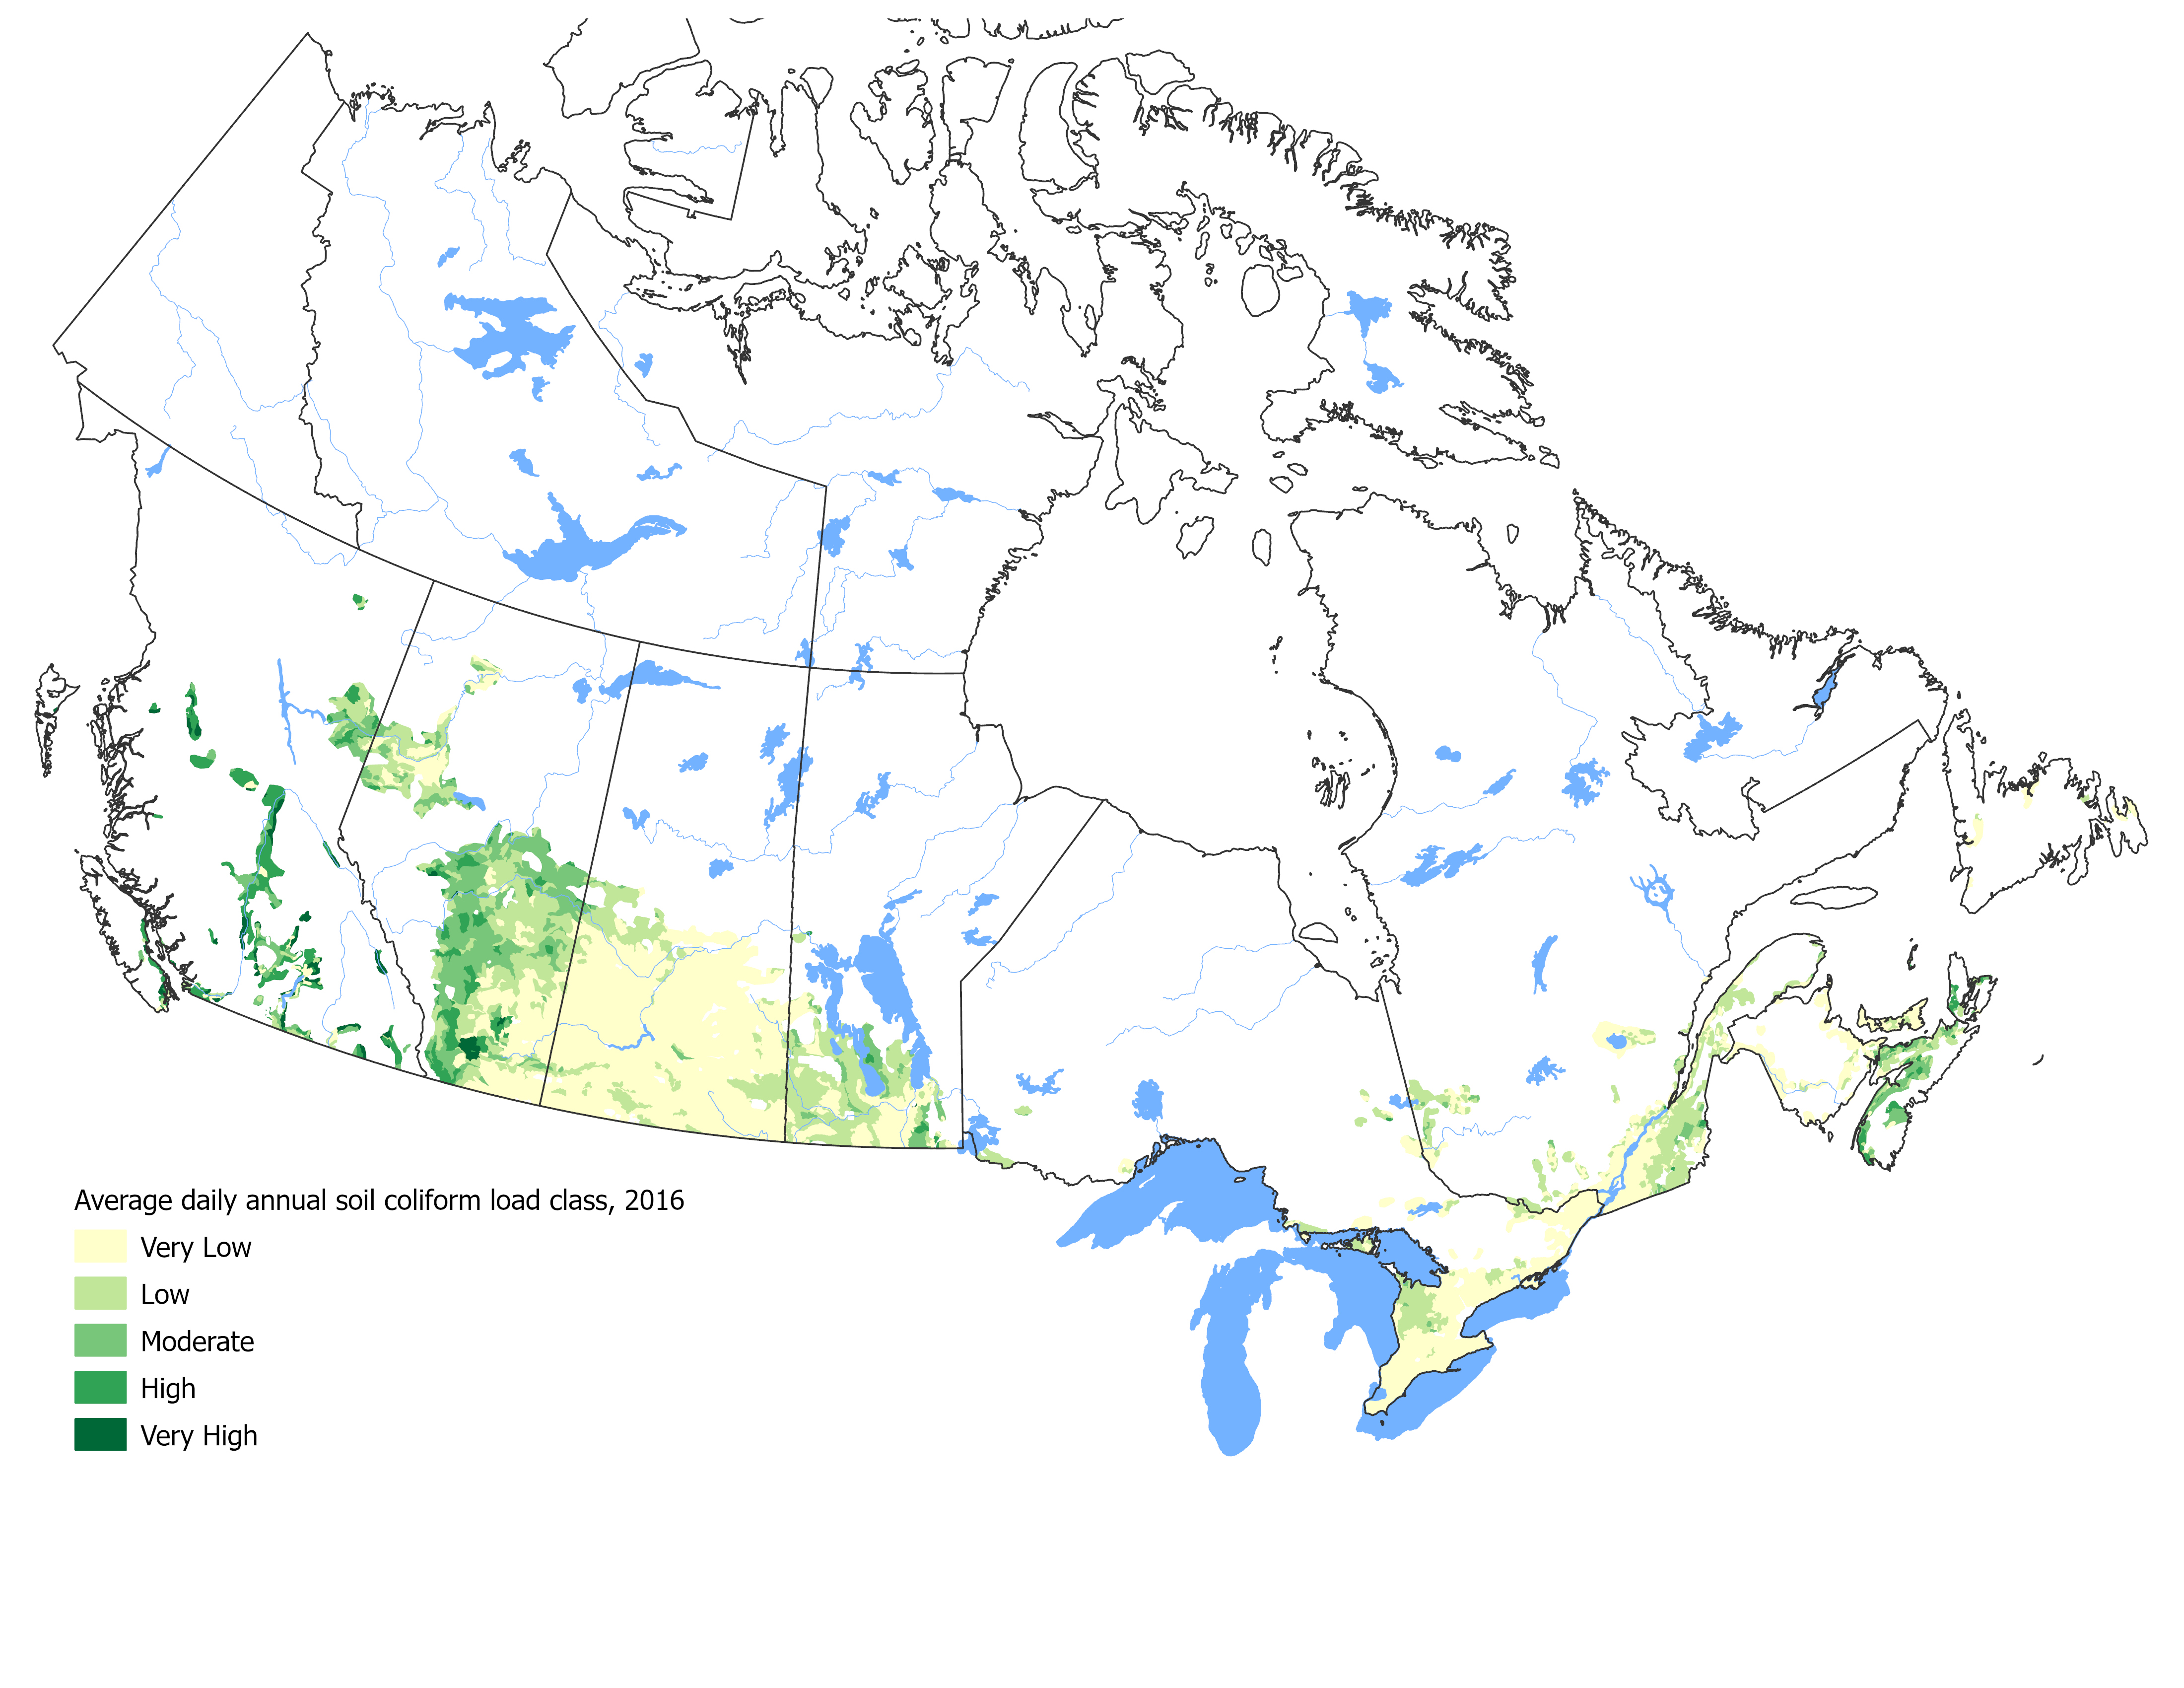
Figure 4: Average daily annual soil coliform load class, 2016
Description of Figure 4
Figure 4 illustrates the daily annual soil coliform load class for 2016, colour coded based on the level of coliform load in the soil.
This is primarily related to intensive cattle production in Alberta and the British Columbia interior, dairy production in the Fraser Valley, and pig production in Manitoba. Nova Scotia sees higher risk ratings than other eastern provinces because it has relatively little field crop land, which results in a higher ratio of livestock to agricultural land area. In the prairie provinces, outside the intensive beef production areas of Alberta and pig production areas in Manitoba, the land is mostly producing grain or low intensity, grassland-based beef, so the risk of soil coliform loading is low to very low.
In 2016, 3.6% of Canadian farmland was rated at high or very high risk of water contamination by coliforms (Table 1b). Very High risk areas were located in British Columbia, Alberta, Ontario and Nova Scotia, with high risk areas found in all but Prince Edward Island and Saskatchewan (Figure 5).
Table 1b: Proportion of farmland in various classes coliform risk to water, 1981 to 2016
| Class | Year | Alta. | B.C. | Man. | N.B. | N.L. | N.S. | Ont. | P.E.I. | Que. | Sask. | Can. |
|---|---|---|---|---|---|---|---|---|---|---|---|---|
| Very low | 1981 | 29.2 | 7.3 | 35.3 | 25.1 | 35.5 | 0.2 | 22.1 | 12.5 | 2.8 | 83.7 | 50.4 |
| 1986 | 33.5 | 5.6 | 37.6 | 23.4 | 35.0 | 0.4 | 23.8 | 8.4 | 2.8 | 88.2 | 54.2 | |
| 1991 | 28.8 | 5.8 | 37.5 | 23.3 | 30.5 | 0.4 | 23.4 | 12.2 | 2.3 | 85.8 | 51.8 | |
| 1996 | 26.4 | 5.5 | 31.7 | 36.4 | 44.2 | 0.6 | 23.7 | 12.2 | 2.8 | 75.1 | 46.0 | |
| 2001 | 24.6 | 5.0 | 28.6 | 25.2 | 30.6 | 0.9 | 25.8 | 16.3 | 2.3 | 75.8 | 45.4 | |
| 2006 | 24.2 | 5.5 | 27.5 | 24.9 | 20.9 | 0.3 | 25.1 | 14.6 | 2.6 | 69.3 | 42.2 | |
| 2011 | 26.3 | 5.5 | 33.1 | 39.7 | 34.6 | 0.9 | 29.8 | 31.8 | 2.9 | 74.9 | 46.2 | |
| 2016 | 27.0 | 4.9 | 34.7 | 46.6 | 34.5 | 1.7 | 31.1 | 32.1 | 4.6 | 79.1 | 48.8 | |
| Low | 1981 | 30.0 | 19.6 | 45.9 | 47.1 | 42.0 | 0.5 | 21.7 | 72.3 | 29.4 | 15.4 | 24.6 |
| 1986 | 28.3 | 19.0 | 45.5 | 49.3 | 26.7 | 1.0 | 26.3 | 76.4 | 28.7 | 11.1 | 22.7 | |
| 1991 | 25.6 | 15.8 | 46.3 | 46.1 | 13.8 | 0.6 | 31.2 | 68.1 | 27.7 | 13.3 | 23.1 | |
| 1996 | 21.3 | 7.5 | 41.9 | 36.4 | 22.6 | 0.3 | 27.4 | 63.6 | 21.9 | 23.2 | 24.7 | |
| 2001 | 20.1 | 4.6 | 36.8 | 49.2 | 32.3 | 0.4 | 34.1 | 70.9 | 23.9 | 22.4 | 24.1 | |
| 2006 | 17.9 | 4.9 | 29.9 | 50.8 | 42.3 | 0.4 | 35.3 | 61.0 | 22.1 | 27.5 | 24.9 | |
| 2011 | 24.6 | 10.9 | 32.3 | 35.0 | 30.7 | 1.9 | 40.3 | 55.8 | 25.2 | 22.9 | 25.9 | |
| 2016 | 23.8 | 9.5 | 38.1 | 31.4 | 40.8 | 2.4 | 40.4 | 59.8 | 31.1 | 19.3 | 25.0 | |
| Moderate | 1981 | 35.3 | 29.4 | 18.4 | 25.6 | 19.7 | 30.3 | 53.1 | 15.3 | 63.3 | 0.9 | 21.7 |
| 1986 | 35.3 | 35.5 | 16.6 | 23.4 | 34.0 | 23.6 | 48.4 | 15.3 | 61.5 | 0.6 | 20.8 | |
| 1991 | 40.0 | 30.3 | 16.0 | 24.1 | 53.5 | 22.8 | 43.5 | 19.7 | 62.6 | 0.9 | 21.8 | |
| 1996 | 43.0 | 33.9 | 25.6 | 22.7 | 28.2 | 18.9 | 45.4 | 24.2 | 67.5 | 1.7 | 24.5 | |
| 2001 | 45.3 | 32.1 | 34.0 | 20.6 | 32.7 | 36.0 | 36.6 | 12.7 | 65.8 | 1.8 | 25.3 | |
| 2006 | 48.8 | 25.9 | 41.6 | 20.0 | 33.5 | 36.2 | 36.5 | 24.4 | 66.6 | 3.2 | 27.9 | |
| 2011 | 42.7 | 36.8 | 33.9 | 20.0 | 32.6 | 57.8 | 28.4 | 12.4 | 63.7 | 2.1 | 24.3 | |
| 2016 | 43.6 | 34.5 | 26.9 | 19.6 | 17.1 | 54.1 | 27.8 | 8.1 | 51.6 | 1.6 | 22.7 | |
| High | 1981 | 5.5 | 37.5 | 0.4 | 2.1 | 2.6 | 67.0 | 3.1 | 0.0 | 4.2 | 0.0 | 3.1 |
| 1986 | 2.9 | 35.1 | 0.3 | 3.9 | 4.4 | 72.9 | 1.4 | 0.0 | 6.6 | 0.0 | 2.2 | |
| 1991 | 5.6 | 44.0 | 0.2 | 6.5 | 1.1 | 72.3 | 1.9 | 0.0 | 7.1 | 0.0 | 3.3 | |
| 1996 | 9.2 | 41.8 | 0.8 | 4.6 | 3.3 | 76.0 | 3.6 | 0.0 | 7.1 | 0.0 | 4.6 | |
| 2001 | 9.6 | 49.6 | 0.7 | 5.1 | 4.2 | 59.0 | 3.5 | 0.0 | 7.4 | 0.0 | 4.8 | |
| 2006 | 9.0 | 54.5 | 1.0 | 4.3 | 2.9 | 59.8 | 3.1 | 0.0 | 7.8 | 0.0 | 4.8 | |
| 2011 | 6.3 | 42.8 | 0.7 | 5.3 | 0.6 | 36.9 | 1.5 | 0.0 | 7.4 | 0.0 | 3.5 | |
| 2016 | 5.1 | 44.7 | 0.3 | 2.5 | 6.7 | 40.8 | 0.8 | 0.0 | 11.9 | 0.0 | 3.2 | |
| Very high | 1981 | 0.0 | 6.2 | 0.0 | 0.0 | 0.2 | 2.0 | 0.0 | 0.0 | 0.3 | 0.0 | 0.2 |
| 1986 | 0.0 | 4.7 | 0.0 | 0.0 | 0.0 | 2.0 | 0.0 | 0.0 | 0.4 | 0.0 | 0.1 | |
| 1991 | 0.0 | 4.2 | 0.0 | 0.0 | 1.1 | 4.0 | 0.0 | 0.0 | 0.4 | 0.0 | 0.1 | |
| 1996 | 0.1 | 11.4 | 0.0 | 0.0 | 1.8 | 4.2 | 0.0 | 0.0 | 0.6 | 0.0 | 0.3 | |
| 2001 | 0.5 | 8.8 | 0.0 | 0.0 | 0.3 | 3.8 | 0.0 | 0.0 | 0.7 | 0.0 | 0.4 | |
| 2006 | 0.2 | 9.2 | 0.0 | 0.0 | 0.4 | 3.3 | 0.0 | 0.0 | 0.8 | 0.0 | 0.3 | |
| 2011 | 0.1 | 4.0 | 0.0 | 0.0 | 1.5 | 2.6 | 0.0 | 0.0 | 0.8 | 0.0 | 0.2 | |
| 2016 | 0.5 | 6.5 | 0.0 | 0.0 | 0.8 | 1.1 | 0.0 | 0.0 | 0.8 | 0.0 | 0.3 |
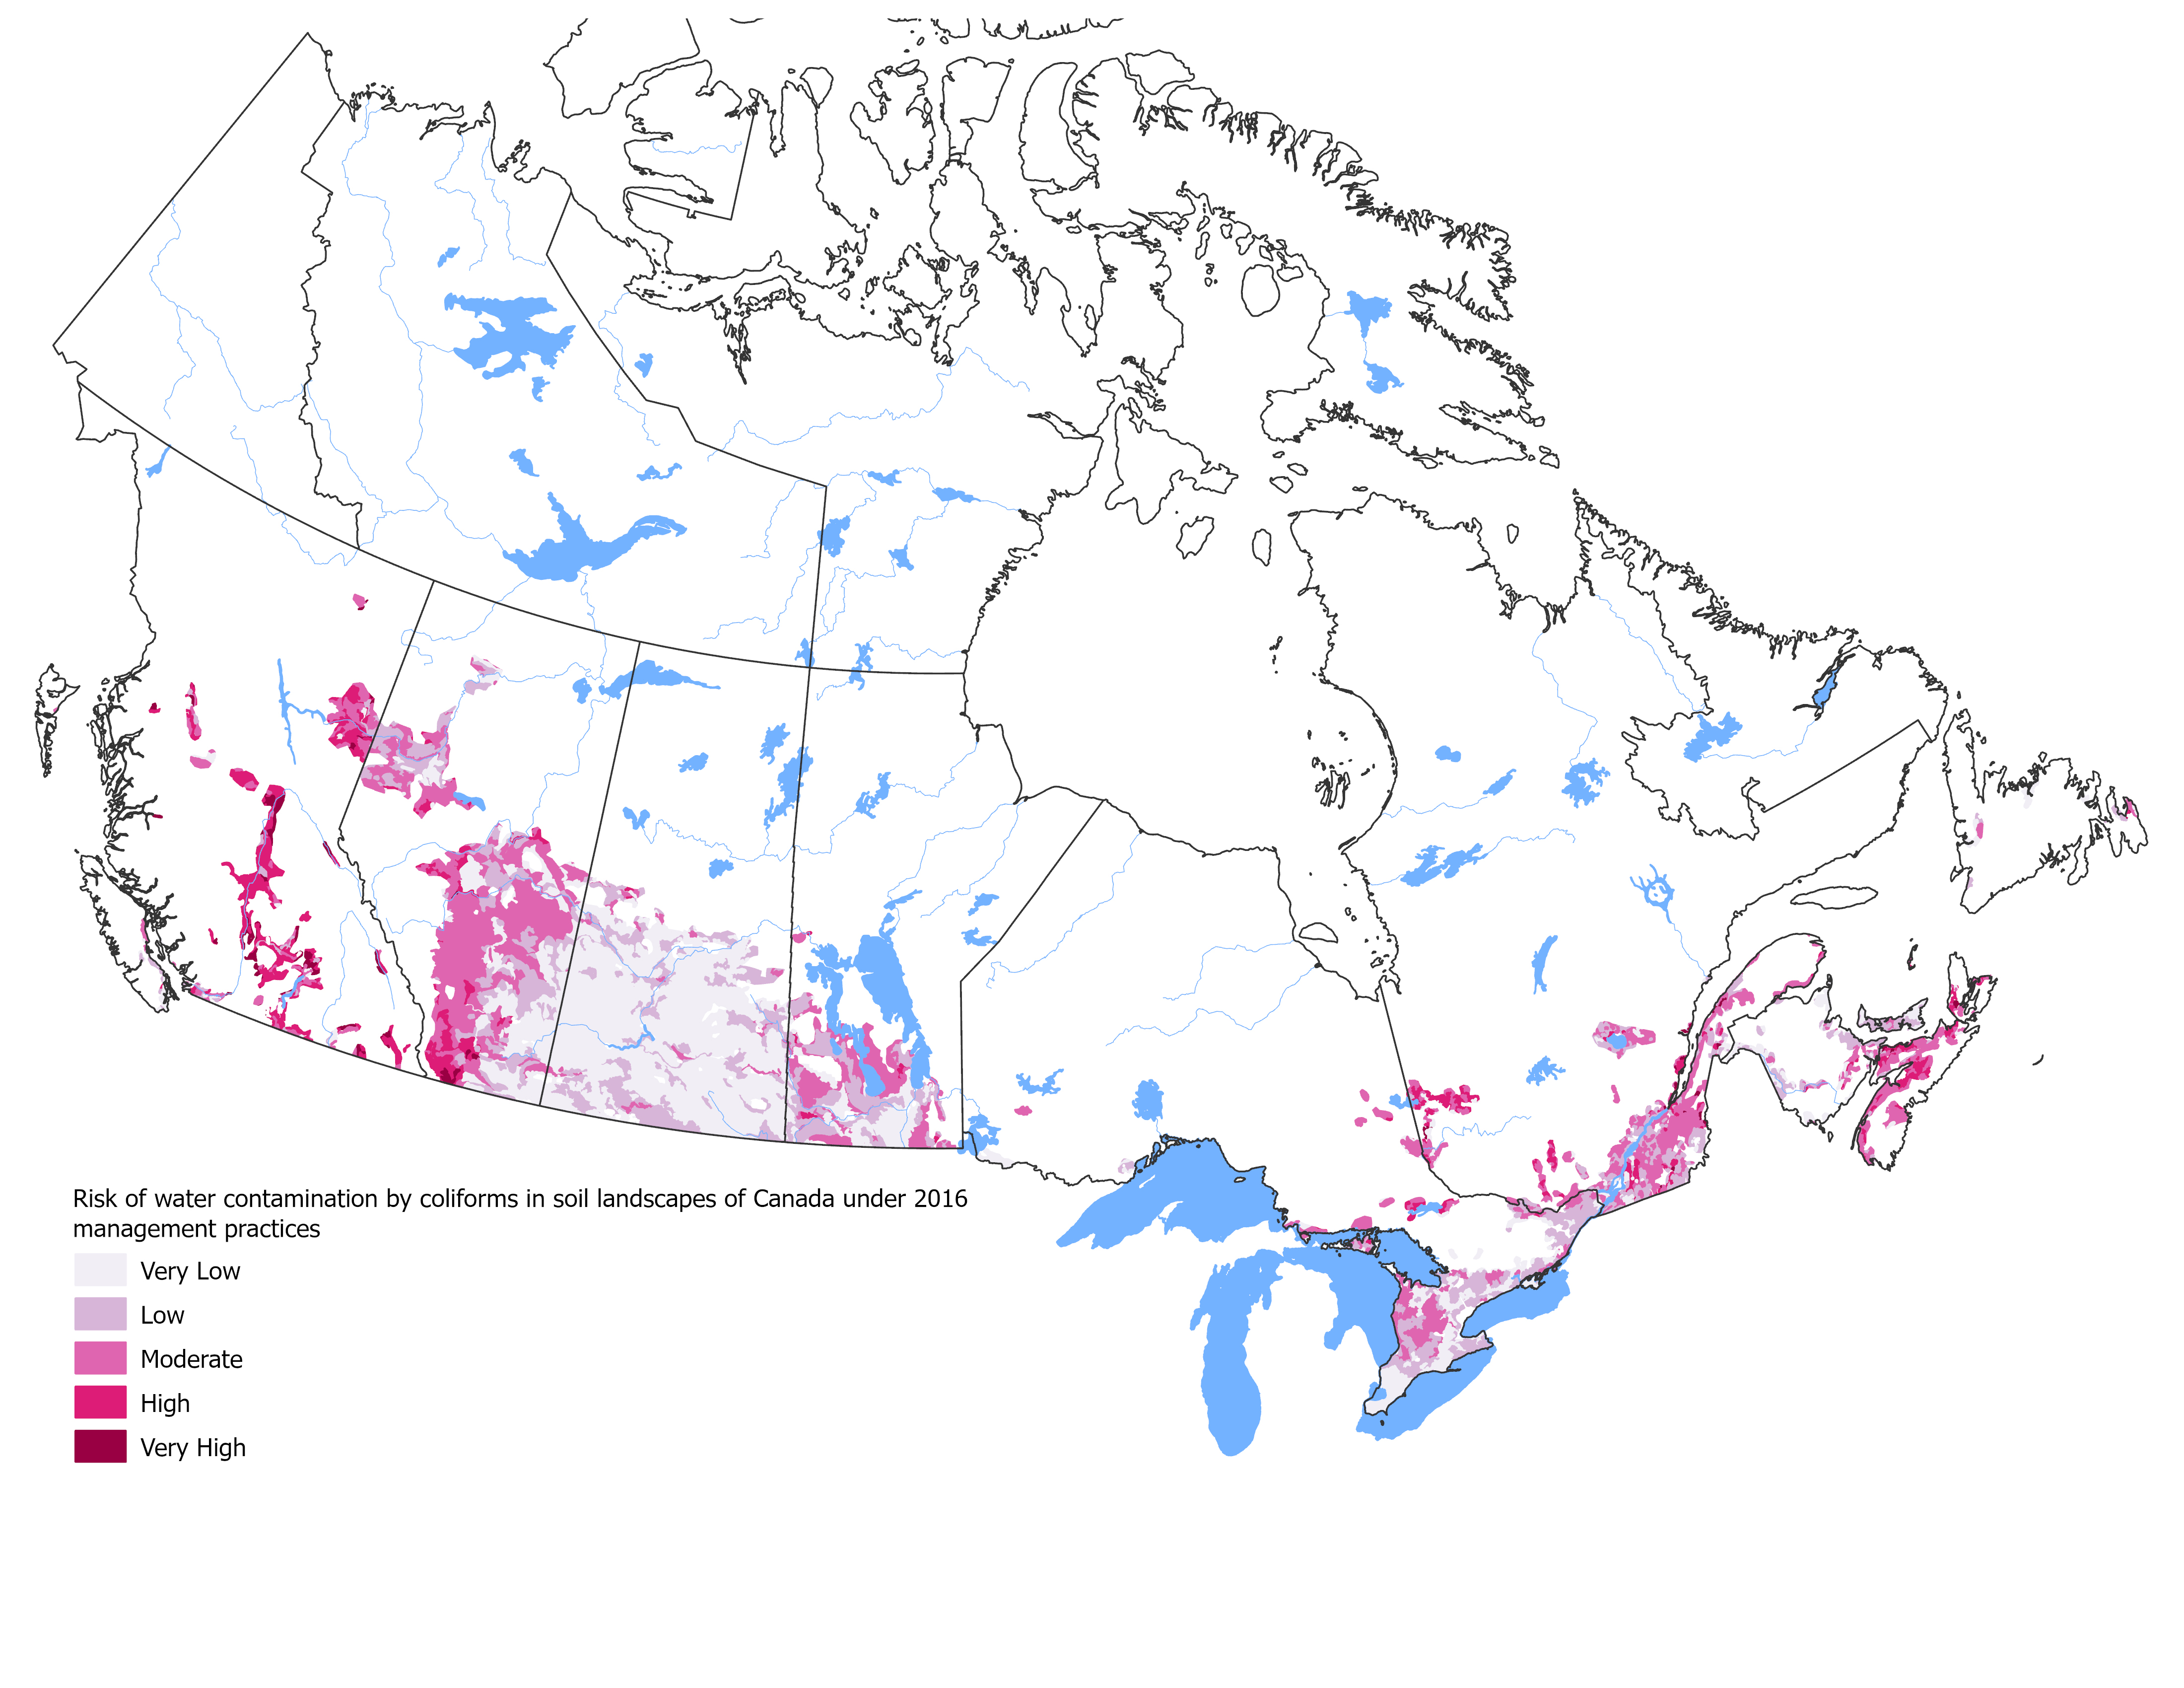
Figure 5: Risk of water contamination by coliforms in soil landscapes of Canada under 2016 management practices
Description of Figure 5
Figure 5 illustrates the risk of water contamination by coliforms in soil landscapes of Canada under 2016 management practices, colour coded based on the level of contamination risk.
Increased runoff risk due to terrain in the British Columbia interior, higher rainfall rates in Eastern Canada, and tile drainage in Ontario, Quebec and Manitoba, are the predominant factors that transform soil coliform load risk into a risk of water contamination.
The change in the IROWC-Coliform risk between 1981 and 2016 was due to changes in livestock population, and redistribution of livestock to concentrated production regions, For most of the agricultural region, coliform risk to water has not changed significantly in 35 years, Scattered regions throughout Canada, including much of Ontario, have had a slight decrease in risk, due to reductions in cattle and pig production operations, Some other locations, particularly in Western Canada, have seen an increase in water risk due to increased concentration of animal production, This is particularly evident in parts of Alberta and British Columbia (Figure 6).
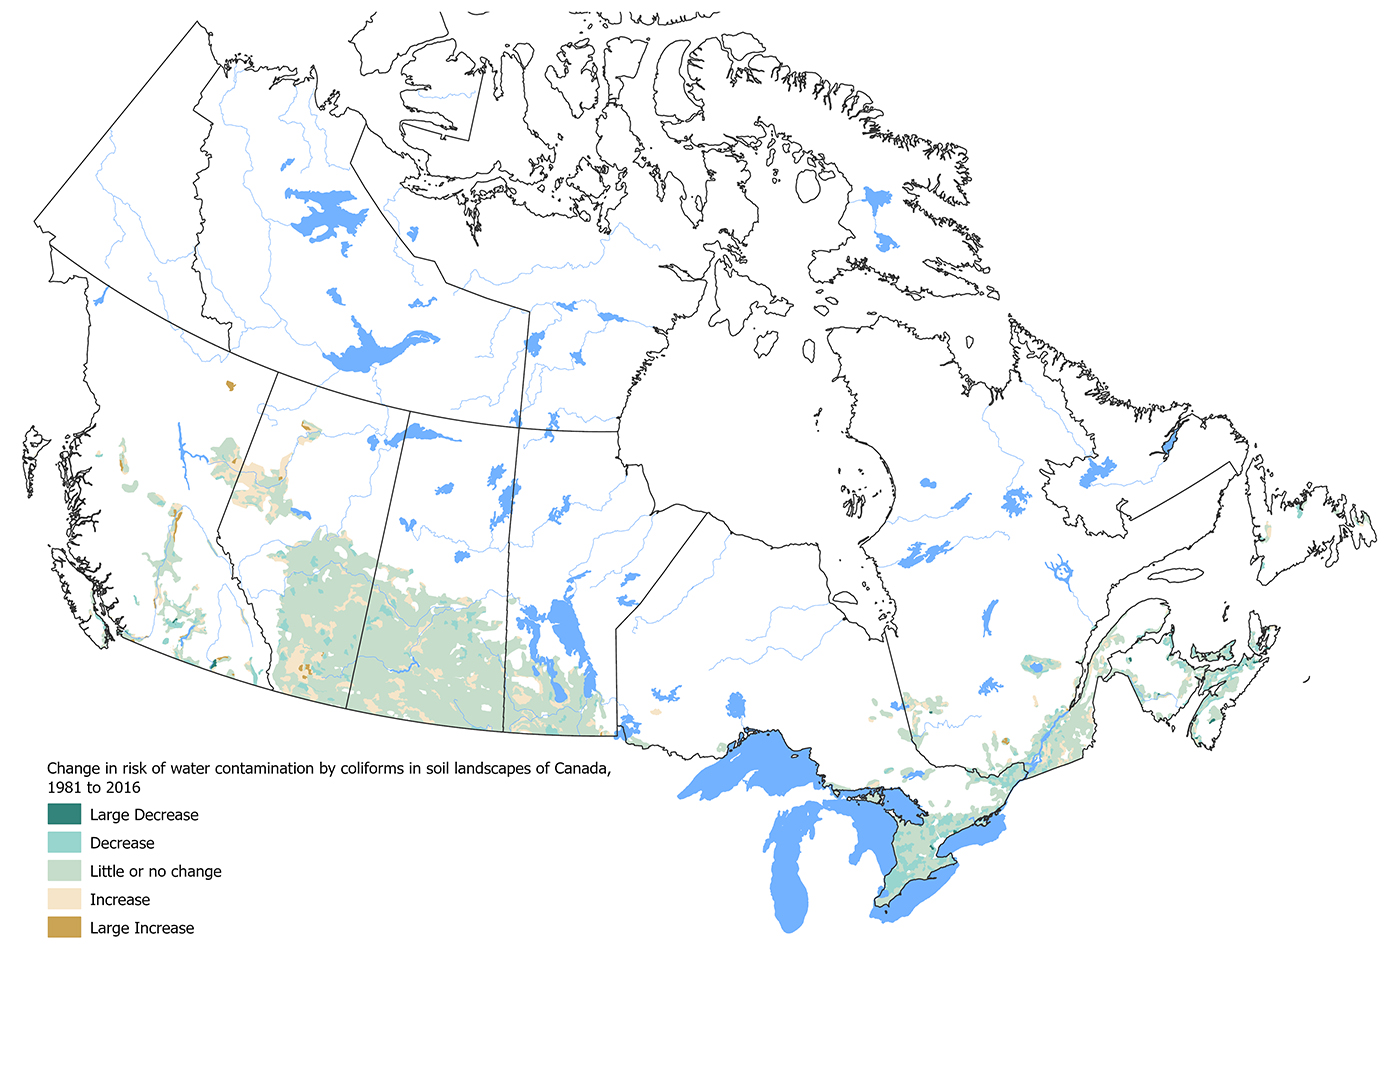
Figure 6: Change in risk of water contamination by coliforms in soil landscapes of Canada, 1981 to 2016
Description of Figure 6
Figure 6 illustrates the change in water contamination by coliforms risk classes between 1981 and 2016, colour coded based on the level of class change
Weather conditions have a significant impact on the risk of water contamination by coliforms in any particular year, Coliform mortality is increased by colder weather, reducing the soil load risk. Coliform risk to water is strongly dependent on the intensity of rainfall events, and their timing relative to manure spreading events. This weather-induced variability was largely removed from the model by using climate data normalized over 1981 to 2016. A national scale comparison the of indices of soil coliform load and water risk over time, from model runs based on annual weather data vs runs based on normalized climate data, shows markedly greater annual variability in risk estimates when annual weather variability is included in the model. (Figure 7). Because normalizing rainfall events reduces storm event intensity, the water risk index values are lowered overall when normalized data are used, compared with the more realistic picture of annual water risk taking into account the variability in storm intensities. This does not reduce the usefulness of the results for indicator purposes, though, since it is the trends that matter rather than the magnitudes.
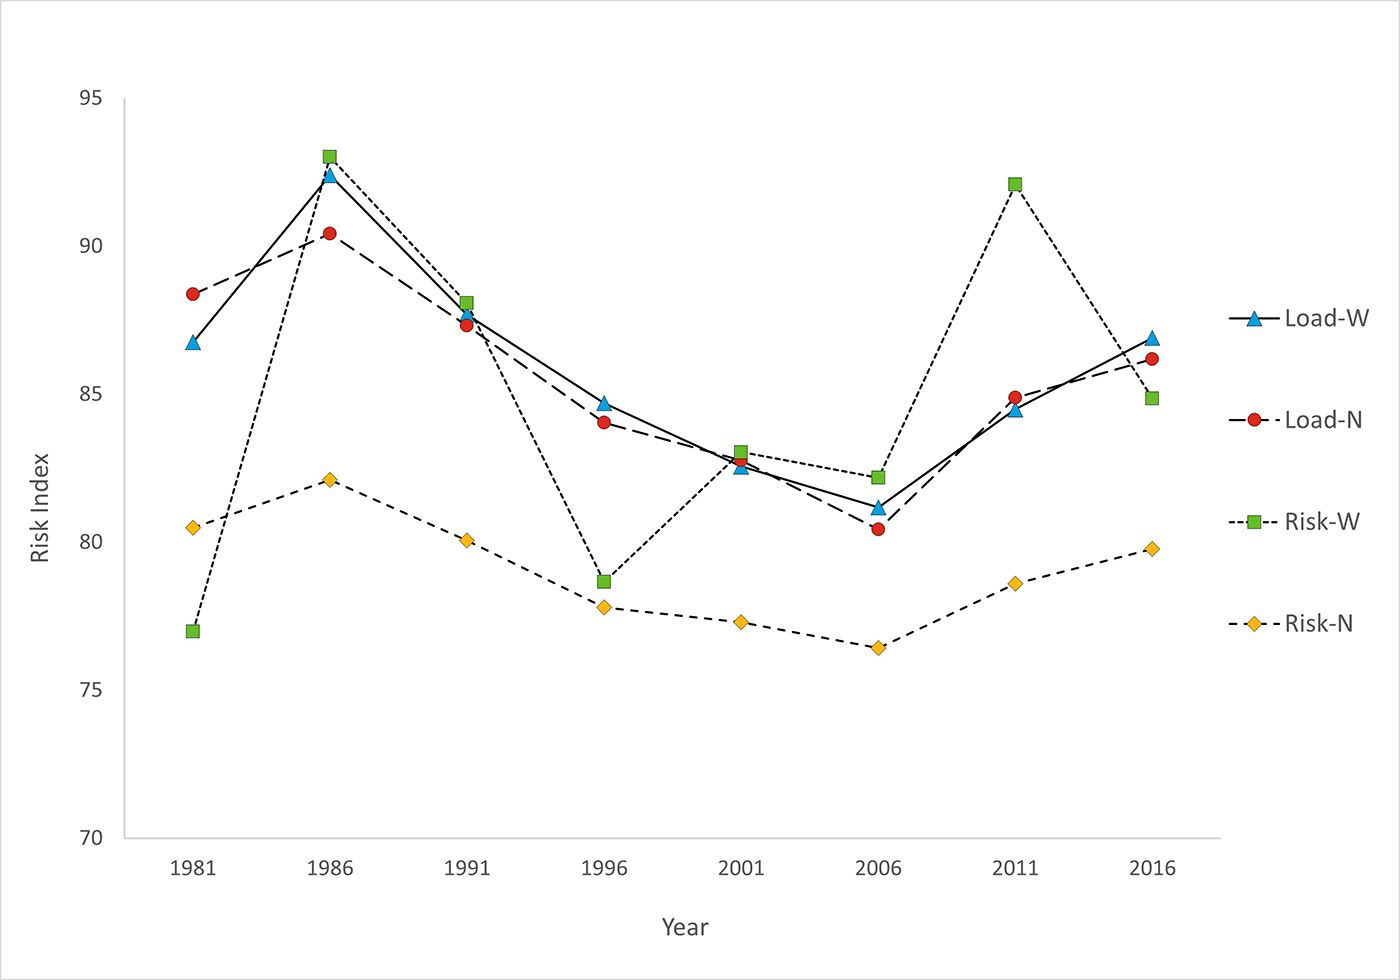
Figure 7: Comparison of national soil coliform load (Load-) and water risk (Risk-) indices based on annual weather data (-W) climate data normalized over 1981 to 2016 (-N).
Description of Figure 7
National soil coliform load (Load-) and water risk (Risk-) indices based on annual weather data (-W) climate data normalized over 1981 to 2016 (-N).
| Year | Load-W | Load-N | Risk-W | Risk-N |
|---|---|---|---|---|
| 1981 | 89.7 | 88.3 | 79.0 | 80.5 |
| 1986 | 89.9 | 90.4 | 89.6 | 82.1 |
| 1991 | 88.0 | 88.4 | 89.3 | 80.8 |
| 1996 | 80.5 | 84.4 | 80.7 | 77.9 |
| 2001 | 85.5 | 82.8 | 85.6 | 77.3 |
| 2006 | 81.0 | 79.8 | 84.9 | 76.0 |
| 2011 | 85.8 | 84.6 | 77.8 | 78.6 |
| 2016 | 88.3 | 86.2 | 89.7 | 79.7 |
Coliform loading on pasture land varies throughout the year based on when livestock are on pasture. In the western provinces, some animals remain outside during winter, which keeps the concentration of coliforms available for transport an order of magnitude higher (Figure 8) than in the east. Spring snowmelt runoff in the prairies is often the only annual runoff, and this pasture-runoff accounts for almost 90% of the risk of coliforms entering waterbodies.
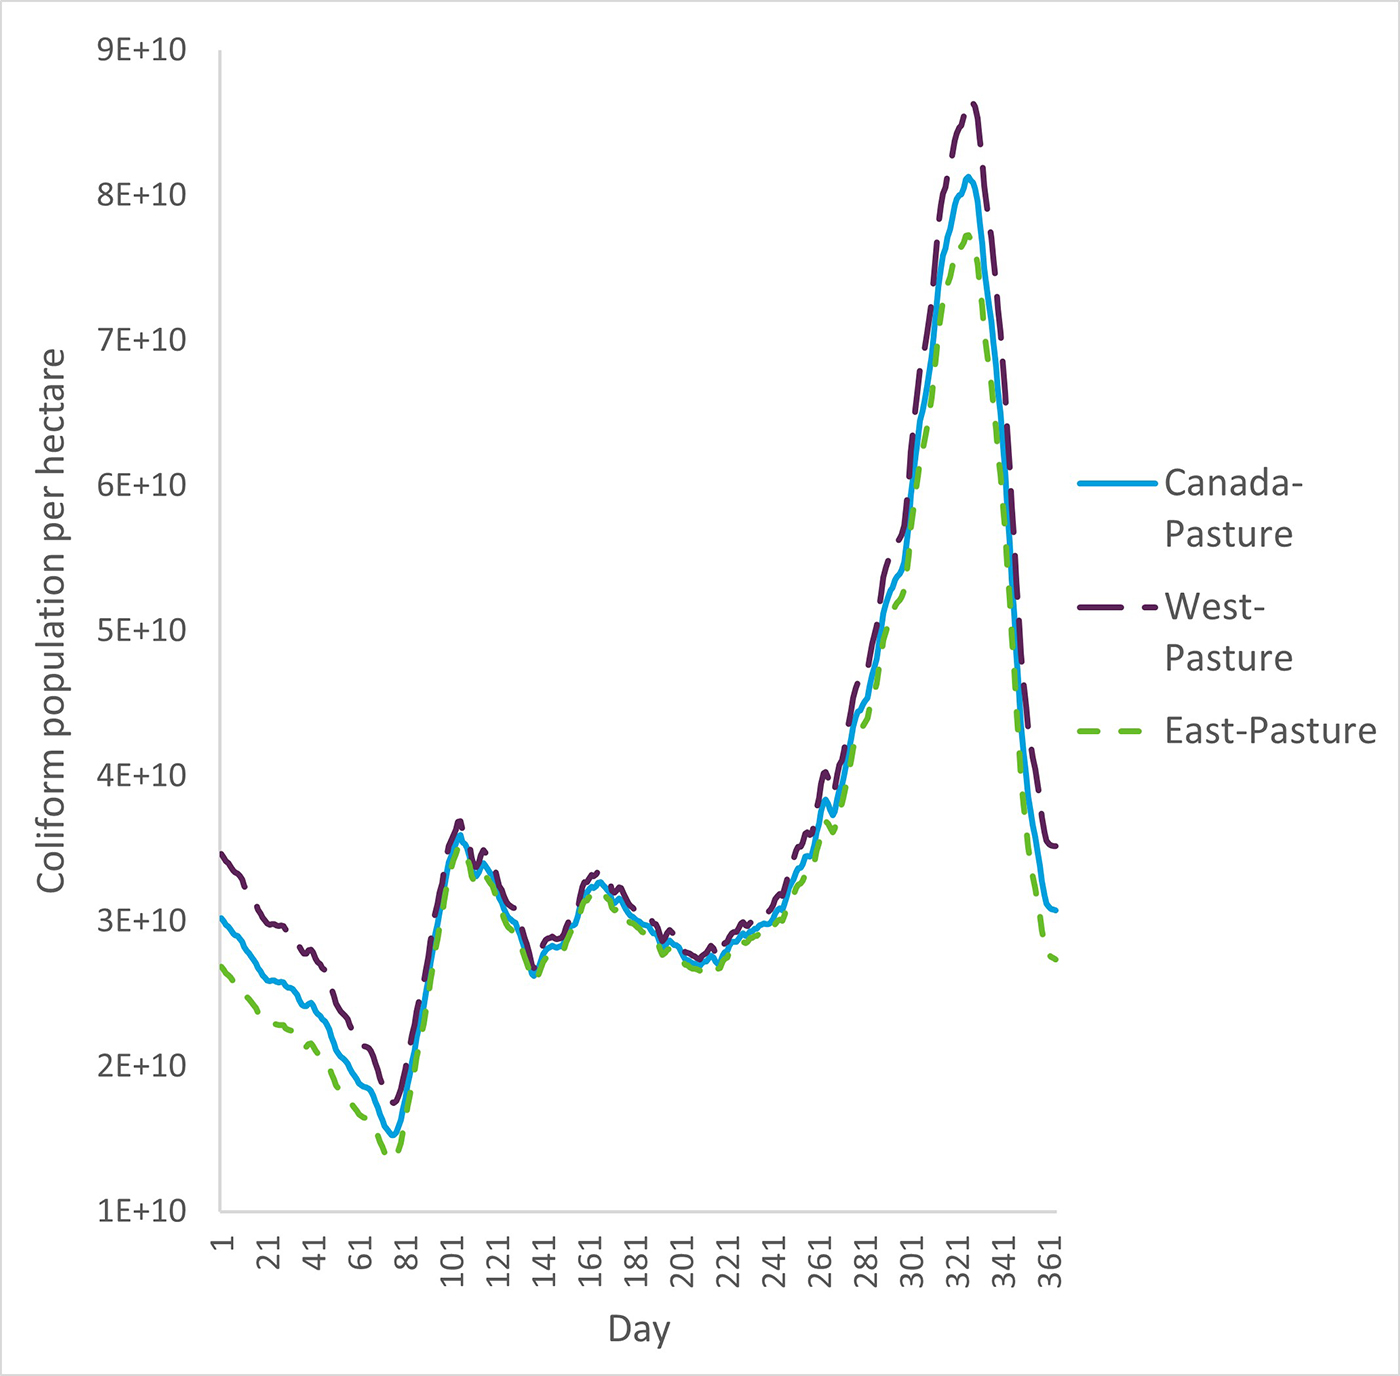
Figure 8: Daily mean coliform population on pasture land, 2016
Description of Figure 8
Daily mean coliform population on pasture land, 2016
| Day | Can-P | West-P | East-P |
|---|---|---|---|
| 1 | 3.05E+10 | 3.49E+10 | 2.72E+10 |
| 21 | 2.61E+10 | 3.00E+10 | 2.31E+10 |
| 41 | 2.44E+10 | 2.81E+10 | 2.16E+10 |
| 61 | 1.91E+10 | 2.20E+10 | 1.69E+10 |
| 81 | 1.70E+10 | 1.91E+10 | 1.55E+10 |
| 101 | 3.40E+10 | 3.52E+10 | 3.32E+10 |
| 121 | 3.28E+10 | 3.37E+10 | 3.20E+10 |
| 141 | 2.73E+10 | 2.80E+10 | 2.68E+10 |
| 161 | 3.20E+10 | 3.27E+10 | 3.14E+10 |
| 181 | 3.03E+10 | 3.09E+10 | 2.99E+10 |
| 201 | 2.82E+10 | 2.89E+10 | 2.77E+10 |
| 221 | 2.79E+10 | 2.85E+10 | 2.74E+10 |
| 241 | 2.99E+10 | 3.08E+10 | 2.92E+10 |
| 261 | 3.61E+10 | 3.77E+10 | 3.48E+10 |
| 281 | 4.49E+10 | 4.69E+10 | 4.34E+10 |
| 301 | 5.74E+10 | 6.03E+10 | 5.53E+10 |
| 321 | 7.93E+10 | 8.38E+10 | 7.59E+10 |
| 341 | 6.49E+10 | 7.06E+10 | 6.07E+10 |
| 361 | 3.12E+10 | 3.55E+10 | 2.79E+10 |
Throughout Canada most dairy cattle, pigs and poultry are confined year round, and in eastern Canada most beef cattle are also confined in winter. The manure is stored for spreading in warmer seasons. Manure is spread at four main time periods between spring thaw and fall freeze (Figure 9). In the west, with a shorter growing season, manure spreading is confined to fewer days, while in the east the spreading season can begin earlier in the spring and continue later into the fall. The timing between the period of spreading and the weather conditions during or following these periods has a critical impact on the coliform risk value.
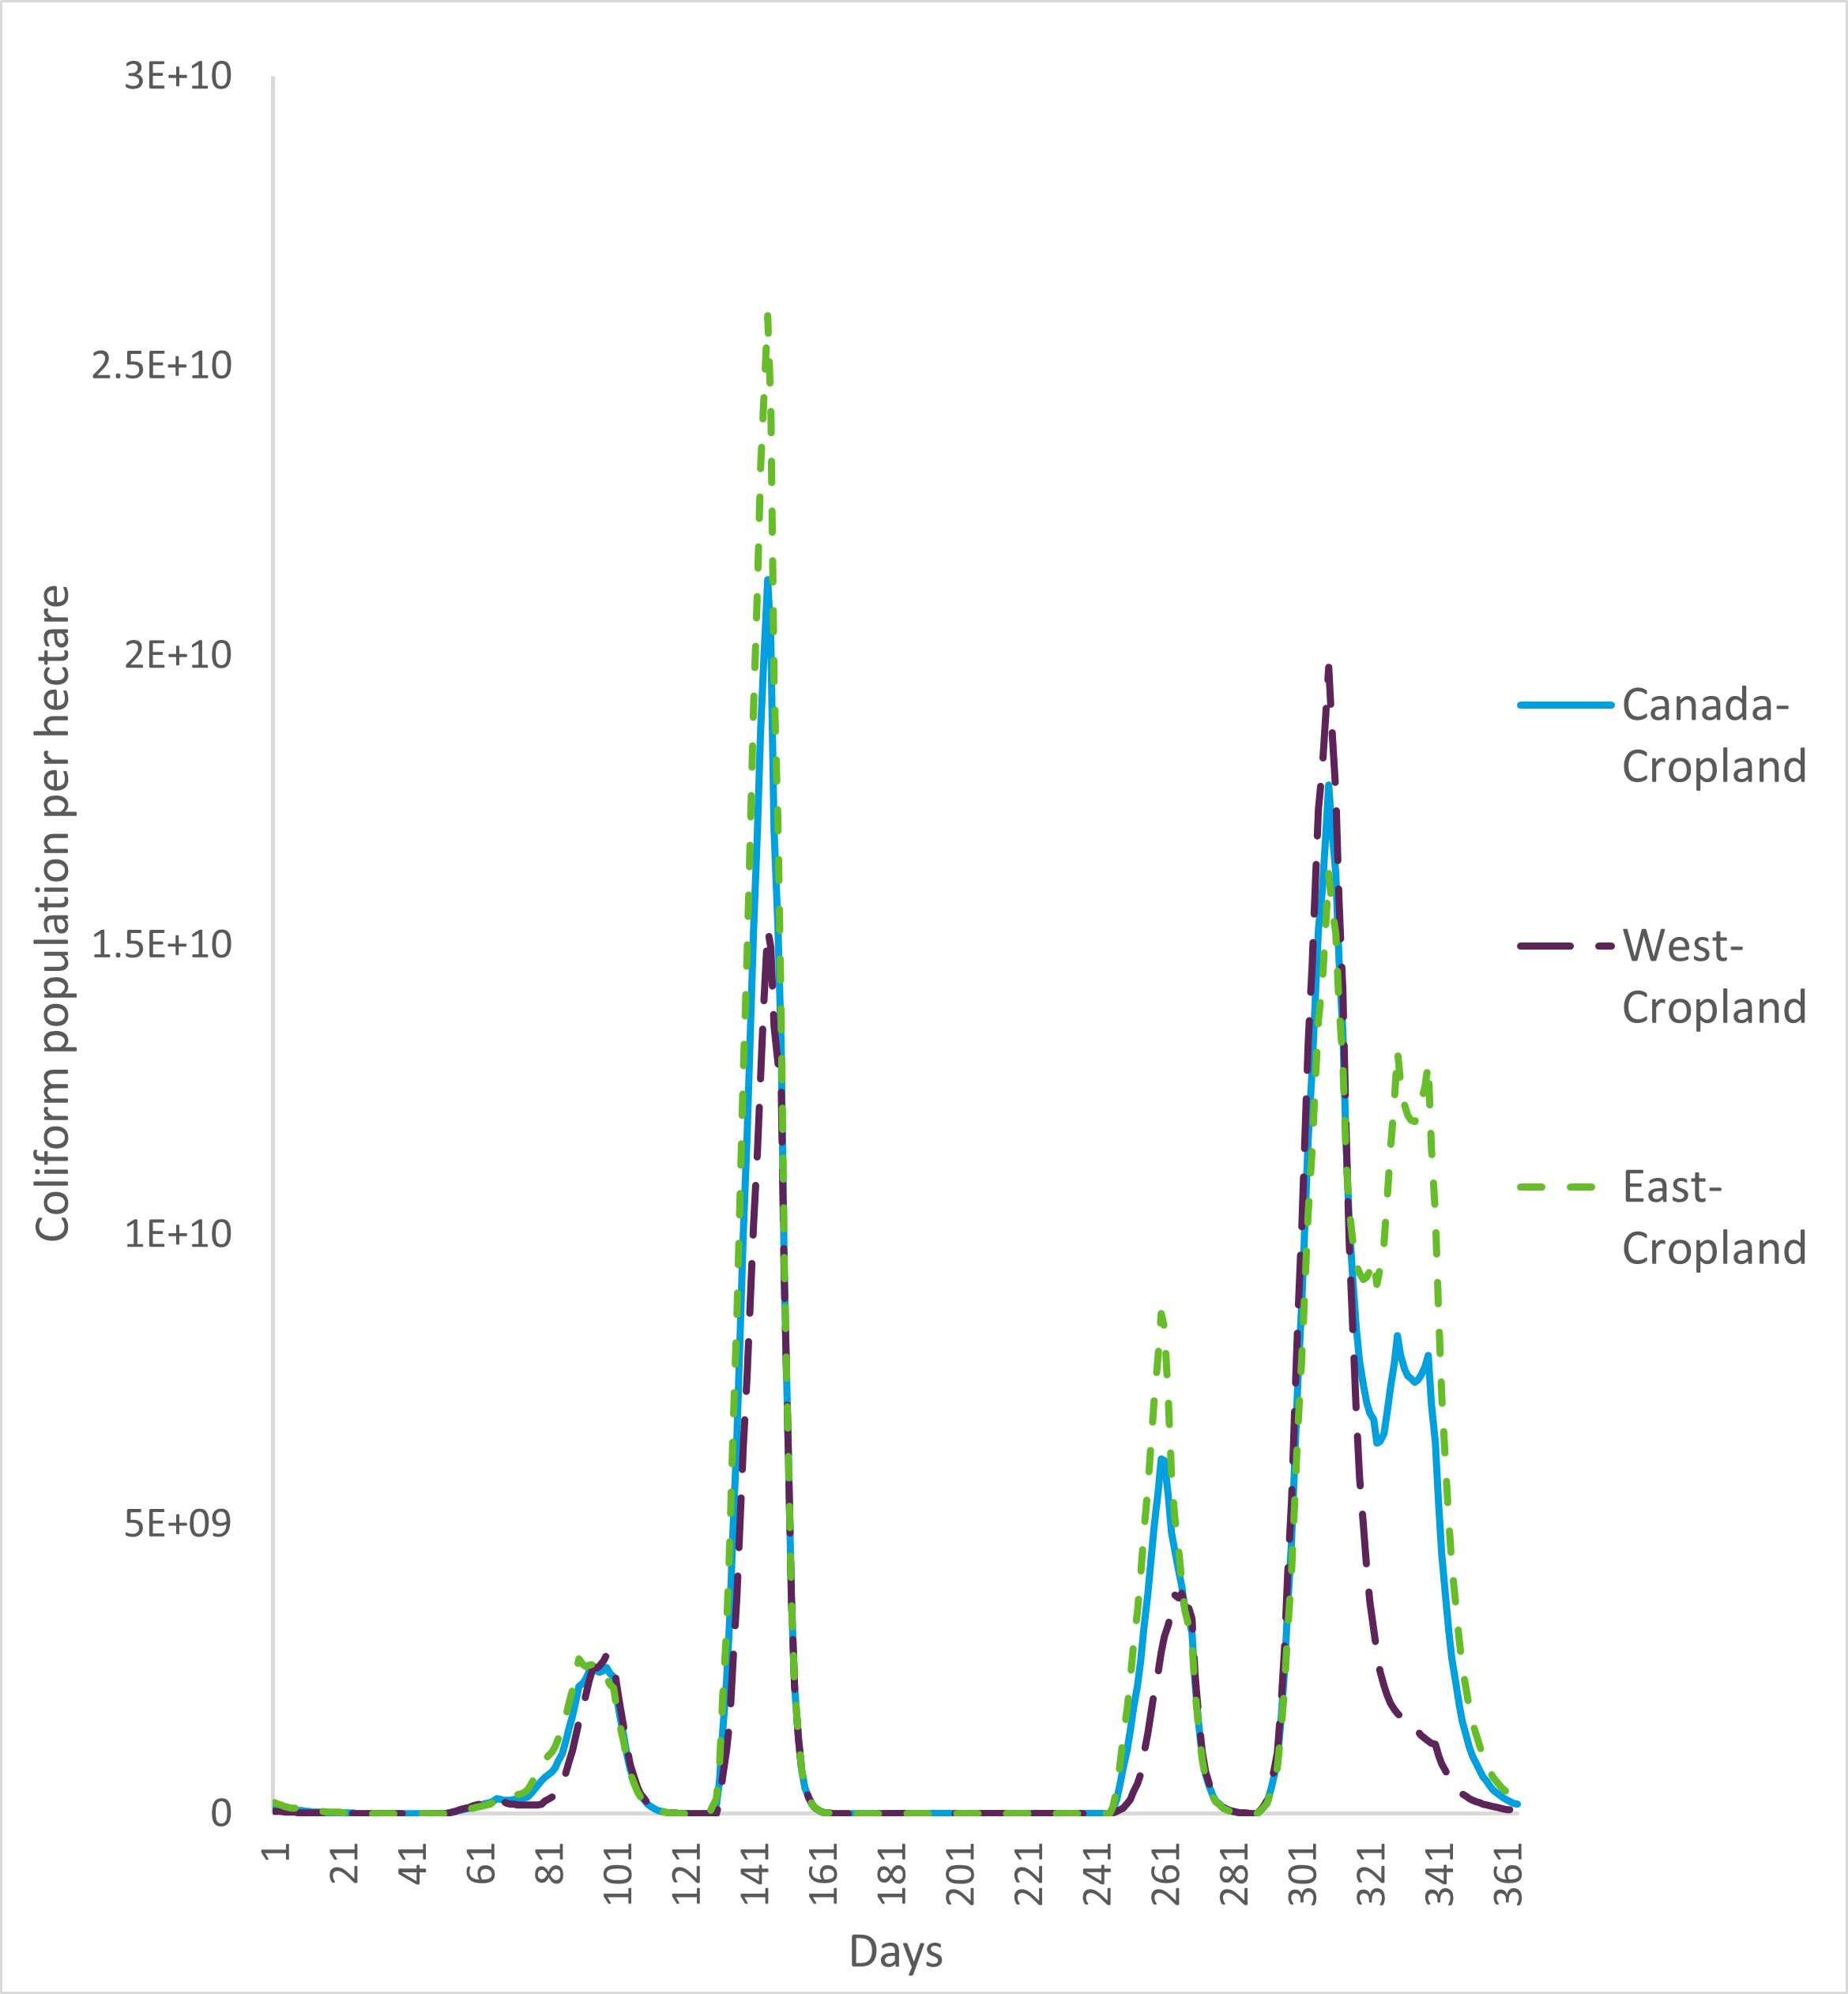
Figure 9: Daily mean coliform population on cropland, 2016
Description of Figure 9
Daily mean coliform population on cropland, 2016
| Day | Can-C | West-C | East-C |
|---|---|---|---|
| 1 | 1.47E+08 | 5.23E+07 | 2.18E+08 |
| 21 | 1.76E+07 | 7.62E+06 | 2.51E+07 |
| 41 | 2.71E+06 | 1.34E+06 | 3.76E+06 |
| 61 | 1.32E+08 | 1.53E+08 | 1.16E+08 |
| 81 | 6.30E+08 | 2.22E+08 | 9.39E+08 |
| 101 | 2.37E+09 | 2.63E+09 | 2.17E+09 |
| 121 | 6.29E+06 | 6.81E+06 | 5.89E+06 |
| 141 | 1.35E+10 | 8.87E+09 | 1.70E+10 |
| 161 | 5.90E+07 | 5.93E+07 | 5.87E+07 |
| 181 | 1.54E+03 | 1.61E+03 | 1.48E+03 |
| 201 | 0.00E+00 | 0.00E+00 | 0.00E+00 |
| 221 | 0.00E+00 | 0.00E+00 | 0.00E+00 |
| 241 | 0.00E+00 | 0.00E+00 | 0.00E+00 |
| 261 | 6.13E+09 | 2.79E+09 | 8.65E+09 |
| 281 | 5.67E+07 | 6.31E+07 | 5.19E+07 |
| 301 | 7.48E+09 | 8.57E+09 | 6.65E+09 |
| 321 | 7.11E+09 | 4.26E+09 | 9.26E+09 |
| 341 | 6.42E+09 | 1.20E+09 | 1.04E+10 |
| 361 | 2.78E+08 | 8.54E+07 | 4.23E+08 |
Response options
Nationally, manure excreted by pastured animals was the largest agricultural source of thermotolerant coliforms potentially available for transport to surface water. Direct access of animals to surface waterbodies, not currently reflected in the indicator model, presents a significant risk of contamination of water by coliforms. Fencing surface waterbodies will significantly reduce this risk.
For manure spreading, any practice that incorporates manure into the soil immediately or shortly after application will substantially reduce the risk of coliform transport to streams via surface flow, and may also reduce losses through tile flow due to the disruption of soil channels during the incorporation process. Also, efforts to minimize soil water erosion on lands receiving manure will reduce transport to adjacent surface water. Practices that reduce the amount of manure per animal production unit, and manure handling practices that stabilize the waste (for example composting) will reduce the coliform population and thus the risk of water contamination by coliforms from livestock production.
The agriculture industry has moved towards the intensification of animal production operations, both with respect to the size of individual farms and their proximity within regions. Under these conditions, where the nearby land base is too small to accept the waste sustainably, strategies to reduce the microbial loads in manure become more important. For example, the increasing costs of energy and inorganic crop nutrients (N and P) can result in increased adoption of advanced manure management techniques such as biogas digesters and slurry fractionation that stabilize manures and capture nutrients.
A number of practices can mitigate the transport of microorganisms to adjacent water. These include using fencing to deny access of pastured animals to streams, and discouraging access through off-site watering. Spread-manure transport risks can be managed by establishing suitable spreading set back distances from waterbodies or streams, establishing buffer strips around waterways, and considering slope, antecedent soil moisture and climate conditions at the time of application.
The use of IROWC-Coliform identifies the regions where the risk of water contamination from fecal contamination is high. A detailed analysis of the IROWC-Coliform components and the agricultural activities of these high-risk regions can reveal regional characteristics responsible for the high risk. Depending on the recurrence of such regional characteristics, research or intervention priorities can be put in place, with policies targeting beneficial management practices (BMPs) to mitigate the risk. Most BMPs are costly with respect to labour, cultivated land loss or farm expenses. Research priorities should include investigation of ways to make BMPs more acceptable and receivable at the farm level. For example, implementation of buffer strips with harvestable plant species such as switchgrass, shrubs and trees should be evaluated. Finally, research priorities should seek to develop specific source components for other waterborne pathogens that present a threat for both human and ecosystem health.
For more information
Risk of Water Contamination by Coliforms
Related indicators
- The Nitrogen Indicator tracks the risk of water contamination from nitrogen.
- The Phosphorus Indicator examines risk to water from phosphorus.
- The Pesticide Indicator examines risk to water from pesticides.
Additional resources and downloads
Discover and download geospatial data related to this and other indicators
References
- American Society of Agricultural Engineers (2003). Manure production and characteristics. ASAE D384.1 FEB03
- Himathongkham, S., Gahari, S., Riemann, H., & Cliver, D. (1999). Survival of escherichia coli O157 :H7 and salmonella typhimurium in cow manure and cow manure slurry. Fems Microbiology Letters 178 251-257.
- Reid, K., Schneider, K., El Khoury, A. (2022). Risk of Water Contamination by Phosphorus (IROWC-P)
- van Bochove, E., Topp, E., Thériault, G., Denault, J.-T., Dechmi, F., Rousseau, A. N. and Allaire , S. E. (2010a). Risk of Water Contamination by Coliforms. Pages 94 - 100 in W. Eilers, R. MacKay, L. Graham, A. Lefebvre, eds. Environmental Sustainability of Canadian Agriculture, Agri-Environmental Indicator Report Series, Report #3. Agriculture and Agri-Food Canada, Ottawa, Canada.
- van Bochove, E., Thériault, g., Denault, J.-T., Dechmi, F., Rousseau, A. N. and Allaire , S. E. (2010b). Risk of Water Contamination by Phosphorus (IROWC-P). Pages 87 - 93 in W. Eilers, R. MacKay, L. Graham, A. Lefebvre, eds. Environmental Sustainability of Canadian Agriculture, Agri-Environmental Indicator Report Series, Report #3. Agriculture and Agri-Food Canada, Ottawa, Canada.