
The Phosphorus Indicator (official name: Indicator of the Risk of Water Contamination by Phosphorus) evaluates the relative risk of surface water contamination by phosphorus across agricultural areas in Canada. This indicator has tracked phosphorus risk associated with Canadian agricultural activities from 1981 to 2016.
Overall state and trend
Phosphorus risk has been stable from 1981 to 2016, although there have been changes in the geographic distribution of risk. Southern Ontario has shown declines in risk, although these declines have been from very high to high risk categories. Quebec and Atlantic Canada have shown increases in risk, although these have been ameliorated by the soils with high capacity for holding phosphorus. There are some areas of increased risk in the Prairies, but these are generally from the very low to low or moderate risk categories.
Use the interactive map below to zoom in and explore different regions. Note that in the Prairies, risk is considered to be moderate, with pockets of low and very low risk in north and central regions as well as pockets of high and very high risk in southern Saskatchewan and Manitoba as well as in central Alberta. The pockets of higher risk can be attributed to a combination of phosphorus source—where phosphorus levels in the soil have been increasing as a result of mineral fertilizer use and manure from livestock production—and phosphorus transport to surface water bodies. Risk of contamination is also high in the Lower Fraser Valley Region of British Columbia and is attributed to a higher concentration of livestock production in that area. Risk is lower, but increasing steadily, in Eastern and Atlantic Canada.
From 1981 to 2016 there has been an increase in risk in all agricultural regions of Canada. This has been especially evident in the Prairie Provinces, along with significant increases in parts of Eastern Canada, the Peace River Region of northern Alberta and the Lower Fraser Valley Region of British Columbia.
| Very Low | Low | Moderate | High | Very High |
You can also explore the change in the risk of contamination by phosphorus in the interactive map in Figure 2. This map uses a colour scheme, where the darker colours indicate the higher risk for the period between 1981 and 2016. The change in risk is occurring across Canada.
| Two or more class decreased risk | One class decreased risk | No change | One class increased risk | Two or more class increased risk |
Phosphorus performance index
The state and trend of the Phosphorus Indicator can also be seen in the performance index below.
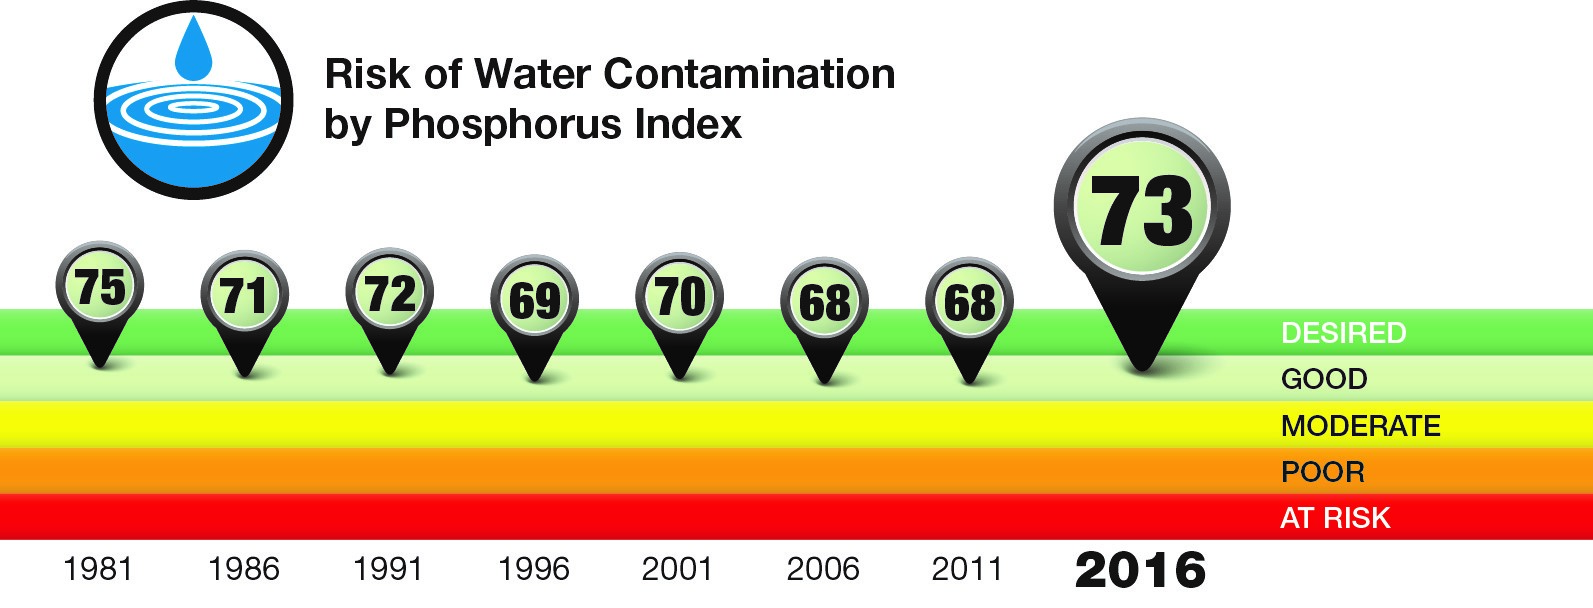
Description - Figure 3
| Year | Index Value |
|---|---|
| 1981 | 75 |
| 1986 | 71 |
| 1991 | 72 |
| 1996 | 69 |
| 2001 | 70 |
| 2006 | 68 |
| 2011 | 68 |
| 2016 | 73 |
In 2016, the state of the environment, as it relates to phosphorus risk resulting from farming activities in Canada, was in the "Good" category. The index illustrates a fairly stable trend. Phosphorus contamination occurs when there is both a source of phosphorus as well as means of transport, for example high snowmelt or rainfall runoff. The source component has increased somewhat due to the use of mineral fertilizers over the last 35 years and the intensification of livestock production in some regions.
The index tends to aggregate and generalize trends and so should be viewed as a policy tool to give a general overview of state and trend over time.
Specific trends
- Trend 1 – Phosphorus build-up in soils across Canada
- Trend 2 – Weather affects phosphorus losses in any given year
This section highlights a few other trends of interest. In some cases, these are occurring in certain regions and in others they are affecting certain sectors, such as the beef or dairy industries. This is not an exhaustive list; additional findings can be found in the full publication: Environmental Sustainability of Canadian Agriculture, Agri-Environmental Indicator Report Series - Report #4 .
Trend 1 - Phosphorus build-up in soils across Canada
Phosphorus is bound tightly to soil particles, so only a fraction of phosphorus applied as fertilizer or manure is available to the crop in the year that it is applied. Additionally, manure applied to meet the nitrogen requirements of crops will supply more phosphorus than those crops require. As a result, the application rates often exceed the amount removed with the crop when it is harvested. In other words, phosphorus accumulates in the soil over time, creating a positive phosphorus balance. In addition to being removed with the crop, this built-up phosphorus can be removed via runoff of rainfall or snowmelt. The greater the store of accumulated phosphorus in the soil, the greater amount can be released into runoff water, creating a risk to nearby water bodies. Some provinces carry quite large phosphorus balances as phosphorus continues to accumulate in soils over time.
Figure 4 (below) shows the annual phosphorus balance by province (combined for the Atlantic Provinces) from 1981 to 2016. The highest phosphorus balance values have been recorded in the Atlantic Provinces (intensive livestock and potato production), followed by Quebec (intensive livestock production), British Columbia (intensive livestock and horticultural production) and Ontario. The trend in Eastern Canada has been towards a declining phosphorus balance, but the balance is still slightly positive in Ontario. Southern Ontario had accumulated significant stores of phosphorus in the soil prior to 1981, which increased the risk of phosphorus loss at the start of the study period. It is now the province that is closest to balancing phosphorus inputs and outputs, a small accumulation of phosphorus in the soil still occurs each year. In contrast, the Prairie Provinces had zero or negative phosphorus balances for the first few Census years, but this trend has been reversed with the intensification of production and increases in fertilizer use. The greatest increase has been recorded in Manitoba.
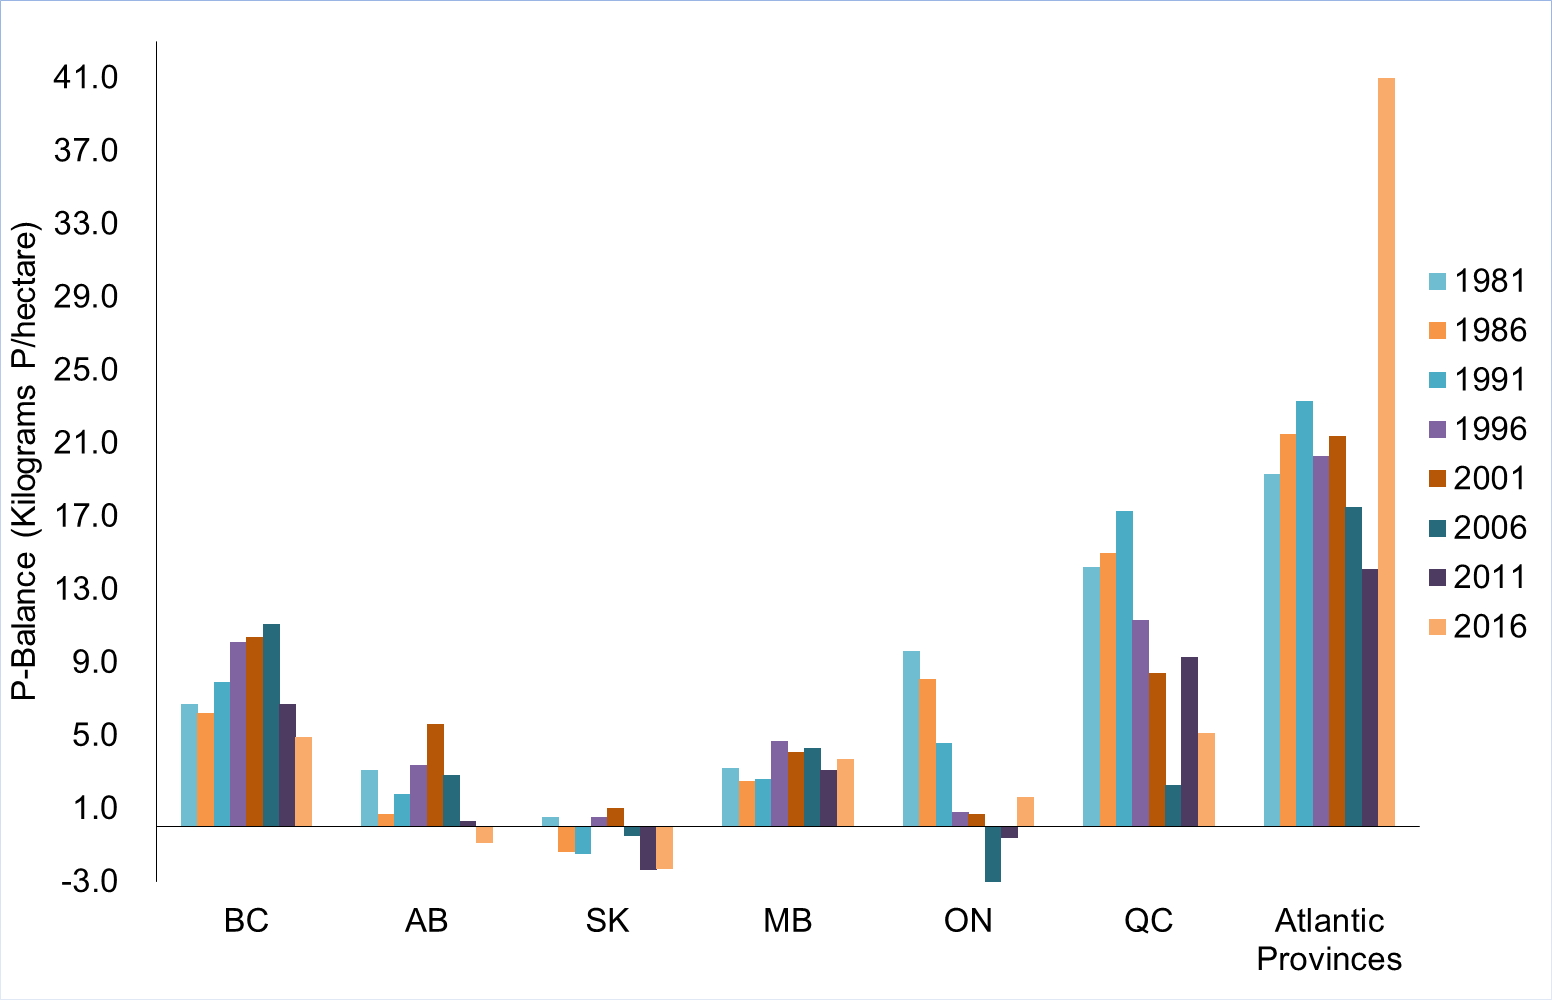
Description - Figure 4
| 1981 | 1986 | 1991 | 1996 | 2001 | 2006 | 2011 | 2016 | |
|---|---|---|---|---|---|---|---|---|
| British Columbia | 6.7 | 6.2 | 7.9 | 10.1 | 10.4 | 11.1 | 6.7 | 4.9 |
| Alberta | 3.1 | 0.7 | 1.8 | 3.4 | 5.6 | 2.8 | 0.3 | −9 |
| Saskatchewan | 0.5 | −1.4 | −1.5 | 0.5 | 1.0 | −0.5 | −2.4 | −2.3 |
| Manitoba | 3.2 | 2.5 | 2.6 | 4.7 | 4.1 | 4.3 | 3.1 | 3.7 |
| Ontario | 9.6 | 8.1 | 4.6 | 0.8 | 0.7 | −4.5 | −0.6 | 1.6 |
| Quebec | 14.2 | 15 | 17.3 | 11.3 | 8.4 | 2.3 | 9.3 | 5.1 |
| Atlantic Provinces | 19.3 | 21.5 | 23.3 | 20.3 | 21.4 | 17.5 | 14.1 | 41 |
*Atlantic provinces include New Brunswick, Nova Scotia, Prince Edward Island and Newfoundland and Labrador.
Trend 2 – Weather affects phosphorus losses in any given year
Previous versions of this indicator had used annual weather, which created large variation from year to year in apparent losses that masked the influence of management practices. This report uses data that has been modelled using a synthetic weather file that reflects the normal range of weather conditions at each location, but uses the same weather for each year.
Why this indicator matters
Phosphorus is an essential nutrient for all plants and animals. It is applied to soils in the form of fertilizers, manures and biosolids in order to maintain crop yields. Since the early 1950s, intensified cropping and animal production have increased soil nutrients in some regions to levels exceeding crop needs. These surpluses have enriched the soil and increased the risk of transport from agricultural fields to surface water bodies. Excessive inputs of phosphorus can contribute to eutrophication of freshwater and development of algal blooms, which can lead to the deterioration of water quality and to restrictions on the use of water bodies for drinking water and recreational activities, such as swimming. The loss of soil phosphorus is not only an environmental concern; it represents an economic loss to producers since this valuable nutrient is not available for crop production.
Agriculture has the potential to mitigate risk from phosphorus by implementing beneficial management practices (BMPs) that reduce application rates or that prevent phosphorus from reaching water bodies.
Beneficial management practices
Strategies for reducing the risk of water contamination by phosphorus include better matching the amount of phosphorus applied with the needs of crops and reducing the risk of transport to surface water.
Soil testing is an essential step for measuring how much phosphorus is in the soil prior to the application of fertilizer or manure, which can then be adjusted accordingly. The addition of forages or other crops that have a high phosphorus uptake into crop rotations can help remove excess phosphorus and reduce the soil's phosphorus balance. Livestock producers can reduce the phosphorus content of manure by switching to feed containing the enzyme phytase, which helps animals digest phytate, the principal storage form for phosphorus in plant material. Because surface runoff is such an important transport mechanism, it is critical that fertilizers and manures only be applied in suitable weather conditions and with the recommended application techniques. Buffer strips established around surface water bodies can help to trap and filter particulate phosphorus from surface runoff, and the use of plant species that have an economic value can help offset the cost of implementing and maintaining these structures.
About the performance indices
The agri-environmental performance index shows environmental performance state and trends over time, based on weighting the percentage of agricultural land in each indicator class, such that the index ranges from 0 (all land in the most undesirable category) to 100 (all land in the most desirable category). An index value that is increasing over time suggests improving environmental performance, while a decreasing index value suggests deteriorating environmental performance over time.
Related indicators
- The Nitrogen Indicator tracks the risk of water contamination from nitrogen.
- The Coliforms Indicator calculates the risk of water contamination from agricultural coliforms.
- The Pesticide Indicator examines risk to water from pesticides.
Additional resources and downloads
- For detailed information on this indicator please see the publication entitled Environmental Sustainability of Canadian Agriculture, Agri-Environmental Indicator Report Series - Report #4.
- Discover and download geospatial data related to this and other indicators.