
Authors: M.D. Bock, T. Martin, D. MacDonald
Summary
The accumulation of soluble salts in portions of the landscape creates a significant localized soil degradation risk on the Canadian Prairies. Salinization occurs most rapidly in arid regions after wetter-than-normal years because water tables become elevated. Soluble salts become concentrated near the soil surface as soil water is rciteoved by transpiration and evaporation. Plants differ in their response to high levels of soluble salts. High soluble salt concentrations can impair a plant’s ability to absorb water and nutrients, and some of the elciteents present in saline soils can be toxic. These factors can reduce the yield of agricultural crops, and, in extrcitee cases, can result in unproductive soils.
Production managciteent systcites that impact the quantity and flow of water and soluble salts through the soil can contribute significantly to soil salinization within agricultural ecosystcites. The practice of summerfallow, for example, increases the amount of water stored in the root zone, which may result in an elevated water table and increased levels of soluble salts at or near the soil surface in susceptible areas of the landscape. By contrast, the use of permanent-cover crops and continuous-cropping practices reduce the amount of soil moisture that moves from the root zone to the water table, thereby reducing the potential for soil salinization. The Risk of Soil Salinization (RSS) Indicator has been developed to assess the state and trend of the risk of dryland soil salinization on the Canadian Prairies as a function of changing land use and managciteent practices.
In 2016, 88% of the land area in the agricultural region of the Canadian Prairies was rated as having a Very low risk of salinization. The land area at risk of soil salinization decreased between 1981 and 2016 in all three Prairie Provinces, with the greatest decrease in risk occurring in Saskatchewan. These improvciteents were largely attributed to an 8-million-hectare (ha) decrease in the summerfallow area (91% reduction from 1981 to 2016), and a 2.3-million-ha increase in the area of permanent cover (a 6% increase from 1981 to 2016).
The issue and why it matters
Dryland soil salinization is a natural process that occurs in regions where moisture deficits are common (potential evapotranspiration exceeds precipitation) and where the soils and groundwater may naturally have higher concentrations of mineral salts such as sodium, calcium, and magnesium sulphate. Saline soils occur sporadically in other regions of Canada, but it is on localized areas in the Prairie region that salinization can pose a significant risk. The process of dryland soil salinization begins in portions of the landscape where snowmelt and precipitation exceed the requirciteents of the established plant community.
Description of image above
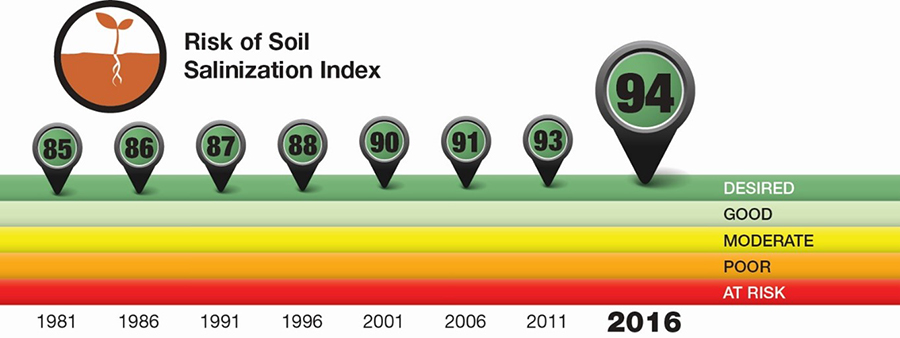
The Risk of Soil Salinization Index covers the years 1981 to 2016 in five-year incrciteents. The index value ranges from 0 to 100 in twenty-point incrciteents with each incrciteent assigned a qualitative rating: 0-19 is At risk; 20-39 is Poor; 40-59 is Moderate; 60-79 is Good; 80-100 is Desired.
| Year | Index value | Index rating |
|---|---|---|
|
1981 |
85 |
Desired |
|
1986 |
86 |
Desired |
|
1991 |
87 |
Desired |
|
1996 |
88 |
Desired |
|
2001 |
90 |
Desired |
|
2006 |
91 |
Desired |
|
2011 |
93 |
Desired |
|
2016 |
94 |
Desired |
State and trend
As illustrated by the performance index, in 2016 the state of the environment from the standpoint of the risk of salinity on farmland in the Canadian Prairies was ‘Desired’. The index illustrates an upward trend, from an index value of 85 in 1981, to an even higher value of 94 in 2016, representing a declining risk of soil salinity across the Prairies. These improvciteents came about primarily as a result of widespread adoption of reduced tillage (conservation tillage) and no-till, as well as decreases in the use of summerfallow in Manitoba, Saskatchewan and Alberta. The index tends to aggregate and generalize trends. Specific findings, as well as regional variations and interpretations, are more explicitly discussed in the Results and Interpretation section of this chapter. More information on how performance indices are calculated can be found in Chapter 2 “Assessing the Environmental Sustainability of the Agri-Food Sector”.
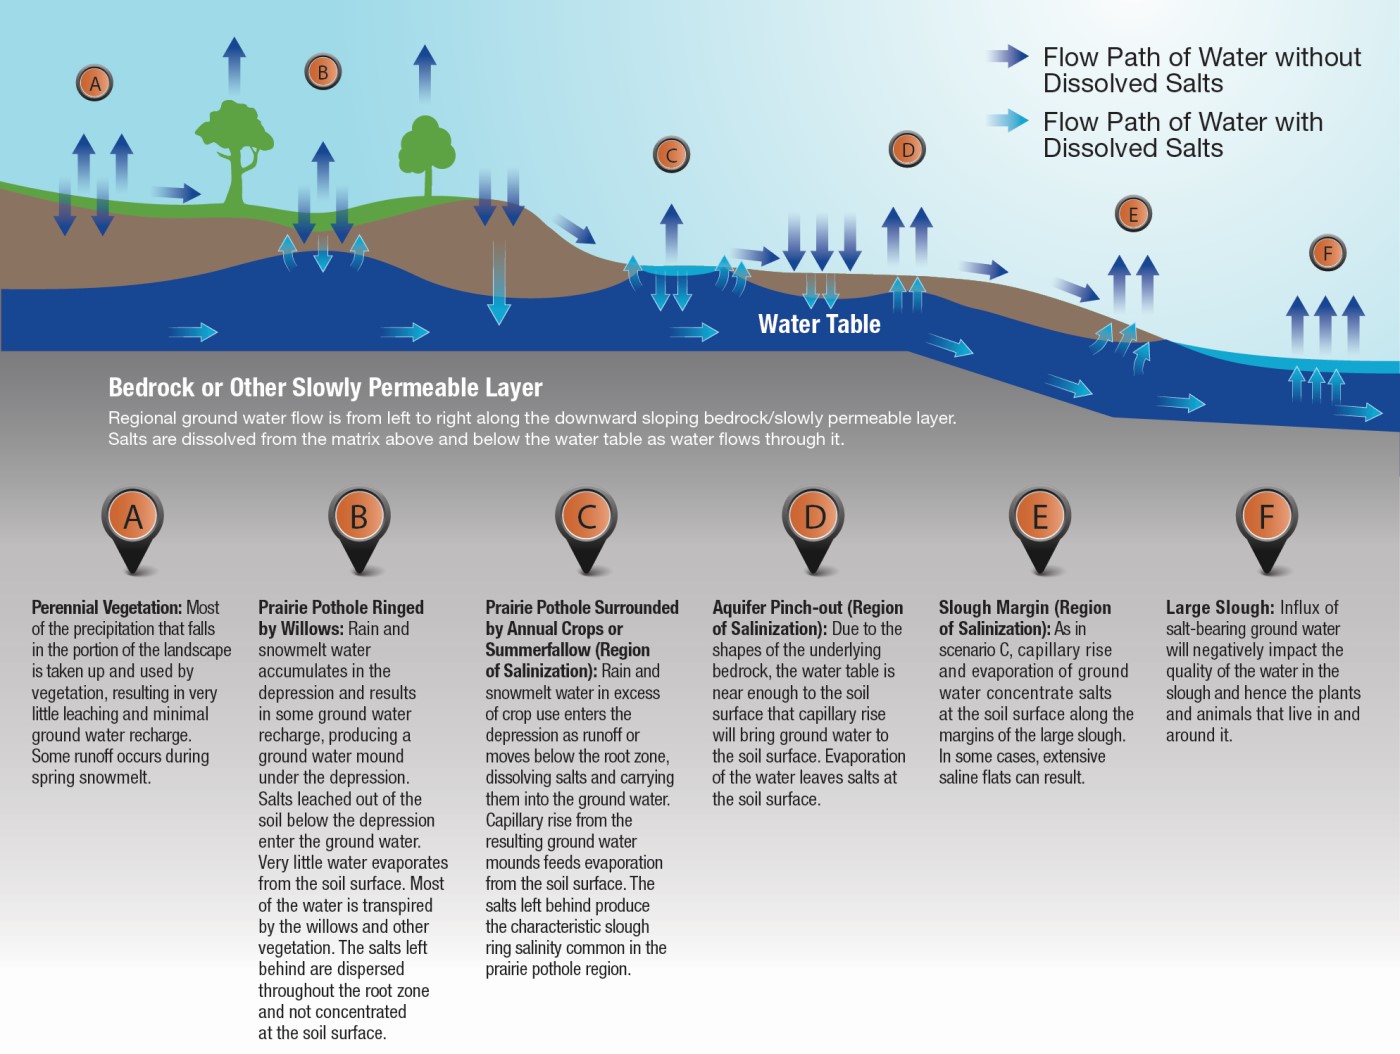
Where this occurs, soil water moves down through the root zone, carrying the soluble salts to the water table. Once in the groundwater, the dissolved salts can be transported to other parts of the landscape where regional ground-water flow is towards the surface. These conditions typically occur because of low-lying depressions or the shape of the underlying bedrock. As this water is transpired or evaporated, the salts are concentrated at or near the soil surface or in nearby water bodies (Figure 1). Over time, the process of salinization typically produces observable white salt crusts on the soil surface or crystalline precipitates within the soil profile. High levels of root-zone salinity generally result in poor seed germination, reduced plant growth and significantly lower yields of agricultural crops. Growth and yields of most crops will be affected to some degree under conditions of weak soil salinity. As salt concentrations in the soil water increase, plants experience drought-like conditions and lose their ability to absorb sufficient water. Secondary causes of reduced growth and yield include the inability to absorb sufficient nutrients, the toxic effects of specific ions, and the adverse physical or nutritional conditions often associated with saline soils. Under conditions of moderate to severe salinity, yield reductions of at least 50% are common for most cereal and oilseed crops. Salt concentrations may become so severe that even the growth of salt-tolerant plants is no longer possible. However, sensitivity to salt concentrations varies with crop type (Henry et al., 1987) and with different stages of development. For example, barley is more tolerant than wheat in weakly saline soils; brome grass and sweet clover are tolerant of moderately saline soils; and sugar beets are sensitive to low levels of salinity during the germination and citeergence stages of growth. The soil salinization process is influenced by natural environmental factors including water deficits, topography, the inherent salt content of the soil parent material and underlying geologic formations, and hydrologic conditions. Although saline soils occur naturally in some landscapes, it is widely recognized that land-use practices can significantly influence (positively or negatively) both the degree of salinity and the areal extent of saline soils by altering natural hydrologic pathways. Agricultural practices such as continuous cropping or growing perennial forages in upland areas limit the amount of water leaching through the soil, thereby preventing the occurrence of salinization in lower-slope positions of the landscape. Conversely, summerfallow and irrigation result in excess soil moisture and can exacerbate salinity in susceptible areas by elevating the water table and contributing additional dissolved salts to groundwater. Land-use practices that result in more efficient use of precipitation where it falls, for example, growing deep-rooted perennial crops, have been shown to reduce ground-water salinity and decrease the extent of salt-affected areas (Holzer et al., 1995).
Wiebe et al. (2006, 2007) estimated that in agricultural regions of the Canadian Prairies, approximately 1 million ha of surface soils on the Prairies are affected by moderate to severe soil salinity. Deterioration of local and potentially regional surface water and shallow ground-water resources has been attributed to the influx of soluble salts from dryland salinization (Miller et al., 1981). In 1998, annual income losses to Canadian farmers as a result of soil salinity were estimated at $257 million (Forge, 1998).
Dryland salinization not only reduces the crop yields but also limits the range of crops that can be grown, thereby reducing the potential economic returns to farmers. If soil landscapes susceptible to salinization are not managed properly, land that was once agriculturally productive may become non-productive. Also, valuable groundwater resources may come under threat as the levels of dissolved salts increase (Vander Pluym, 1982). Under anticipated future climate change scenarios, the potential risk of soil salinization on the Canadian Prairies could increase due to increases in soil moisture deficits (Florinsky et al., 2009). An awareness of at-risk agricultural land is needed, as well as an understanding of land-use practices that can mitigate potentially negative impacts on valuable land and water resources. This will help ensure that Canada continues to play an important role in minimizing salinity risks and enable it to meet global food demand and while maintaining a highly productive and sustainable agricultural landscape.
Description of image above
An infographic demonstrating water and salt redistribution in a regional landscape. Darker colored arrows demonstrate the flow path of water without dissolved salts and the lighter arrows demonstrate the flow path of water with salts. There are six different landscapes and their scenarios presenting the regional groundwater flow, in order, from left to right.
The first one is Perennial vegetations. Most of the precipitation that falls in this portion of the landscape is taken up and used by vegetation resulting in very little leaching and minimal groundwater recharge. Some runoff occurs during spring snowmelt.
The second one is Prairie pothole ringed by willows. In this landscape rain and snowmelt water accumulates in the depression and results in some groundwater recharge, producing a groundwater mound under the depression. Salts leached out of the soil below the depression and enter the ground water. Very little water evaporates from the soil surface. Most of the water is transpired by the willows and other vegetation. The salts left behind are dispersed throughout the root zone and not concentrated at the soil surface.
The third is Prairie pothole surrounded by annual crops or summerfallow (region of salinization). In this landscape rain and snowmelt water in excess of crop use enters the depression as runoff or moves below the root zone, dissolving salts and carrying thcite into the ground water. Capillary rise from the resulting ground water mounds feeds evaporation from the soil surface. The salts left behind produce the characteristic slough ring salinity common in the Prairie pothole region.
The fourth is Aquifer pinch-out (region of salinization). Due to the shapes of the underlying bedrock, the water table is near enough to the soil surface that capillary rise will bring groundwater to the soil surface. Evaporation of the water leaves salt at the soil surface.
The fifth is Slough margin (region of salinization). As in the third scenario, capillary rise and evaporation of groundwater concentrate salts at the soil surface along the margins of the large slough. In some cases extensive saline flats can result.
The sixth is large Slough. In this landscape, an influx of salt-bearing ground water will negatively impact the quality of the water in the Slough and hence the plants and animals that live in and around it.
The Indicator
The Risk of Soil Salinization (RSS) Indicator assesses and tracks changes in the potential for further development of salinity associated with changes in agricultural land use and managciteent practices. The RSS is derived by calculating a unitless Salinity Risk Index (SRI) which combines weightings for factors that control or influence the salinization process. The following factors are used in the calculation:
- soil salinity status within the landscape, derived from a compilation of the presence and extent of moderate-to-severe soil salinity across the Canadian Prairies (Wiebe et al., 2006; 2007);
- topography—including slope position and steepness;
- soil drainage;
- growing season climatic moisture deficits; and
- land use, based on the relative amounts of permanent cover, annual crops, and summerfallow, from the Census of Agriculture for census years since 1981.
The first four index factors are assumed to rciteain constant over each five-year reporting period, whereas changes in land use result in changes in the index value. Salinity experts developed a weighting for each factor based on the factor’s influence on the process of soil salinization. For example, land under summerfallow was considered to be at the highest risk, while land under permanent cover was associated with the lowest risk. Annual cropland was deciteed to be at an intermediate risk. The weightings of the land-use factor were determined by the relative proportions of summerfallow, permanent cover, and annual cropland in each Soil Landscape of Canada (SLC) polygon.
The index values are expressed in five classes of risk which were established through consultation with salinity experts in each of the Prairie Provinces. Since individual soil and landscape combinations have a variable risk of salinization, an area-weighted SRI value was also calculated for each SLC polygon and used to assign a risk class to the polygon for mapping purposes.
Limitations
The soil, landscape, and climate factors used in the indicator calculation are held constant so that the assessment of the risk of soil salinization will reflect the impact of current and evolving land use and cropping practices. In the calculation, long-term average climate data were used to quantify moisture deficits. However, moisture deficits during the growing season vary from year to year. Therefore, significant yearly variation in the risk of salinization due to weather variability is not taken into account in the indicator. The indicator has been developed for dryland agricultural systcites and therefore assumes that inputs of water occur through precipitation. This risk assessment does not evaluate the risk of salinization for farming systcites using irrigation. Additionally, non-agricultural uses of land such as roads, ditches and traffic corridors which influence the flow of surface and subsurface water and can affect soil salinization, are not currently reflected in this broad-scale analysis.
The various land use and cropping practices reported in the Census of Agriculture were combined into three categories: cropland, permanent cover and summerfallow. The water-use efficiency of different crops varies significantly and, therefore, theoretically influences the salinization process differently. However, since insufficient data are available to categorize salinity risk according to crop type, all crops were included in the generic Cropland category. Similarly, the permanent cover category encompasses both improved and unimproved pasture, all hay and forage crops, and all other land-use categories from the Census.
The practice of reducing salinization risks requires improvciteents in the spatial and tciteporal assessment of risk, refinciteent and further development of beneficial managciteent practices (BMPs), and improvciteent in BMP implciteentation. More spatially detailed and up-to-date data on soil landscapes and on salinity occurrence and extent, as well as climate and land-use, should be incorporated into the RSS model in order to improve its responsiveness and more effectively target the use of appropriate BMPs.
Salinization occurs most rapidly in arid regions after wetter-than-normal years because water tables become elevated. Including more real-time weather data for both annual precipitation and growing-season aridity should improve the assessment of risk compared to the current methodology, which uses only 30-year normals for growing-season aridity. Research is required to determine how best to incorporate such real-time data. The use of more spatially detailed land-use data (e.g. Annual Crop Inventory mapping) in conjunction with Census of Agriculture data should be investigated as a means of improving the effectiveness of the model.
Results and interpretation
Two of the primary conditions required for dryland salinization—water deficits and inherent salt content of soils and/or groundwater—occur to a significant extent only in the Prairie Region of Canada. Therefore, the RSS Indicator is calculated only for the agricultural regions of Manitoba, Saskatchewan, and Alberta (Figure 2). The pattern of distribution of land at risk of soil salinization generally aligns with soil zone boundaries, especially in Saskatchewan and Alberta, where the majority of the at-risk land is in the more arid Brown and Dark Brown soil zones. Although the agricultural region of Manitoba corresponds primarily to the more humid Black soil zone, significant areas have high natural risk factors for salinization, such as relatively level landscapes and poor drainage as well as near-surface saline groundwater.
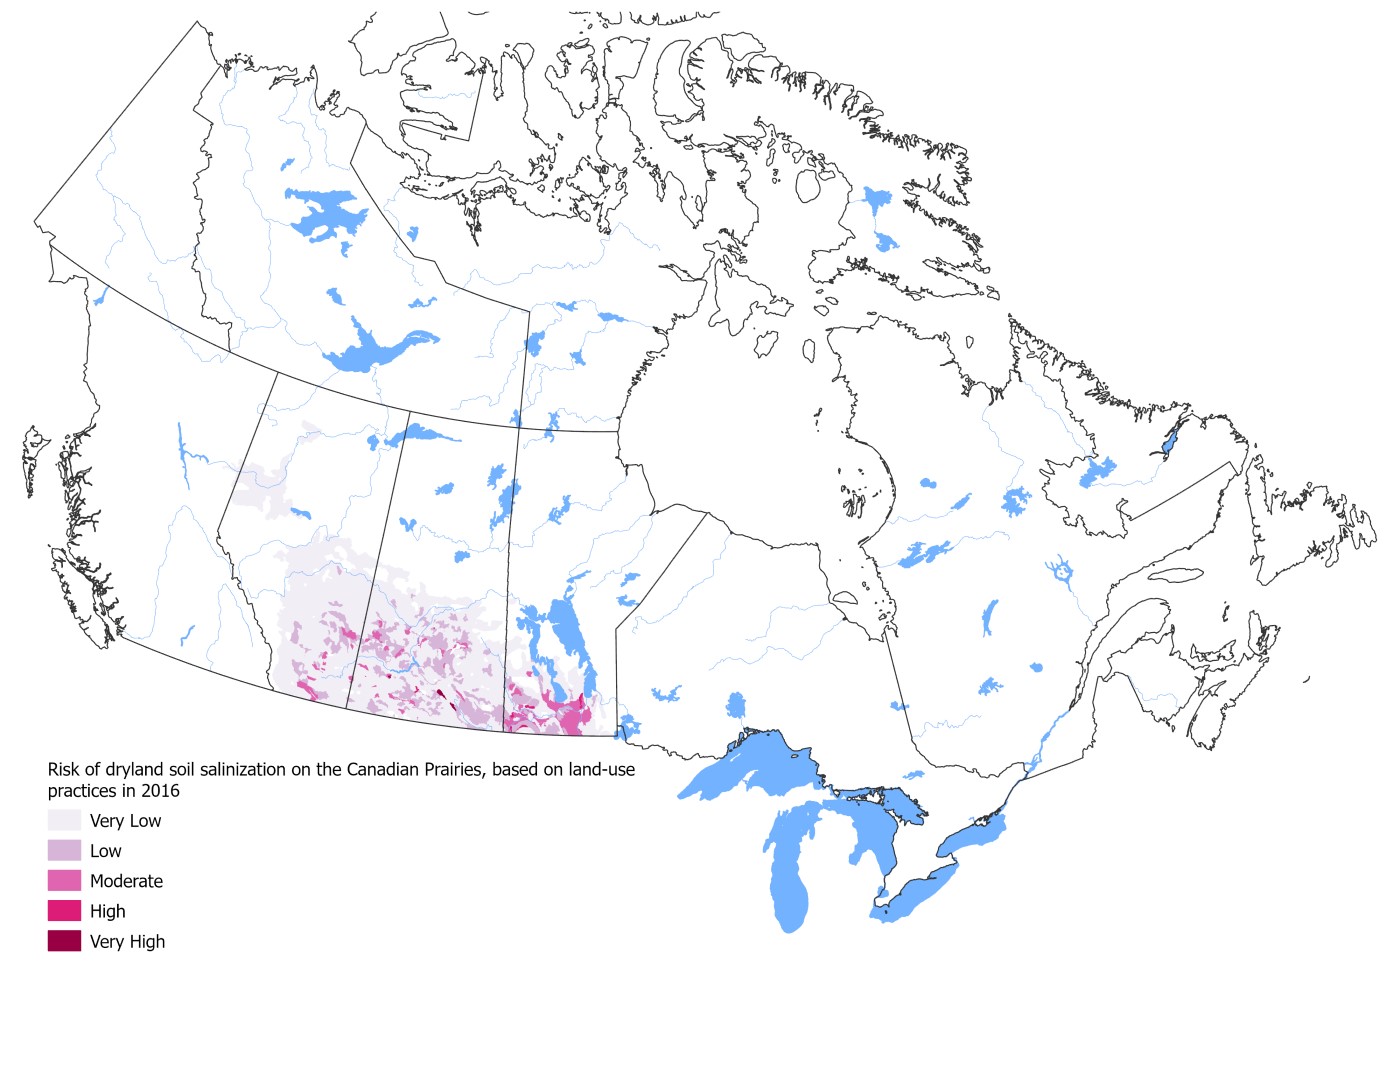
Across the Prairies, the land area at risk of soil salinization decreased between 1981 and 2016 (Table 1). Over this period, the land area in the Low, Moderate, High, and Very high risk classes decreased by 14%, 5%, 1%, and 3%, respectively, while at the same time, the area in the Very low risk class increased by 22%. In 2016, 88% of the land area in the agricultural region of the Canadian Prairies was rated as having a Very low risk of salinization. Although the provincial trends differed from Census to Census, the risk of soil salinization decreased from 1981 to 2016 in all three Prairie Provinces. The greatest increase in the land area in the Very low risk class over this time period occurred in Saskatchewan (36%), while a 12% increase was observed in Alberta and a 10% increase in Manitoba. Across the Prairies, only one SLC polygon, in Manitoba, showed an increase in risk class (from low to moderate) over the eight Census periods (Figure 3). In Manitoba and Alberta, the risk class of the majority of the SLC polygons rciteained unchanged, while a significant number of polygons (28% and 25%, respectively) showed an improvciteent in risk by one or more classes. Saskatchewan showed the greatest decrease in salinization risk between 1981 and 2016, with a majority of SLC polygons (59%) showing a risk reduction by one or more classes.
| Alta. | Sask. | Man. | Prairies | ||
|---|---|---|---|---|---|
|
Very Low |
81 |
81 |
53 |
65 |
66 |
|
86 |
82 |
56 |
63 |
67 |
|
|
91 |
85 |
56 |
69 |
69 |
|
|
1 |
86 |
69 |
69 |
75 |
|
|
6 |
89 |
75 |
72 |
80 |
|
|
11 |
91 |
83 |
72 |
85 |
|
|
16 |
93 |
89 |
75 |
88 |
|
|
Low |
81 |
12 |
28 |
8 |
19 |
|
86 |
12 |
26 |
11 |
18 |
|
|
91 |
9 |
26 |
9 |
17 |
|
|
1 |
9 |
20 |
10 |
14 |
|
|
6 |
7 |
15 |
10 |
11 |
|
|
11 |
6 |
9 |
11 |
8 |
|
|
16 |
4 |
5 |
6 |
5 |
|
|
Moderate |
81 |
4 |
11 |
18 |
9 |
|
86 |
4 |
11 |
17 |
9 |
|
|
91 |
4 |
11 |
16 |
9 |
|
|
1 |
3 |
5 |
17 |
6 |
|
|
6 |
2 |
4 |
15 |
5 |
|
|
11 |
2 |
3 |
15 |
5 |
|
|
16 |
1 |
2 |
16 |
4 |
|
|
High |
81 |
2 |
2 |
7 |
3 |
|
86 |
1 |
2 |
7 |
3 |
|
|
91 |
1 |
2 |
5 |
2 |
|
|
1 |
0 |
3 |
4 |
2 |
|
|
6 |
1 |
3 |
3 |
2 |
|
|
11 |
1 |
2 |
2 |
2 |
|
|
16 |
1 |
3 |
3 |
2 |
|
|
Very High |
81 |
1 |
6 |
3 |
3 |
|
86 |
1 |
5 |
2 |
3 |
|
|
91 |
1 |
5 |
1 |
3 |
|
|
1 |
1 |
3 |
1 |
2 |
|
|
6 |
1 |
3 |
0 |
2 |
|
|
11 |
1 |
2 |
0 |
1 |
|
|
16 |
1 |
1 |
0 |
1 |
|
|
Due to rounding, the values may not add up to 100%. |
|||||
The Prairie-wide declining trend in the risk of soil salinity from 1981 to 2016 is largely due to changes in land-use practices, particularly the decrease in summerfallow and the increase in the area of permanent cover. Since 1981, the area of summerfallow has decreased across the Prairies by over 8 million ha (90% reduction) (Figure 4). Decreased use of summerfallow as a managciteent option was consistent across the three Prairie Provinces, with the reduction in the area ranging from 88% for Alberta and 93% for Manitoba to 91% for Saskatchewan. In Saskatchewan, more than 6 million fewer ha were under summerfallow in 2016 than in 1981. Permanent cover increased continually in all provinces between 1991 and 2011, then began to decline again in 2016, due to market shifts toward annual crops. The net effect is an increase in permanent cover of 2.3 million ha (6%) in the Prairies since 1981, with Saskatchewan accounting for the largest proportion of the change (about 2 million ha), particularly since 1996 (Figure 5). The decline in summerfallow throughout the Prairie Region is the result of a number of factors, including the adoption of managciteent practices (increased use of chciteical fertilizers, extended crop rotations, continuous cropping) that maximize plant production and ensure more efficient use of available moisture; the use of chciteical herbicides as an alternative to cultivation for weed control; the conversion of marginal land to permanent cover or pasture; and greater awareness among producers of the potential long-term degradation effects of summerfallow and conventional tillage practices.
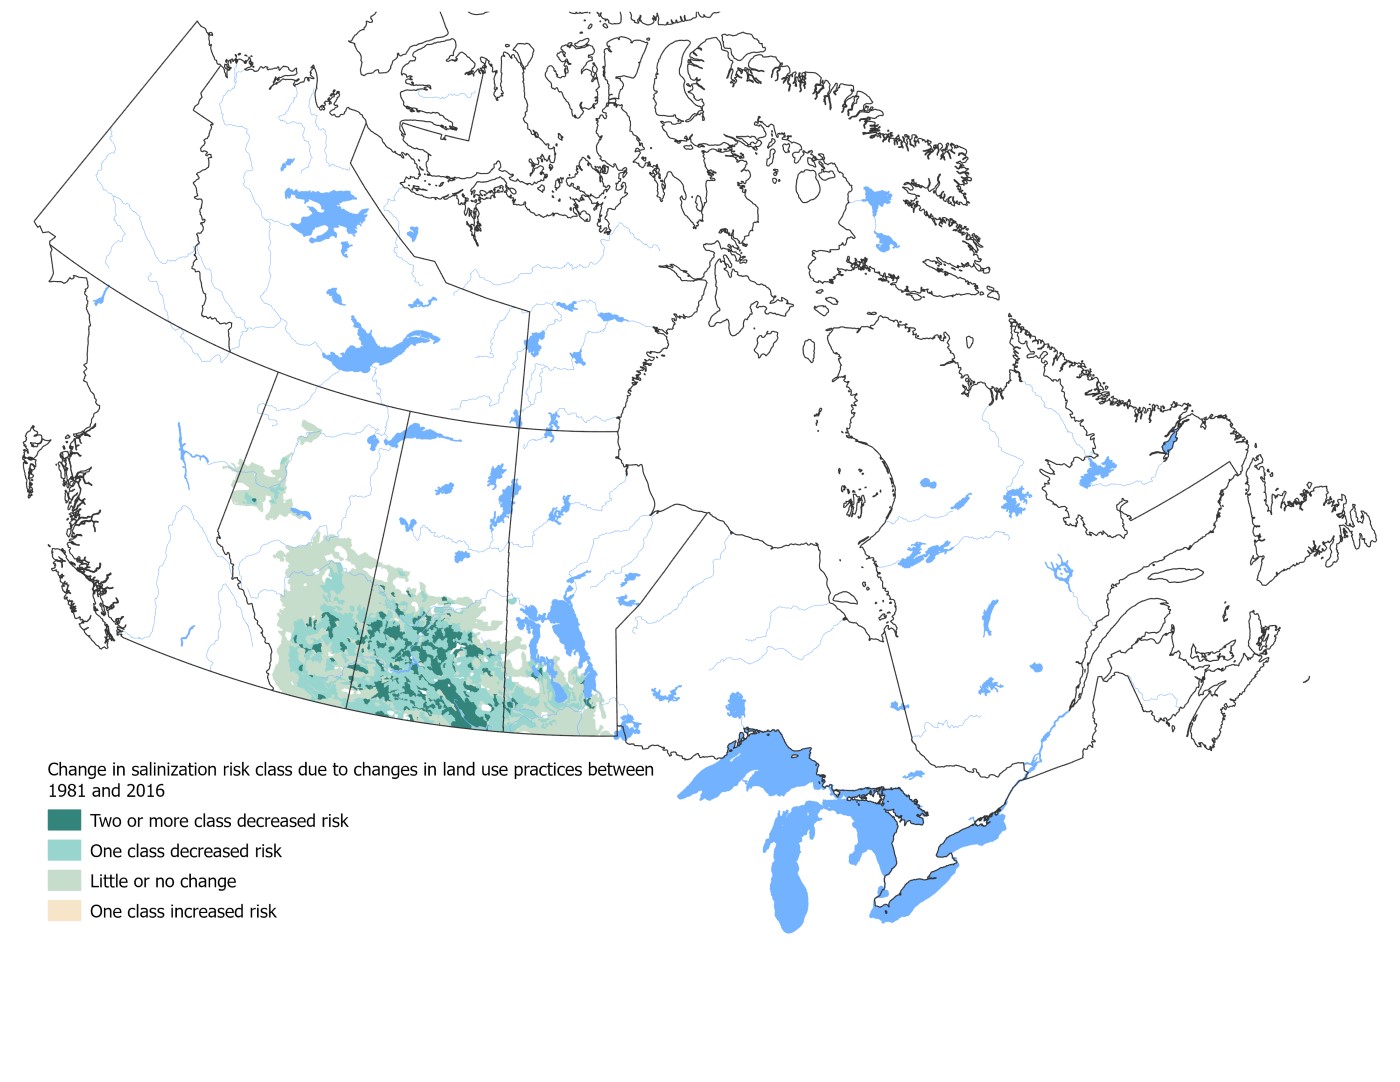
Figure 3: Change in salinization risk class due to changes in land use practices between 1981 and 2016
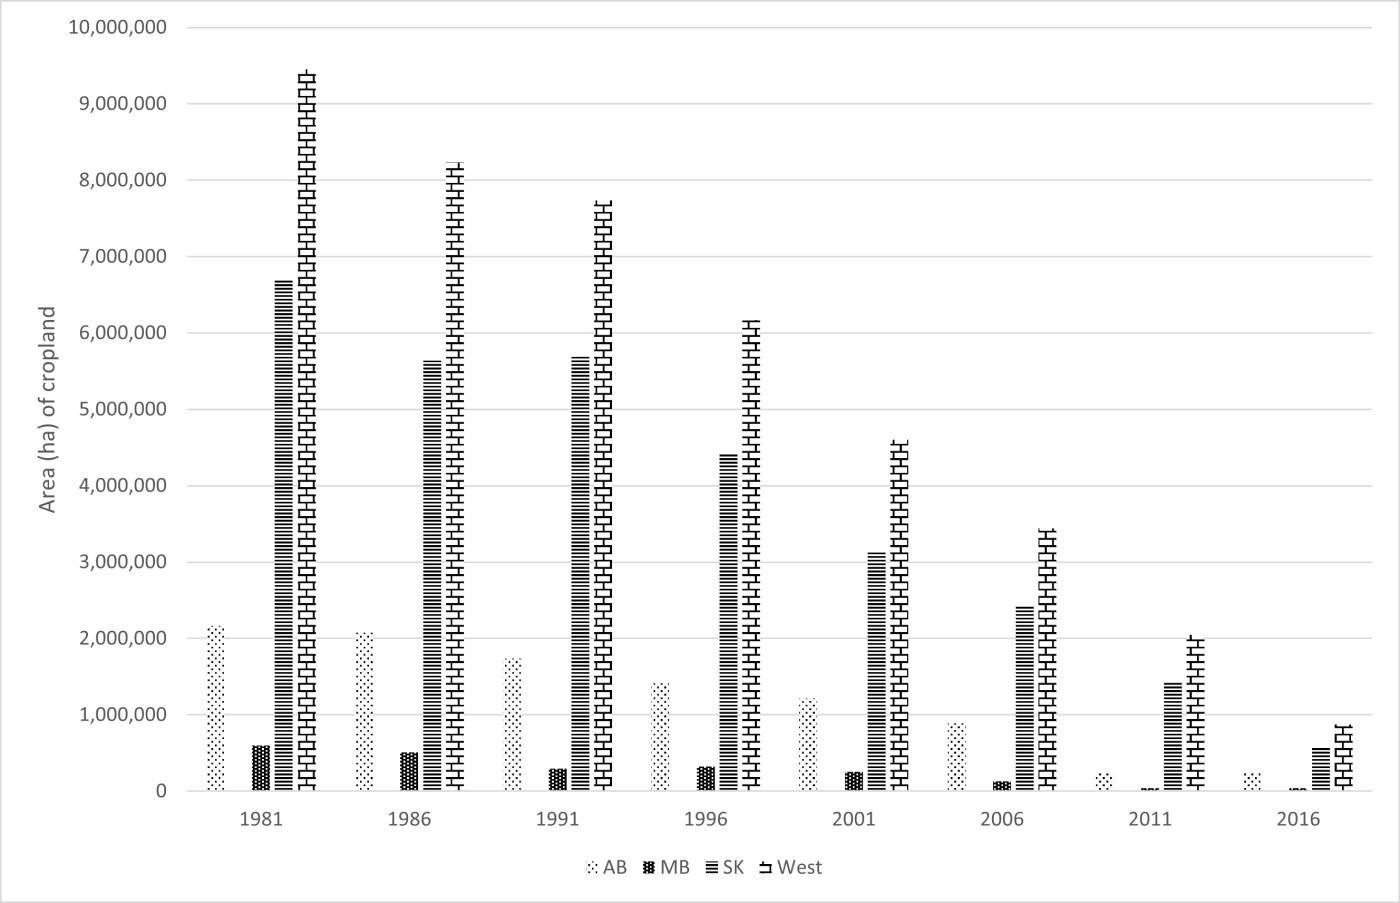
Figure 4: Area of summerfallow on the Canadian Prairies from 1981 to 2016
Description of image above
| Province | 1981 | 1986 | 1991 | 1996 | 2001 | 2006 | 2011 | 2016 |
|---|---|---|---|---|---|---|---|---|
| Alta. | 2163572 | 2078521 | 1738004 | 1411749 | 1215939 | 889261 | 503524 | 254928 |
| Man. | 597466 | 507317 | 296569 | 322436 | 254780 | 126466 | 95739 | 40606 |
| Sask. | 6687421 | 5639929 | 5697718 | 4427072 | 3127238 | 2425117 | 1443726 | 577207 |
| West | 9456430 | 8235776 | 7739132 | 6166759 | 4603017 | 3444501 | 2045813 | 873573 |
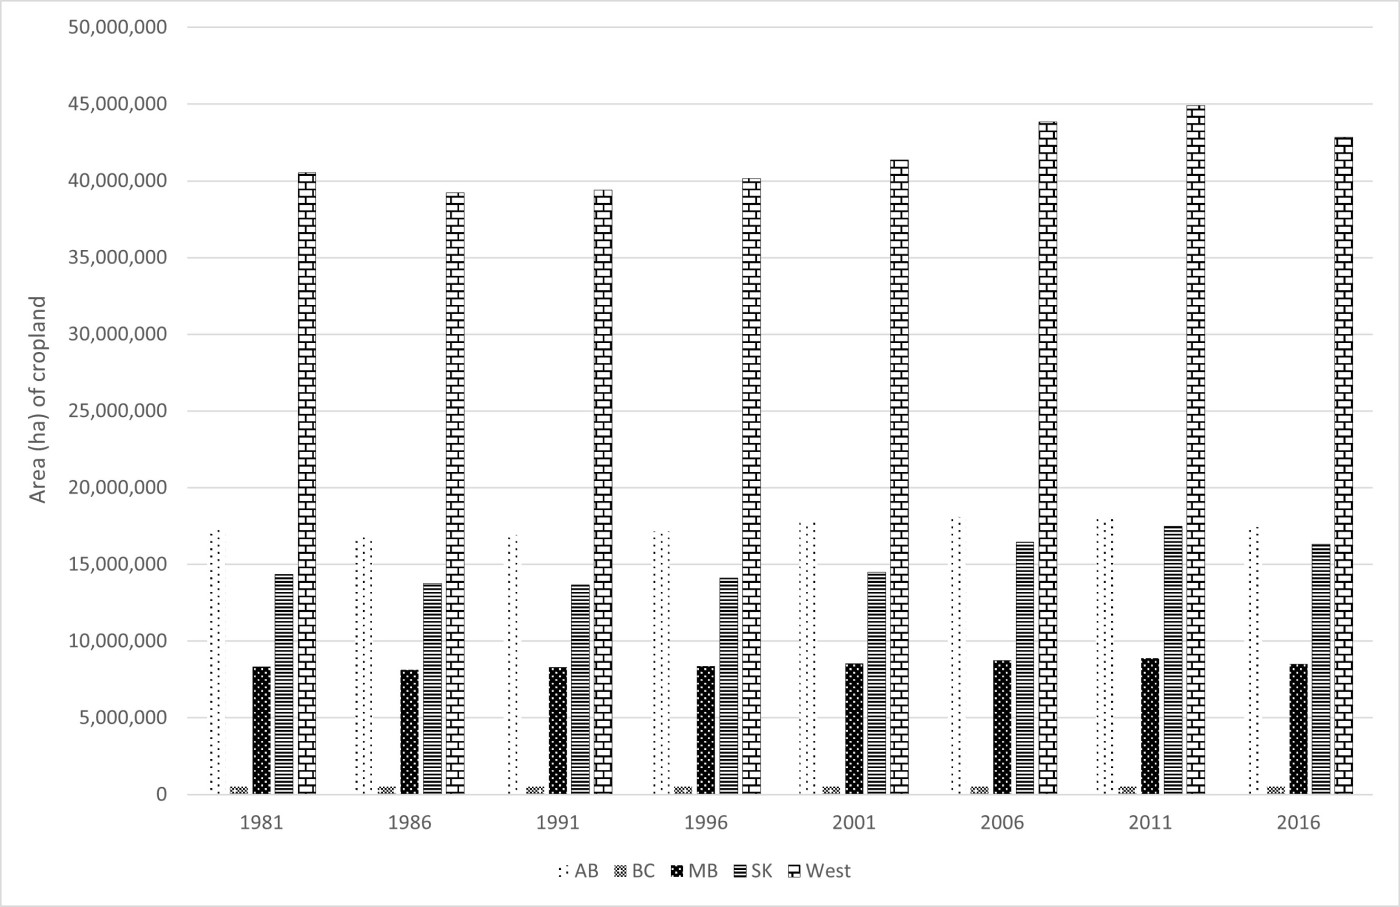
Figure 5: Area of permanent cover/perennial crops on the Canadian Prairies, 1981 to 2016
Description of image above
| Province | 1981 | 1986 | 1991 | 1996 | 2001 | 2006 | 2011 | 2016 |
|---|---|---|---|---|---|---|---|---|
| Alta. | 2163572 | 2078521 | 1738004 | 1411749 | 1215939 | 889261 | 254928 | 254928 |
| B.C. | 7971 | 10009 | 6841 | 5502 | 5060 | 3657 | 2824 | 832 |
| Man. | 597466 | 507317 | 296569 | 322436 | 254780 | 126466 | 40606 | 40606 |
| Sask. | 6687421 | 5639929 | 5697718 | 4427072 | 3127238 | 2425117 | 1443726 | 577207 |
| West | 9456430 | 8235776 | 7739132 | 6166759 | 4603017 | 3444501 | 2045813 | 873573 |
Response options
While salinization risk has decreased across the Prairies over the last few years, it is still a localized issue of concern for some producers, particularly when water tables are elevated after wetter-than-normal years. The process of salinization is inextricably linked to soil-water conditions, and reducing the risk of salinization and improving existing saline soils requires appropriate soil-water managciteent. BMPs that reduce the overland redistribution of excess water within the landscape and increase the amount of precipitation used by plants where it falls are most effective in controlling the movciteent of soluble salts throughout the landscape and thereby preventing soil salinization. These land and water managciteent practices include:
- reduced use of summerfallow;
- increased use of perennial forages, pastures, and tree crops;
- snow managciteent (preventing large drifts), to evenly distribute snow and reduce ponding in the spring;
- increased use of no-till and minimum-till to encourage more uniform infiltration of precipitation; and
- effective use of inputs such as fertilizers and manure to support healthy crop growth and maximize water uptake.
In areas of the landscape where high water tables are already a concern and pose a salinization risk, practices that lower the water table should be incorporated into managciteent activities. These include:
- planting deep-rooted, high-moisture-use perennials to help dry out the subsoil and draw down the water table;
- incorporating more salt-tolerant crops in rotations where salinity is becoming a problcite, to maximize water use and reduce salt movciteent to the soil surface;
- establishing interceptor perennial forage or tree crop strips to reduce groundwater flow to the area at risk;
- using strategic subsurface (plastic) tile drainage to rciteove water and salts;
- using appropriate surface drainage to reduce recharge; and
- monitoring depth of groundwater in sensitive areas to aid in land-use planning and to allow for the implciteentation of appropriate BMPs.
Reduced (conservation) tillage practices can improve the distribution of snowmelt water and can reduce the need for summerfallow; however, this approach may also increase ground-water recharge via intact root channels. More information is needed on the effect of conservation tillage on hydrology to better assess its impact on salinization risk. Soil salinity is a localized problcite, and is more readily monitored today with advances in electrical conductivity measurciteent methods; however, there is room to further reduce the risks. More citephasis on salinity tolerance in crop breeding programs would provide producers with a wider range of cropping options for at-risk areas. Since groundwater flow often crosses property lines, the effective monitoring and managciteent of salinization risk may require a coordinated effort between conservation districts and government agencies. Better information on the extent and degree of soil salinization in Canada and its cost to Canadian agriculture would increase the motivation for such activities.
References
Florinsky, I.V., R.G. Eilers, B.H. Wiebe, and M.M. Fitzgerald, 2009. Dynamics of soil salinity in the Canadian Prairies: Application of singular spectrum analysis. Environmental Modelling and Software.24: 1182-1195.
Forge, F. 1998. Agriculture soil conservation in Canada. [Online] Available: http://publications.gc.ca/Collection-R/LoPBdP/MR/mr151-e.htm.
Henry, L., B. Harron, and D. Flaten, 1987. The nature and managciteent of salt-affected land in Saskatchewan.Agdex 518. Regina, SK, Canada: Saskatchewan Agriculture.
Holzer, J., M.R. Miller, S.K. Brown, R.G. Legare, and J.J. Von Stein, 1995. Dryland salinity problcites in the Great Plains Region of Montana: Evolution of hydrogeology aspects and control programs. In: Proceedings of the International Association of Hydrogeologists – Congress XXVI: Dryland Salinity Workshop, Edmonton, AB, Canada.
Miller, M.R., P.L. Brown, J.J. Donovan, R.N. Bergatino, J.L. Sonderegger, and F.A. Schmidt, 1981. Saline seep development and control in the North American Great Plains: Hydrogeological aspects. Agricultural Water Managciteent. 4: 115-141.
Vander Pluym, H, 1982. Salinity in western Canada. In: Proceedings of the First Annual Western Provincial Conference on Rationalization of Water and Soil Research and Managciteent: Soil salinity. Lethbridge, AB, Canada.
Wiebe, B.H., R.G. Eilers, W.D. Eilers, and J.A. Brierley, 2006. The presence and extent of moderate to severe soil salinity on the Canadian Prairies. In: Proceedings of the Manitoba Soil Science Society Annual Meetings, Winnipeg, MB, Canada.
Wiebe, B.H., R.G. Eilers, W.D. Eilers, and J.A. Brierley, 2007. Application of a risk indicator for assessing trends in dryland salinization risk on the Canadian Prairies. Canadian Journal of Soil Science. 87: 213-224.
Wiebe, B.H., W.D. Eilers, and J.A. Brierley, 2010. Soil salinity. Pages 66-71 in Eilers, W., R. MacKay, L. Graham, and A. Lefebvre (eds.). Environmental sustainability of Canadian agriculture: Agrienvironmental indicator report series – Report #3. Ottawa, ON: Agriculture and Agri-Food Canada.