
This section host statistics on Export of bovine embryos in Canada.
| Top trading partners | 2018 | 2019 | 2020 | 2021 | 2022 |
|---|---|---|---|---|---|
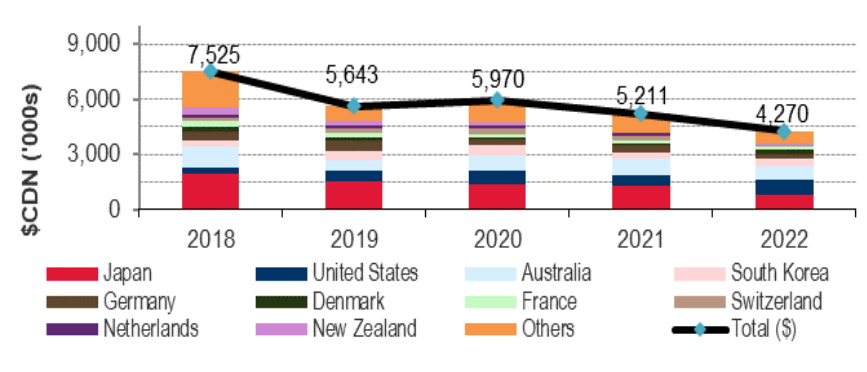
| 1 - Japan | 1,958,550 | 1,561,849 | 1,379,242 | 1,287,136 | 810,905 |
| 2 - Australia | 1,108,631 | 581,655 | 832,249 | 846,831 | 730,672 |
| 3 - United States | 351,220 | 569,196 | 766,369 | 604,301 | 781,307 |
| 4 - Korea, South | 319,068 | 444,874 | 521,801 | 364,047 | 485,023 |
| 5 - Germany | 495,608 | 572,332 | 351,383 | 411,486 | 238,448 |
| 6 - Switzerland | 194,775 | 216,115 | 340,718 | 268,231 | 118,930 |
| 7 - Netherlands | 108,483 | 233,678 | 163,755 | 136,677 | 25,320 |
| 8 - New Zealand | 414,446 | 210,845 | 157,258 | 69,345 | 24,700 |
| 9 - France | 350,313 | 246,194 | 135,054 | 92,212 | 149,150 |
| 10 - Denmark | 245,242 | 185,700 | 65,201 | 120,271 | 198,661 |
| Others | 1,978,971 | 820,636 | 1,256,977 | 1,010,584 | 707,263 |
| Total | 7,525,307 | 5,643,074 | 5,970,007 | 5,211,121 | 4,270,379 |
| Top trading partners | 2018 | 2019 | 2020 | 2021 | 2022 |
|---|---|---|---|---|---|
| 1 - Japan | 1,435 | 1,135 | 1,026 | 936 | 597 |
| 2 - Australia | 2,041 | 1,298 | 1,115 | 2,315 | 1,948 |
| 3 - United States | 411 | 837 | 1,243 | 1,017 | 1,202 |
| 4 - Korea, South | 159 | 235 | 499 | 331 | 459 |
| 5 - Germany | 539 | 580 | 347 | 357 | 226 |
| 6 - Switzerland | 259 | 261 | 361 | 267 | 143 |
| 7 - Netherlands | 281 | 289 | 215 | 1,617 | 83 |
| 8 - New Zealand | 1,212 | 248 | 233 | 138 | 104 |
| 9 - France | 335 | 227 | 114 | 71 | 93 |
| 10 - Denmark | 322 | 185 | 85 | 113 | 184 |
| Others | 3,200 | 1,946 | 2,218 | 1,371 | 1,204 |
| Total | 10,194 | 7,241 | 7,456 | 8,533 | 6,243 |
Source: Statistics Canada
For your convenience, this report is available in the following format:
PDF (266 KB)
If you have any questions or require additional information, please send an e-mail to aafc.cdic-ccil.aac@agr.gc.ca