
This section host statistics on export of live birds in Canada.
| Top trading partners | 2019 | 2020 | 2021 | 2022 | 2023 |
|---|---|---|---|---|---|
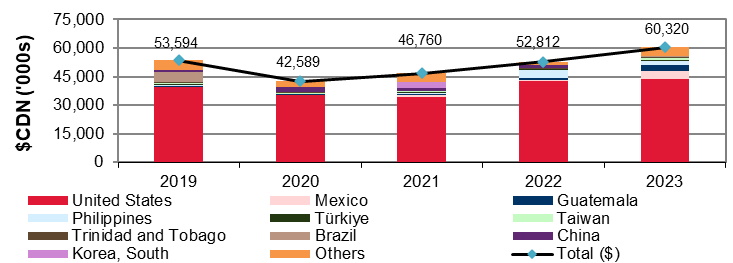
| 1 - United States | 39,668,477 | 35,383,700 | 34,398,779 | 42,725,881 | 43,631,795 |
| 2 - Mexico | 87,631 | 98,251 | 758,472 | 266,174 | 4,031,666 |
| 3 - Guatemala | 359,411 | 177,891 | 598,705 | 1,264,005 | 3,194,594 |
| 4 - Philippines | 445,787 | - | 442,305 | 4,307,793 | 2,053,246 |
| 5 - Türkiye | 366,575 | 400,949 | 468,409 | 262,283 | 1,003,023 |
| 6 - Taiwan | 472,533 | 138,464 | 562,992 | 313,604 | 753,900 |
| 7 - Trinidad and Tobago | 902,378 | 445,755 | 40,853 | 354,374 | 585,259 |
| 8 - Brazil | 5,140,742 | - | - | - | 327,476 |
| 9 - China | 824,088 | 2,828,214 | 1,955,952 | 1,380,005 | - |
| 10 - Korea, South | 415,972 | 231,837 | 2,679,371 | 337,520 | - |
| Others | 4,910,318 | 2,884,247 | 4,854,623 | 1,600,045 | 4,739,081 |
| Total | 53,593,912 | 42,589,308 | 46,760,461 | 52,811,684 | 60,320,040 |
| Top trading partners | 2019 | 2020 | 2021 | 2022 | 2023 |
|---|---|---|---|---|---|
| 1 - United States | 11,489,666 | 10,291,767 | 11,076,945 | 12,449,726 | 11,631,954 |
| 2 - Mexico | 44,030 | 23,939 | 92,279 | 27,808 | 525,408 |
| 3 - Guatemala | 34,737 | 27,758 | 63,253 | 122,781 | 345,179 |
| 4 - Philippines | 66,160 | - | 70,221 | 421,464 | 294,319 |
| 5 - Türkiye | 49,120 | 64,218 | 59,218 | 29,040 | 168,397 |
| 6 - Taiwan | 90,006 | 13,704 | 78,633 | 29,484 | 105,449 |
| 7 - Trinidad and Tobago | 405,298 | 201,373 | 25,576 | 165,048 | 183,551 |
| 8 - Brazil | 994,900 | - | - | - | 40,168 |
| 9 - China | 109,340 | 517,314 | 179,802 | 26,039 | - |
| 10 - Korea, South | 47,040 | 44,159 | 238,108 | 42,235 | - |
| Others | 1,133,785 | 483,739 | 531,398 | 219,382 | 587,073 |
| Total | 14,464,082 | 11,667,971 | 12,415,433 | 13,533,007 | 13,881,498 |
Source: Statistics Canada
Excludes quantities imported under the import for re-export program
For your convenience, this report is available in the following format:
PDF (13,918 KB)
If you have any questions or require additional information, please send an e-mail to aafc.cdic-ccil.aac@agr.gc.ca