
Market overview
China is the #1 country in the scorecard, and consumers are very comfortable buying packaged food and beverages through digital channels.
China is the largest global market for e-commerce channel sales in Packaged Food, Non-Alcoholic Beverages, and Alcoholic Drinks.
Chinese consumers rapidly adopted food and drink e-commerce during the lockdown, as everyone turned to home cooking, with value growth at 19% from 2019 to 2020.
China is the second largest importer of Canadian packaged food and beverage products, behind only the United States.
| Metric | Value | Rank (of 10) |
|---|---|---|
| Total Packaged Food and Beverage Market in 2020 | Can$745.6 billion | 2nd |
| E-commerce Channel Size of Total Packaged Food and Beverage in 2020 | Can$76.5 billion | 1st |
| E-commerce Channel Share of Total Packaged Food and Beverage in 2020 | 10.3% | 2nd |
| Size of Canadian Packaged Food and Beverage Imports in 2018 | Can$2,687 million | 2nd |
Description of above image
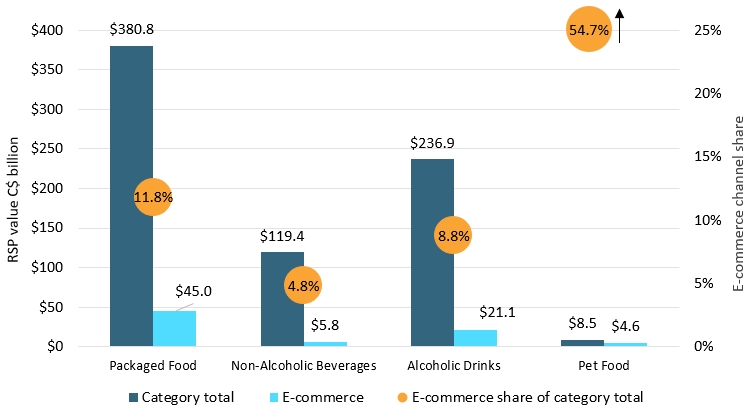
| Category | Category total | E-commerce | E-commerce share of category total |
|---|---|---|---|
| Packaged Food | $380.8 | $45.0 | 11.8% |
| Non-Alcoholic Beverages | $119.4 | $5.8 | 4.8% |
| Alcoholic Drinks | $236.9 | $21.1 | 8.8% |
| Pet Food | $8.5 | $4.6 | 54.7% |
Source: Euromonitor International
Leading import and e-commerce product categories
| Product Category | Imports from Canada (2018, Can$ million) | Historic CAGR* (2014-2018) |
|---|---|---|
| Fats and Oils | $1,227.1 | 16.8% |
| Processed Meat and Seafood | $1,098.3 | 28.0% |
| Food Preparations | $96.3 | 45.3% |
| Dog and Cat Food | $91.4 | 370.4% |
| Processed Fruit and Vegetables | $30.5 | −11.5% |
| *CAGR: Compound Annual Growth Rate | ||
| Product Category | E-commerce Channel Sales (2020, Can$ million) | Share of E-commerce of all distribution (2020) | Historic E-commerce CAGR* (2015-2020) |
|---|---|---|---|
| Spirits | $13,556 | 9.9% | 13.5% |
| Dairy | $6,212 | 7.7% | 27.2% |
| Noodles | $5,844 | 17.6% | 31.7% |
| Baked Goods | $4,880 | 10.7% | 47.5% |
| Pet Food | $4,644 | 54.7% | 44.4% |
| *CAGR: Compound Annual Growth Rate | |||
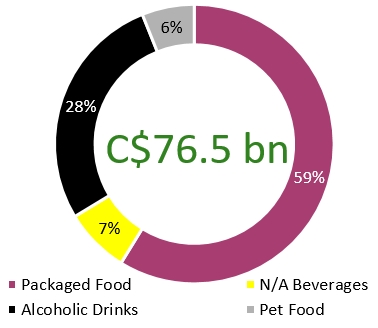
Description of above image
| Category | Packaged food and beverage e-commerce channel sales in China |
|---|---|
| Packaged Food | 59% |
| Non-Alcoholic Beverages | 7% |
| Alcoholic Drinks | 28% |
| Pet Food | 6% |
| Total | Can$76.5 billion |
Ten product categories sold over Can$1 billion via e-commerce in 2020. Over Can$1 billion of Canadian Processed Meat and Seafood and Fats and Oils products were imported by China.
| Product Category | Value of Canadian imports by China (Can$ million) | E-commerce channel sales Can$ million | E-commerce channel share (%) of all distribution channels in 2020 |
|---|---|---|---|
| Beer | 1 | 3,072 | 9.2% |
| Wine | 15 | 4,518 | 15.0% |
| Spirits | 1 | 13,556 | 9.9% |
| Carbonates and Bottled Water | 9 | 1,660 | 5.3% |
| Hot Drinks | 0 | 3,581 | 13.4% |
| Confectionary | 5 | 3,814 | 21.8% |
| Pet Food | 91 | 4,644 | 54.7% |
| Processed Meat and Seafood | 1,098 | 1,357 | 3.8% |
| Processed Fruits and Vegetables | 31 | 197 | 8.4% |
| Ready Meals/ Food Preparations | 96 | 120 | 1.3% |
| Savoury Snacks | 3 | 4,074 | 15.3% |
| Syrups and Sweeteners | 5 | 1,515 | 5.4% |
| Fats and Oils | 1,227 | 1,051 | 4.9% |
Source: Euromonitor International (e-commerce channel sales) and UN Comtrade (Canadian import data) |
|||
Sector snapshot
Packaged food
The increase in at-home food consumption boosted sales of products suitable for home cooking, and particularly staple items such as rice, edible oils and noodles. Frozen processed meat and seafood, a category that has struggled to overcome Chinese consumers' strong preference for fresh products, also benefited, as did shelf-stable processed fruit and vegetables.
Supermarkets and hypermarkets worked closely with food delivery platforms such as Meituan.com and Ele.me in order to make up for losses through store-based sales.
Non-alcoholic beverages
Most soft drink categories experienced a slowdown in growth due to home seclusion and a ban on social gatherings. Coffee is anticipated to register robust growth thanks to the growing coffee culture and demand for specialist coffee, taking sales from more traditional hot tea products.
Thanks to the wide availability of non-alcoholic beverages in major online business-to-consumer channels such as Tmall and JD.com, e-commerce witnessed robust growth in 2020 due to the lengthy period of lockdown and home seclusion, with the digital shift expected to stick in 2021 and beyond.
Alcoholic drinks
By volume, China has the largest spirits e-commerce market in the world. During the pandemic, e-commerce became the primary channel for purchasing alcohol. Chinese millennials in first-tier cities buy almost everything online, including foreign beer, due to the convenience of the well-developed delivery system in first-tier cities.
Both alcoholic drinks players and online platforms usually offered amount-based discounts on purchases as part of a number of promotions, as well as free delivery service, which helped make internet retailing the fastest-growing channel even before the pandemic.
Pet food
E-commerce remained the most important distribution channel for pet care in 2020, accounting for over half of total retail sales, and is likely to dominate sales by the end of the forecast period (2025). General e-commerce platforms such as JD.com and Tmall are hugely popular, while online pet specialists such as Miscota are also popular, with many trusting these retailers to offer high quality and authentic brands.
Demographic trends and changing perceptions of pet ownership are resulting in an ongoing boom in the pet population, especially cats, as there are stricter laws in place related to dog ownership.
Industry dynamics and opportunities
E-commerce size and growth
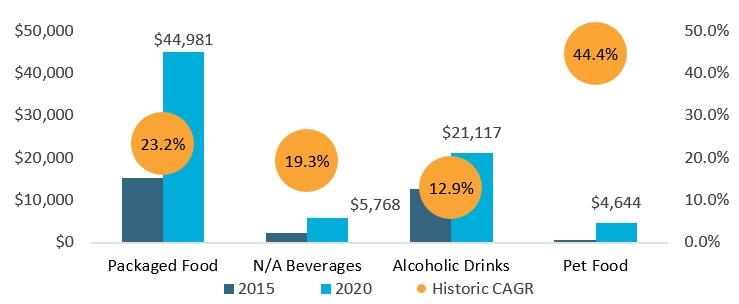
Description of above image
| Market | 2015 | 2020 | Historic CAGR* |
|---|---|---|---|
| Packaged Food | $15,141 | $44,981 | 23.2% |
| Non-Alcoholic Beverages | $2,275 | $5,768 | 19.3% |
| Alcoholic Drinks | $12,540 | $21,117 | 12.9% |
| Pet Food | $705 | $4,644 | 44.4% |
| *CAGR: Compound Annual Growth Rate | |||
Source: Euromonitor International
Competitive environment
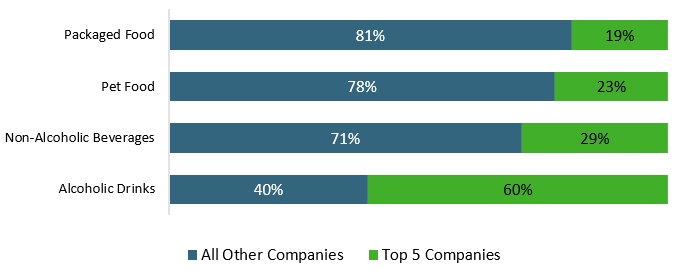
Description of above image
| Category | All Other Companies | Top 5 Companies |
|---|---|---|
| Packaged Food | 81% | 19% |
| Pet Food | 78% | 23% |
| Non-Alcoholic Beverages | 71% | 29% |
| Alcoholic Drinks | 40% | 60% |
Source: Euromonitor International
Key e-commerce websites
| Rank (SKUs[1] on Via) | Packaged Food | Non-Alcoholic Beverages | Alcoholic Drinks | Pet Food |
|---|---|---|---|---|
| 1 | JD (108.8 thousand SKUs) | JD (18.3 thousand) | JD (17.3 thousand) | JD (12.1 thousand) |
| 2 | Suning (34.8 thousand) | Suning (9.8 thousand) | Suning (7.9 thousand) | Miscota (10.8 thousand) |
| 3 | Redbaby (8.8 thousand) | Amazon (4.4 thousand) | Jiuxianwang (6.7 thousand) | VIPShop (0.7 thousand) |
| 4 | Amazon (7.4 thousand) | VIPShop (1.1 thousand) | VIPShop (1.3 thousand) | DangDang (0.4 thousand) |
| 5 | VIPShop (2.4 thousand) | DangDang (0.7 thousand) | DangDang (0.3 thousand) | Amazon (0.3 thousand) |
1: SKU data comes from Euromonitor International's proprietary Via data extraction tool, and was extracted in March 2021 |
||||
Key highlights for Canadian producers
Packaged food
Newfound interest among Chinese consumers in processed meat, seafood and vegetables during the pandemic aligns with existing Canadian import supply lines.
Non-alcoholic beverages
Some beverage manufacturers leveraged COVID-19 to introduce new products with health claims and expand flavor offerings. Beverage products making functional claims are expected to resonate as health and wellness comes into greater focus.
Alcoholic drinks
Local spirit baijiu dominates, but Chinese consumers are drinking less baijiu due to health concerns or switching to other spirits, which could open the door for Canadian offerings, such as whisky.
Pet food
Many smaller domestic brands start out online, with e-commerce opening up sales to lower tier cities for these brands - a similar approach could work for an international manufacturer as well.