
Market overview
Canada's #1 trade partner registered e-commerce sales exceeding $50 billion in 2020 for packaged food and beverage products.
Valued at Can$35 billion, the United States Packaged Food e-commerce market is second largest in the world, behind only China.
There were five product categories that exceeded Can$2.5 billion in imports by the United States in 2019.
Double-digit Compound Annual Growth Rate (CAGR) growth was seen over the review period for e-commerce sales across all four packaged food and beverage sectors.
| Metric | Value | Rank (of 10) |
|---|---|---|
| Total Packaged Food and Beverage Market in 2020 | Can$1,031.7 billion | 1st |
| E-commerce Channel Size of Total Packaged Food and Beverage in 2020 | Can$52.1 billion | 2nd |
| E-commerce Channel Share of Total Packaged Food and Beverage in 2020 | 5.1% | 5th |
| Size of Canadian Packaged Food and Beverage Imports in 2019 | Can$22.4 billion | 1st |
Description of above image
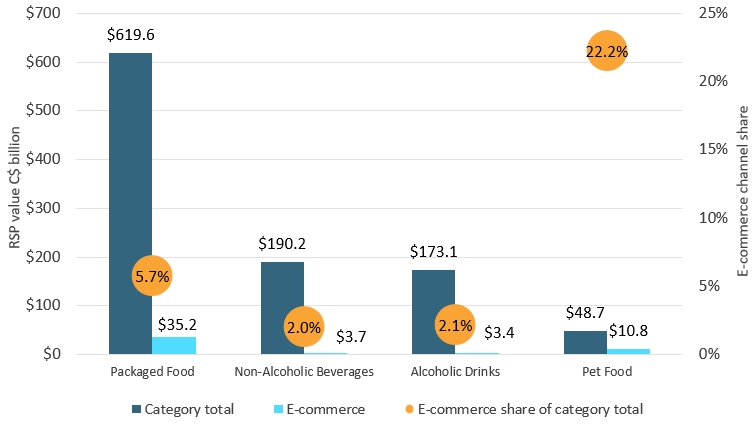
| Category | Category total | E-commerce | E-commerce share of category total |
|---|---|---|---|
| Packaged Food | $619.6 | $35.2 | 5.7% |
| Non-Alcoholic Beverages | $190.2 | $3.7 | 2.0% |
| Alcoholic Drinks | $173.1 | $3.4 | 2.1% |
| Pet Food | $48.7 | $10.8 | 22.2% |
Source: Euromonitor International
Leading import and e-commerce product categories
| Product Category | Imports from Canada (2019, Can$ million) | Historic CAGR* (2014-2019) |
|---|---|---|
| Savoury Snacks | $3,919.0 | 15.8% |
| Processed Meat and Seafood | $3,652.1 | 9.5% |
| Chocolate and Confectionary | 2,626.4 | 7.0% |
| Food Preparations | $2,548.5 | 7.0% |
| Fats and Oils | $2,540.7 | 5.3% |
| *CAGR: Compound Annual Growth Rate | ||
| Product Category | E-commerce Channel Sales (2020; Can$ million) | Share of E-commerce of all distribution (2020) | Historic E-commerce CAGR* (2015-2020) |
|---|---|---|---|
| Pet Food | $10,825.6 | 22.2% | 55.2% |
| Ready Meals | $10,321.9 | 17.0% | 52.6% |
| Baby Food | $3,339.7 | 31.0% | 52.9% |
| Savoury Snacks | $3,302.9 | 4.3% | 45.8% |
| Confectionary | $2,775.8 | 5.6% | 35.4% |
| *CAGR: Compound Annual Growth Rate | |||
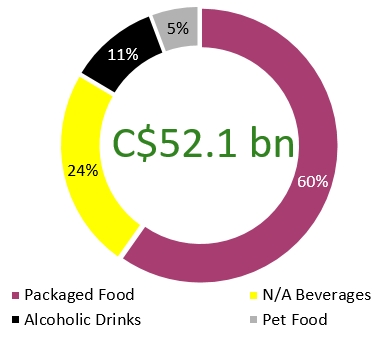
Description of above image
| Category | Packaged food and beverage e-commerce channel sales in the United States |
|---|---|
| Packaged Food | 66% |
| Non-Alcoholic Beverages | 7% |
| Alcoholic Drinks | 6% |
| Pet Food | 21% |
| Total | Can$52.1 billion |
Ready Meals sales via e-commerce exceeded Can$10 billion as COVID-19 altered American lifestyles and eating habits.
| Product Category | Value of Canadian imports by the United States (Can$ million) | E-commerce channel sales Can$ million | E-commerce channel share (%) of all distribution channels in 2020 |
|---|---|---|---|
| Beer | 154 | 824 | 0.7% |
| Wine | 56 | 1,971 | 4.3% |
| Spirits | 590 | 658 | 1.0% |
| Carbonates and Bottled Water | 397 | 1,233 | 1.0% |
| Hot Drinks | 660 | 1,521 | 6.2% |
| Confectionary | 2,025 | 2,756 | 5.6% |
| Pet Food | 328 | 10,826 | 22.2% |
| Processed Meat and Seafood | 3,652 | 1,669 | 2.7% |
| Processed Fruits and Vegetables | 659 | 951 | 4.0% |
| Ready Meals/ Food Preparations | 2,548 | 10,322 | 17.0% |
| Savoury Snacks | 3,919 | 3,303 | 4.3% |
| Dairy | 174 | 2,207 |
2.2% |
| Fats and Oils | 2,541 | 388 | 6.4% |
|
Source: Euromonitor International (e-commerce channel sales) and UN Comtrade (Canadian import data) |
|||
Sector snapshot
Packaged food
Historically, the United States has lagged behind most other developed markets in terms of online grocery penetration, but the pandemic has rapidly accelerated the pace of adoption, to the point where year-on-year food and drink e-commerce sales grew 119% in 2020, and COVID-19 caused a particularly large spike across packaged food categories in 2020.
For example, ready meals sold through e-commerce increased by Can$4 billion from 2019-20 to reach Can$10 billion sold through the online channel.
Non-alcoholic beverages
Hot drinks have done well via e-commerce (Can$1.5 billion in 2020 sales) because coffee and tea are dry, shelf-stable goods which are relatively easy to ship.
E-commerce is expected to continue growing into the forecast period, boosted by higher rates of at-home consumption. This is bolstered by the fact that many independent tea and coffee shops diverted sales of their original blends to online channels during the crisis, often offering monthly subscription deliveries.
Alcoholic drinks
E-commerce registered positive growth prior to the pandemic but had yet to take off for alcohol like it did with other consumer goods.
Potential growth had been slowed by the cost of shipping voluminous and heavy beverages, restrictive regulations governing interstate sales of alcohol, in addition to the consumer preference for tapping into the knowledge of an expert salesperson in store when purchasing more premium alcoholic beverages.
Pet food
E-commerce sales of pet food in the United States neared Can$11 billion in 2020, more than twice the size of the second largest market (China at Can$4.6 billion).
E-commerce continues to gain share from other distribution channels in pet care. As pet food can be bulky in nature and requires replenishment at regular intervals, subscription-based shopping models have been growing in popularity. Programs such as Chewy Autoship or Amazon Subscribe & Save offer both convenience and attractive pricing for pet owners.
Industry dynamics and opportunities
E-commerce size and growth
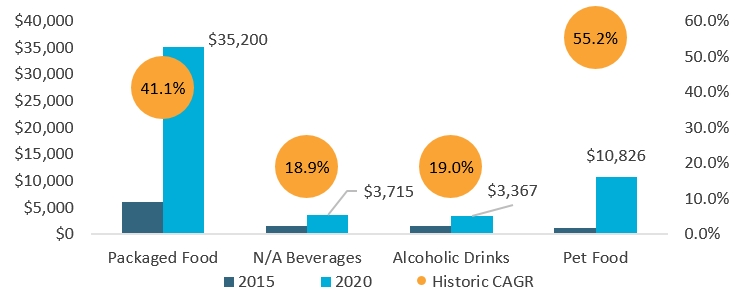
Description of above image
| Market | 2015 | 2020 | Historic CAGR* |
|---|---|---|---|
| Packaged Food | $6,004 | $35,200 | 41.1% |
| Non-Alcoholic Beverages | $1,490 | $3,715 | 18.9% |
| Alcoholic Drinks | $1,618 | $3,367 | 19.0% |
| Pet Food | $1,146 | $10,826 | 55.2% |
| *CAGR: Compound Annual Growth Rate | |||
Source: Euromonitor International
Competitive environment
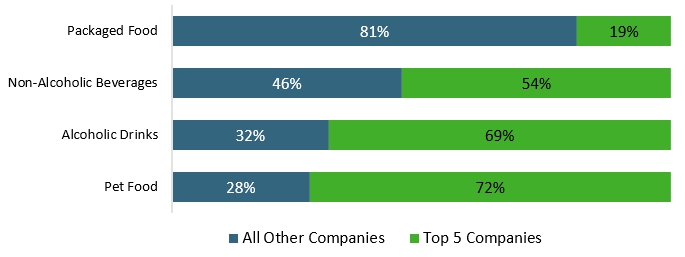
Description of above image
| Category | All Other Companies | Top 5 Companies |
|---|---|---|
| Packaged Food | 81% | 19% |
| Non-Alcoholic Beverages | 46% | 54% |
| Alcoholic Drinks | 32% | 69% |
| Pet Food | 28% | 72% |
Source: Euromonitor International
Key e-commerce websites
| Rank (SKUs[1] on Via) | Packaged Food | Non-Alcoholic Beverages | Alcoholic Drinks | Pet Food |
|---|---|---|---|---|
| 1 | Amazon (80.3 thousand SKUs) | Amazon (43.1 thousand) | Binny's (11.3 thousand) | Amazon (16.0 thousand) |
| 2 | Walmart (11.6 thousand) | Walmart (4.1 thousand) | Hy-Vee (1.7 thousand) | Chewy (9.6 thousand) |
| 3 | Harris Teeter (11.5 thousand) | Harris Teeter (2.1 thousand) | Wegmans (1.5 thousand) | Petco (7.2 thousand) |
| 4 | Giant Eagle (10.3 thousand) | Fred Meyer (2.0 thousand) | Harris Teeter (1.1 thousand) | PetSmart (4.9 thousand) |
| 5 | Wegmans (10.2 thousand) | Giant Eagle (1.9 thousand) | Walmart (0.9 thousand) | Walmart (3.7 thousand) |
|
1: SKU data comes from Euromonitor International's proprietary Via data extraction tool, and was extracted in March 2021 |
||||
Key highlights for Canadian producers
Packaged food
Savoury, salty snack imports from Canada and sales via e-commerce both exceed $3 billion; processed meat and seafood is another category with significant imports and greater demand brought on by more at-home meal preparation.
Non-alcoholic beverages
Coffee and tea could be shipped directly from Canada to the United States through e-commerce subscription customers.
Alcoholic drinks
Canadian Whisky accounted for 23% of total Whiskies sales in the United States, reaching Can$3.8 billion; to consider for partnerships, there is increasing use of pure play alcoholic drinks delivery services such as Drizzly and Cocktail Courier by US consumers.
Pet food
Chewy.com is the #2 site for pet care e-commerce in the United States and would be a pure play partner; in contrast, a marketplace such as Amazon (#1 site for Pet Care) includes a lot of third-party sellers, many of which are located internationally.