
Market overview
Largest e-commerce market in Europe for packaged food and beverage products.
E-commerce penetration is well established across all four industry sectors in the United Kingdom.
Processed Meat and Seafood is the #1 product category for Canadian imports and e-commerce sales, but import value has been on the decline since 2014.
Amazon and large grocery chains are the leading websites for online packaged food and beverage product sales in the United Kingdom.
| Metric | Value | Rank (of 10) |
|---|---|---|
| Total Packaged Food and Beverage Market in 2020 | Can$196.0 billion | 5th |
| E-commerce Channel Size of Total Packaged Food and Beverage in 2020 | Can$18.6 billion | 3rd |
| E-commerce Channel Share of Total Packaged Food and Beverage in 2020 | 9.5% | 3rd |
| Size of Canadian Packaged Food and Beverage Imports in 2018 | Can$311 million | 6th |
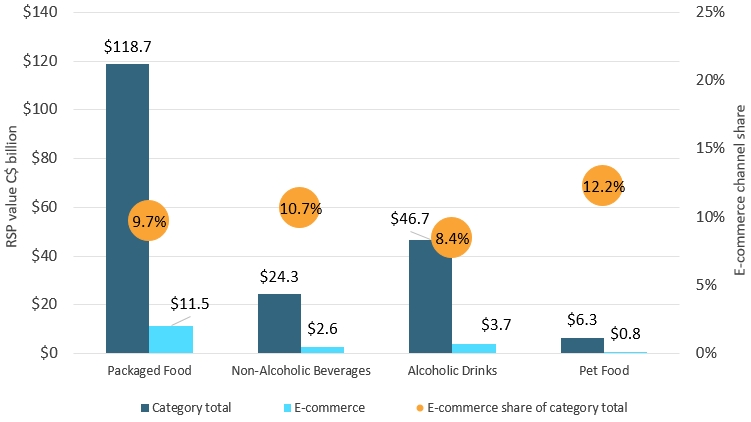
Description of above image
| Category | Category total | E-commerce | E-commerce share of category total |
|---|---|---|---|
| Packaged Food | $118.7 | $11.5 | 9.7% |
| Non-Alcoholic Beverages | $24.3 | $2.6 | 10.7% |
| Alcoholic Drinks | $46.7 | $3.7 | 8.4% |
| Pet Food | $6.3 | $0.8 | 12.2% |
Source: Euromonitor International
Leading import and e-commerce product categories
| Product Category | Imports from Canada (2018, Can$ million) | Historic CAGR* (2014-2018) |
|---|---|---|
| Processed Meat and Seafood | $164.2 | −5.5% |
| Savoury Snacks | $55.3 | 13.2% |
| Syrups/Sweeteners | $20.3 | 9.0% |
| Food Preps | $19.5 | 24.4% |
| Processed Fruit and Vegetables | $11.3 | 0.3% |
| *CAGR: Compound Annual Growth Rate | ||
| Product Category | E-commerce Channel Sales (2020, Can$ million) | Share of E-commerce of all distribution (2020) | Historic E-commerce CAGR* (2015-2020) |
|---|---|---|---|
| Processed Meat and Seafood | $2,536.8 | 15.8% | 20.0% |
| Wine | $1,752.2 | 10.8% | 5.0% |
| Ready Meals | $1,559.2 | 15.4% | 26.5% |
| Confectionary | $1,361.2 | 9.5% | 19.8% |
| Savoury Snacks | $1,286.5 | 12.6% | 19.3% |
| *CAGR: Compound Annual Growth Rate | |||
Industry split of packaged food and beverage e-commerce channel sales in the United Kingdom (2020)
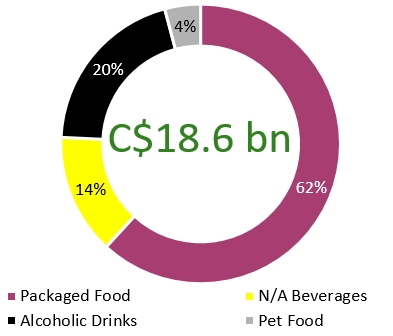
Description of above image
| Category | Packaged food and beverage e-commerce channel sales in the United Kingdom |
|---|---|
| Packaged Food | 62% |
| Non-Alcoholic Beverages | 14% |
| Alcoholic Drinks | 20% |
| Pet Food | 4% |
| Total | Can$18.6 billion |
Five product categories exceeded Can$1 billion in e-commerce sales in the United Kingdom.
| Product Category | Value of Canadian imports by the United Kingdom (Can$ million) | E-commerce channel sales Can$ million | E-commerce channel share (%) of all distribution channels in 2020 |
|---|---|---|---|
| Beer | 0.55 | 709 | 5.1% |
| Wine | 0.87 | 1752 | 10.8% |
| Spirits | 1.89 | 589 | 5.7% |
| Carbonates and Bottled Water | 1.08 | 425 | 4.0% |
| Hot Drinks | 0.83 | 500 | 9.7% |
| Juice | 1.77 | 228 | 5.6% |
| Pet Food | 8.92 | 771 | 12.2% |
| Processed Meat and Seafood | 164.2 | 2537 | 15.8% |
| Processed Fruits and Vegetables | 11.32 | 848 | 18.4% |
| Ready Meals/ Food Preparations | 19.95 | 1559 | 15.4% |
| Snack Foods | 55.32 | 1287 | 12.6% |
| Syrups and Sweeteners | 20.3 | 169 | 3.0% |
| Confectonary | 2.21 | 1361 | 9.5% |
| Fats and Oils | 2.16 | 64 | 7.5% |
|
Source: Euromonitor International (e-commerce channel sales) and UN Comtrade (Canadian import data) |
|||
Sector snapshot
Packaged food
Demand for groceries online experienced 78% current value growth in 2020. Spending more time at home and committing more time to cooking routines has particularly benefitted cooking ingredients and products used to prepare breakfast, such as sweet spreads, butter, and breakfast cereals, as well as processed meat such as bacon and sausage.
At the same time, consumer desire for indulgence during long hours at home underpinned a rise in consumption of snacks and take-home ice cream.
Non-alcoholic beverages
COVID-19 had a positive impact on demand for retail sales of hot drinks, which prior to the emergence of the coronavirus had been declining overall due to the strong café culture in the United Kingdom. Facing the closure of their local cafés, Britons were more willing to recreate an at-home barista experience, purchasing premium coffee and tea, despite increasing price sensitivity due to declining levels of disposable income.
In soft drinks, concentrates, carbonated RTD tea (kombucha) and RTD coffee witnessed increased sales as these products benefited from their indulgence aspect, natural energy functional positioning, and health preventative perception.
Alcoholic drinks
The United Kingdom ranks #2 to China in terms of the market value of alcoholic drinks sold through e-commerce in 2020. Wine is the type of alcohol most commonly purchased online, with increased at-home consumption in 2020 encouraging bulk purchasing, which is more convenient when delivered.
Online retailers such as Amazon are growing in volume and value terms, while also becoming the exclusive retailer for several spirits brands. The largest alcohol e-commerce sites are major supermarket chains, with the largest specialist alcohol e-commerce site being Naked Wines.
Pet food
While most pet food is sold through modern grocery retailers, e-commerce continues to gain value share from the main channels in both pet food and pet products due to the wide product variety available online, as well as reasonable prices and the convenience of home delivery of what can be heavy and bulky products.
The pet care subscription model is becoming more popular as this type of online pet specialty store, such as Tails.com, offers consumers a variety of products specifically tailored for their pet, delivered to their doorstep.
Industry dynamics and opportunities
E-commerce size and growth
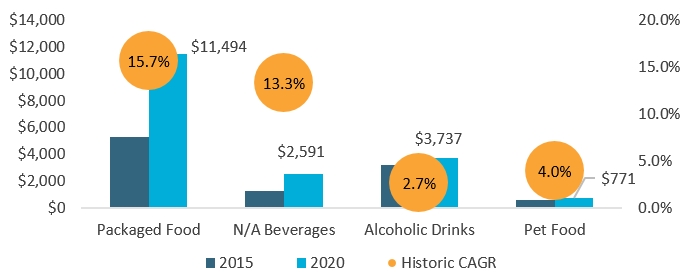
Description of above image
| Market | 2015 | 2020 | Historic CAGR* |
|---|---|---|---|
| Packaged Food | $5,299 | $11,494 | 15.7% |
| Non-Alcoholic Beverages | $1,321 | $2,591 | 13.3% |
| Alcoholic Drinks | $3,244 | $3,737 | 2.7% |
| Pet Food | $605 | $771 | 4.0% |
| *CAGR: Compound Annual Growth Rate | |||
Source: Euromonitor International
Competitive environment
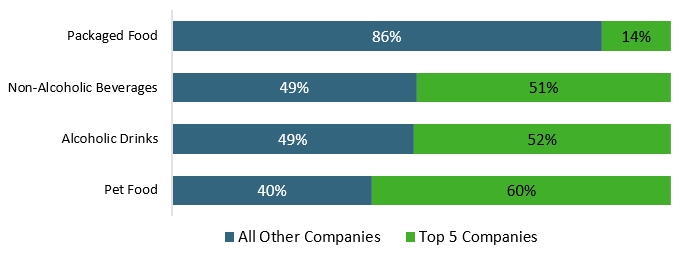
Description of above image
| Category | All Other Companies | Top 5 Companies |
|---|---|---|
| Packaged Food | 86% | 14% |
| Non-Alcoholic Beverages | 49% | 51% |
| Alcoholic Drinks | 49% | 52% |
| Pet Food | 40% | 60% |
Source: Euromonitor International
Key e-commerce websites
| Rank (SKUs[1] on Via) | Packaged Food | Non-Alcoholic Beverages | Alcoholic Drinks | Pet Food |
|---|---|---|---|---|
| 1 | Amazon (60.6 thousand SKUs) | Amazon (29.5 thousand) | The Whiskey Exchange (6.1 thousand) | Amazon (16.9 thousand) |
| 2 | Ocado (13.4 thousand) | Ocado (2.3 thousand) | Amazon (5.4 thousand) | Zooplus (4.2 thousand) |
| 3 | Tesco (9.8 thousand) | Sainsbury's (1.6 thousand) | Ocado (2.0 thousand) | Asda (0.7 thousand) |
| 4 | Sainsbury's (8.5 thousand) | Tesco (1.4 thousand) | Tesco (1.3 thousand) | Tesco (0.6 thousand) |
| 5 | Asda (8.4 thousand) | Waitrose (1.1 thousand) | Sainsbury's (1.0 thousand) | Morrisons (0.4 thousand) |
|
1: SKU data comes from Euromonitor International's proprietary Via data extraction tool, and was extracted in March 2021 |
||||
Key highlights for Canadian producers
Packaged food
Large grocery chains such as Tesco, Sainsbury's and ASDA already had established omni-channel strategies prior to the pandemic, and along with Amazon are the key players for packaged food e-commerce distribution in the United Kingdom.
Non-alcoholic beverages
The increase of online coffee sales recorded during 2020 driven by the rise in working from home is expected to continue, as many companies have invested in direct-to-consumer platforms and partnerships with third parties to meet consumer demand.
Alcoholic drinks
In addition to The Whiskey Exchange, there are several other spirits-focused online retailers in the United Kingdom that would carry Canadian whisky, including Master of Malt, Drink Supermarket, The Bottle Club, and Shop4Whisky.
Pet food
Despite volume sales decreasing, value sales increased again in 2020 driven by premiumization with British pet owners becoming more discerning label readers, seeking fresh, natural and "free-from" cues in their pet food and treats.