
Market overview
Well-developed e-commerce distribution for packaged food and beverages, with 4th largest channel size and share for online value sales in 2020.
Packaged Food accounts for 70% of France's packaged food and beverage e-commerce sales in 2020.
Processed and pre-prepared food products are the most popular Canadian products imported into France.
Large supermarket/hypermarket retail chains are also key players for e-commerce placement of packaged food and beverage products in France.
| Metric | Value | Rank (of 10) |
|---|---|---|
| Total Packaged Food and Beverage Market in 2020 | Can$177.8 billion | 6th |
| E-commerce Channel Size of Total Packaged Food and Beverage in 2020 | Can$12.6 billion | 4th |
| E-commerce Channel Share of Total Packaged Food and Beverage in 2020 | 7.1% | 4th |
| Size of Canadian Packaged Food and Beverage Imports in 2018 | Can$217 million | 7th |
Description of above image
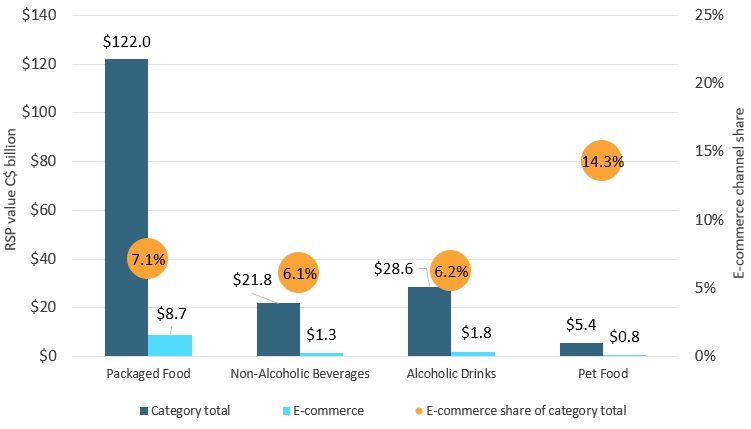
| Category | Category total | E-commerce | E-commerce share of category total |
|---|---|---|---|
| Packaged Food | $122.0 | $8.7 | 7.1% |
| Non-Alcoholic Beverages | $21.8 | $1.3 | 6.1% |
| Alcoholic Drinks | $28.6 | $1.8 | 6.2% |
| Pet Food | $5.4 | $0.8 | 14.3% |
Source: Euromonitor International
Leading import and e-commerce product categories
| Product Category | Imports from Canada (2018, Can$ million) | Historic CAGR* (2014-2018) |
|---|---|---|
| Processed Meat and Seafood | $98.0 | 4.9% |
| Ready Meals | $30.2 | 59.0% |
| Processed Fruits and Vegetables | $26.9 | 6.8% |
| Pet Food | $18.0 | 14.1% |
| Syrups and Sweeteners | $15.5 | 8.9% |
| *CAGR: Compound Annual Growth Rate | ||
| Product Category | E-commerce Channel Sales (2020, Can$ million) | Share of E-commerce of all distribution (2020) | Historic E-commerce CAGR* (2015-2020) |
|---|---|---|---|
| Processed Meat and Seafood | $2,530.3 | 11.4% | 17.5% |
| Dairy | $1,788.4 | 6.2% | 13.3% |
| Pet Food | $777.9 | 14.3% | 23.8% |
| Wine | $671.9 | 4.3% | 9.5% |
| Confectionary | $670.1 | 6.8% | 16.4% |
| *CAGR: Compound Annual Growth Rate | |||
Industry split of packaged food and beverage e-commerce channel sales in France (2020)
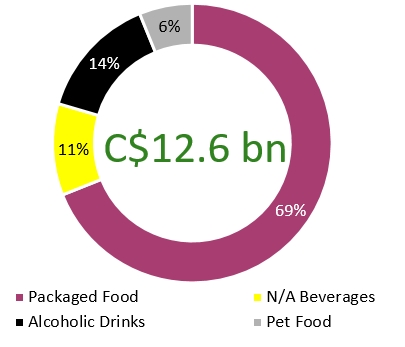
Description of above image
| Category | Packaged food and beverage e-commerce channel sales in France |
|---|---|
| Packaged Food | 69% |
| Non-Alcoholic Beverages | 11% |
| Alcoholic Drinks | 14% |
| Pet Food | 6% |
| Total | Can$12.6 billion |
Processed Meat and Seafood is the largest import product category by France as well as the largest packaged food and beverage category sold through e-commerce.
| Product Category | Value of Canadian imports by France (Can$ million) | E-commerce channel sales Can$ million | E-commerce channel share (%) of all distribution channels in 2020 |
|---|---|---|---|
| Beer | 1.0 | 486 | 2.5% |
| Wine | 0.1 | 672 | 4.3% |
| Spirits | 8.8 | 467 | 3.0% |
| Carbonates and Bottled Water | 0.2 | 704 | 4.8% |
| Hot Drinks | 0.1 | 507 | 5.2% |
| Juice | 2.0 | 307 | 2.8% |
| Pet Food | 18.0 | 778 | 14.3% |
| Processed Meat and Seafood | 98.0 | 2,530 | 11.4% |
| Processed Fruits and Vegetables | 26.9 | 415 | 8.4% |
| Ready Meals/ Food Preparations | 30.2 | 397 | 5.3% |
| Snack Foods | 1.1 | 236 | 5.5% |
| Dairy | 15.5 | 1,788 | 6.2% |
| Confectionary | 2.1 | 670 | 6.8% |
|
Source: Euromonitor International (e-commerce channel sales) and UN Comtrade (Canadian import data) |
|||
Sector snapshot
Packaged food
Increased time at home since the onset of the pandemic has favored categories such as ready meals, sauces, snacks, and staple foods, and reversed pre-COVID declines in processed meat and seafood.
Many supermarket and hypermarket chains invested in improving their digital platforms and provide click-and-collect services, known colloquially in France as "drive." Confectionary manufacturers such as Lindt partnered with third-party delivery services to ensure seasonal sales.
Non-alcoholic beverages
Amid the COVID-19 situation, bottled water in larger pack sizes benefited from home delivery from online channels. Longer term impacts are likely to involve more at-home daily beverage occasions, with focus on products with health and wellness benefits.
The strong coffee drinking culture led most consumers to maintain their daily consumption, taking their coffee at home instead of the café, which benefitted e-commerce sales as fresh beans became a regularly ordered item within online grocery receipts.
Alcoholic drinks
Sales of beer and whiskey have strongly increased via click-and-collect at major retailers, as part of general grocery shopping, and are set to benefit from the switch after the crisis. Much of this increase has come from new consumers (older generations over 60), who began ordering online for the first time during the pandemic.
Despite a growing niche market of online wine sellers, pandemic lockdowns have dented the overall wine category's performance, yet it remains the largest contributor to Alcoholic Drinks e-commerce size in France.
Pet food
E-commerce sales are rising in all areas of pet care in France, enabling new online pet care businesses to emerge, especially in the lucrative pet food category. Customers can order direct home delivery of heavy products, such as dry dog food in bulk, and can compare prices.
The introduction of more private-label pet food includes online platforms and other services such as monthly subscription boxes and automatic ordering, which are becoming increasingly popular and continue to affect sales in traditional channels.
Industry dynamics and opportunities
E-commerce size and growth
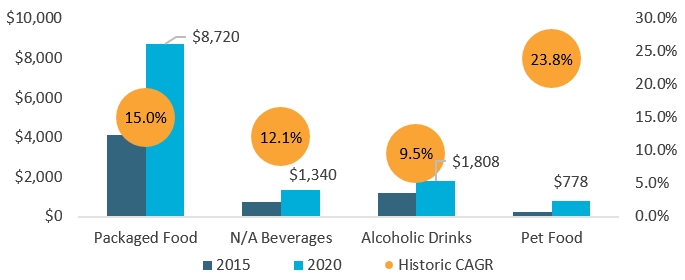
Description of above image
| Market | 2015 | 2020 | Historic CAGR* |
|---|---|---|---|
| Packaged Food | $4,138 | $8,720 | 15.0% |
| Non-Alcoholic Beverages | $723 | $1,340 | 12.1% |
| Alcoholic Drinks | $1,210 | $1,808 | 9.5% |
| Pet Food | $255 | $778 | 23.8% |
| *CAGR: Compound Annual Growth Rate | |||
Source: Euromonitor International
Competitive environment
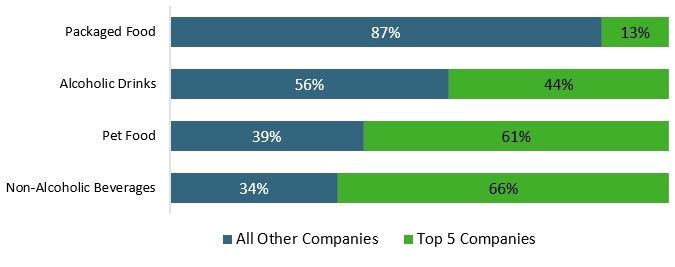
Description of above image
| Category | All Other Companies | Top 5 Companies |
|---|---|---|
| Packaged Food | 87% | 13% |
| Alcoholic Drinks | 56% | 44% |
| Pet Food | 39% | 61% |
| Non-Alcoholic Drinks | 34% | 66% |
Source: Euromonitor International
Key e-commerce websites
| Rank (SKUs[1] on Via) | Packaged Food | Non-Alcoholic Beverages | Alcoholic Drinks | Pet Food |
|---|---|---|---|---|
| 1 | Amazon (15.1 thousand SKUs) | Amazon (5.7 thousand) | Amazon (7.0 thousand) | Amazon (17.9 thousand) |
| 2 | Carrefour (8.6 thousand) | Carrefour (1.9 thousand) | Carrefour (2.6 thousand) | Miscota (11.8 thousand) |
| 3 | Casino (6.1 thousand) | Casino (1.0 thousand) | Auchan (2.2 thousand) | Zooplus (7.6 thousand) |
| 4 | Courses U (4.3 thousand) | Cora (0.9 thousand) | Cora (1.1 thousand) | Truffaut (3.0 thousand) |
| 5 | Auchan (3.1 thousand) | Courses U (0.7 thousand) | Cdiscount (1.1 thousand) | Croquetteland (2.7 thousand) |
|
1: SKU data comes from Euromonitor International's proprietary Via data extraction tool, and was extracted in March 2021 |
||||
Key highlights for Canadian producers
Packaged food
Economic uncertainty has French consumers seeking value-priced groceries, which has led to an increase in private label product sales, but also bodes well for prepared ready meals and processed/frozen meat and seafood that is considered cheaper than making protein-rich meals with fresh ingredients from scratch.
Non-alcoholic beverages
France remains a coffee culture, with this category expected to be the largest of any non-alcoholic beverage with more than Can$2 billion in retail sales by 2025. Bottled water is 2nd largest and is expected to reach Can$4.6 billion in 2025.
Alcoholic drinks
Canadian Whisky sales have actually been on a slight decline in France, whereas Canadian beer imports have increased at a 17.6% CAGR over the past five years.
Pet food
In addition to Amazon, pure play pet care websites Miscota and zooplus are substantial contributors to e-commerce sales of pet food in France.