
Market overview
The most developed market in terms of packaged food and beverage sales through e-commerce in 2020.
South Korea is the smallest market in terms of total market demand, but most penetrated in terms of e-commerce as a distribution channel.
Double-digit annual growth was seen in the size of leading Canadian product category imports by South Korea.
South Korean websites list hundreds of thousands more packaged food and beverage SKUs than any of the other nine markets under review.
| Metric | Value | Rank (of 10) |
|---|---|---|
| Total Packaged Food and Beverage Market in 2020 | Can$60.8 billion | 10th |
| E-commerce Channel Size of Total Packaged Food and Beverage in 2020 | Can$8.0 billion | 6th |
| E-commerce Channel Share of Total Packaged Food and Beverage in 2020 | 13.2% | 1st |
| Size of Canadian Packaged Food and Beverage Imports in 2019 | Can$529 million | 4th |
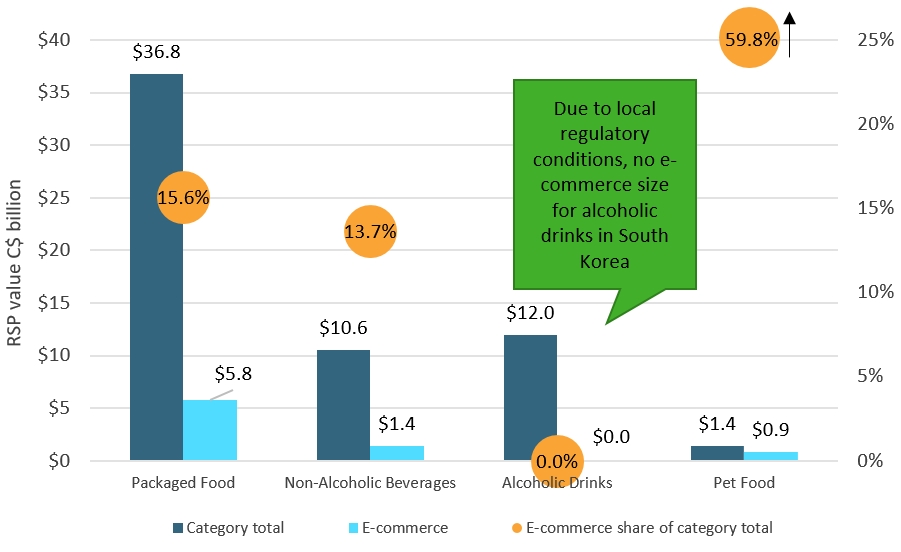
Description of above image
| Category | Category total | E-commerce | E-commerce share of category total |
|---|---|---|---|
| Packaged Food | $36.8 | $5.8 | 15.6% |
| Non-Alcoholic Beverages | $10.6 | $1.4 | 13.7% |
| Alcoholic Drinks[1] | $12.0 | $0.0 | 0.0% |
| Pet Food | $1.4 | $0.9 | 59.8% |
| 1: Due to local regulatory conditions, no e-commerce size for alcoholic drinks in South Korea. | |||
Source: Euromonitor International
Leading import and e-commerce product categories
| Product Category | Imports from Canada (2019, Can$ million) | Historic CAGR* (2014-2019) |
|---|---|---|
| Fats and Oils | $157.5 | 13.5% |
| Processed Meat and Seafood | $150.5 | 26.7% |
| Food Preparations | $123.0 | 13.2% |
| Processed Fruit and Vegetables | $40.6 | 32.8% |
| Dog and Cat Food | $24.8 | 32.4% |
| *CAGR: Compound Annual Growth Rate | ||
| Product Category | E-commerce Channel Sales (2020, Can$ million) | Share of E-commerce of all distribution (2020) | Historic E-commerce CAGR* (2015-2020) |
|---|---|---|---|
| Dairy | $1,233 | 19.9% | 15.6% |
| Pet Food | $852 | 59.8% | 17.5% |
| Sauces, Dressings, Condiments | $493 | 23.4% | 27.5% |
| Ready Meals/Food Preps | $415 | 15.3% | 22.2% |
| Processed Meat and Seafood | $373 | 35.5% | 67.2% |
| *CAGR: Compound Annual Growth Rate | |||
Industry split of packaged food and beverage e-commerce channel sales in South Korea (2020)
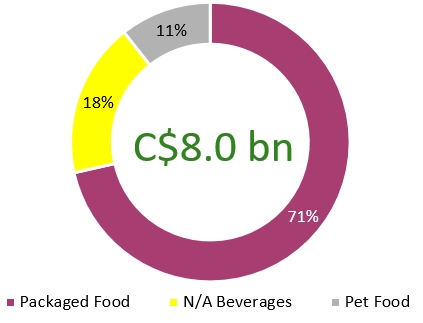
Description of above image
| Category | Packaged food and beverage e-commerce channel sales in South Korea |
|---|---|
| Packaged Food | 71% |
| Non-Alcoholic Beverages | 18% |
| Pet Food | 11% |
| Total | Can$8.0 billion |
No product category reached Can$1 billion in e-commerce channel sales in 2020.
| Product Category | Value of Canadian imports by France (Can$ million) | E-commerce channel sales Can$ million | E-commerce channel share (%) of all distribution channels in 2020 |
|---|---|---|---|
| Carbonates and Bottled Water | 2.01 | 299 | 11.3% |
| Hot Drinks | 0.49 | 478 | 15.9% |
| Juice | 0.08 | 228 | 5.6% |
| Pet Food | 24.83 | 853 | 59.8% |
| Processed Meat and Seafood | 150.48 | 373 | 8.0% |
| Processed Fruits and Vegetables | 40.57 | 17 | 12.3% |
| Ready Meals/ Food Preparations | 123 | 415 | 15.3% |
| Savoury Snacks | 3.66 | 123 | 5.1% |
| Syrups and Sweeteners | 6.61 | 493 | 23.4% |
| Confectionary | 8.16 | 83 | 4.6% |
| Fats and Oils | 157.49 | 79 | 14.5% |
|
Source: Euromonitor International (e-commerce channel sales) and UN Comtrade (Canadian import data) |
|||
Sector snapshot
Packaged food
Ready meals recorded a spike in value growth in 2020 thanks to offering convenient home meal replacements and restaurant meal replacements amid the COVID-19 pandemic.
With both adults and children spending more time at home, confectionery, sweet biscuits and savory snacks have all experienced increased consumption. Moving forward, ready meals, processed meat and seafood, and processed vegetables are expected to see further market growth.
Non-alcoholic beverages
The pandemic brought about a greater shift to e-commerce which offers convenience, greater price competition, and home delivery of bulky items with a wider range of packaging formats.
Both retailers and manufacturers shifted toward e-commerce, with multiple soft drink players introducing direct-to-consumer online sites, particularly for bottled water. In the short term, more "at-home" products are expected to see strong performance through e-commerce in South Korea, with larger formats remaining popular to serve an entire family.
Alcoholic drinks
While the Korean tax authorities made an allowance for consumers to purchase alcohol online in April 2020, it is strictly a buy-online-pickup-in-store (BOPIS) program and thus not considered true e-commerce sales.
Also in 2020, the South Korean government introduced a new volume-based excise tax system for all alcoholic drinks, and this is expected to benefit locally produced beer, enabling craft beer to be more competitive.
Pet food
The main trends underpinning growth in the past few years and moving forward are the expansion of the pet population, especially cats and small breed dogs, and the increasing propensity of Korean pet owners to pamper and humanize their pets, offering them food that is human grade, organic and/or holistic.
Nearly 60% of pet food was sold via e-commerce in 2020, as many Korean pet owners are now in the habit of purchasing all of their pet care products online due to the convenience of home delivery, especially for bulkier, heavier food packages.
Industry dynamics and opportunities
E-commerce size and growth
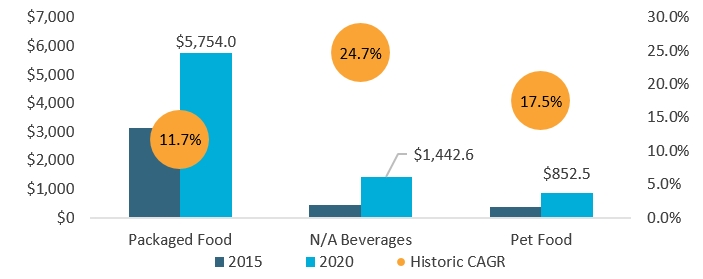
Description of above image
| Market | 2015 | 2020 | Historic CAGR* |
|---|---|---|---|
| Packaged Food | $3,149.5 | $5,754.0 | 11.7% |
| Non-Alcoholic Beverages | $456.6 | $1,442.6 | 24.7% |
| Pet Food | $362.6 | $852.5 | 17.5% |
| *CAGR: Compound Annual Growth Rate | |||
Source: Euromonitor International
Competitive environment
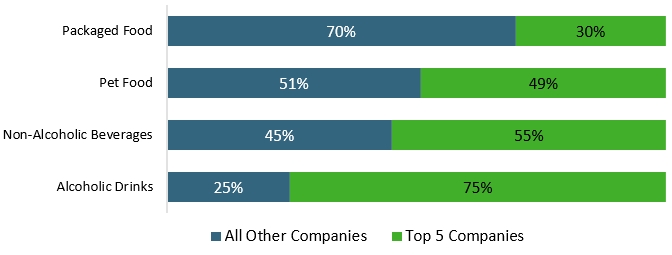
Description of above image
| Category | All Other Companies | Top 5 Companies |
|---|---|---|
| Packaged Food | 70% | 30% |
| Pet Food | 51% | 49% |
| Non-Alcoholic Beverages | 45% | 55% |
| Alcoholic Drinks | 25% | 75% |
Source: Euromonitor International
Key e-commerce websites
| Rank (SKUs[1] on Via) | Packaged Food | Non-Alcoholic Beverages | Alcoholic Drinks | Pet Food |
|---|---|---|---|---|
| 1 | GMarket (614.1 thousand SKUs) | GMarket (277.9 thousand) | GMarket (619) | GMarket (167.9 thousand) |
| 2 | Interpark (506.1 thousand) | Interpark (207.8 thousand) | Interpark (166) | Tmon (154.5 thousand) |
| 3 | Tmon (484.5 thousand) | Tmon (158.6 thousand) | Tmon (111) | Interpark (101.6 thousand) |
| 4 | Lotte (111.7 thousand) | Lotte (26.2 thousand) | Lotte (48) | CJ Mall (20.3 thousand) |
| 5 | 11th Street (30.1 thousand) | 11th Street (10.3 thousand) | 11th Street (13) | GS Shop (19.4 thousand) |
|
1: SKU data comes from Euromonitor International's proprietary Via data extraction tool, and was extracted in March 2021 |
||||
Key highlights for Canadian producers
Packaged food
The leading Canadian import product categories are the same ones that will benefit from more at-home meal consumption, namely ready meals and processed meats & seafood, thanks to their time-saving convenience for younger Koreans.
Non-alcoholic beverages
The three leading e-commerce sites offer over 600,000 non-alcoholic beverage SKUs, an indication of the willingness to stock a wide array of products and brands. Over the forecast period, bottled water (7.9% 2020-25 value CAGR) and sports drinks (5.3%) are expected to see the highest growth.
Alcoholic drinks
True e-commerce fulfillment is not allowed in South Korea; market entry for an international manufacturer requires sales through physical retail outlets or on-trade establishments.
Pet food
The South Korean pet product market is far more fragmented than in most developed countries, with dynamic local players presenting a strong challenge to global leaders.