
Key takeaways
The 10 countries under review registered Can$189 billion in packaged food and beverage sales through the e-commerce channel in 2020.
China is the largest e-commerce market overall with value sales of Can$77 billion in 2020 and lead in three of the four industry sectors under review (packaged food, alcoholic drinks, non-alcoholic beverages), owing to a large customer base and developed e-commerce giants such as Alibaba, JD.com, Tmall, Meituan, Pinduoduo, and others.
On an adult per capita basis, consumers in the United Kingdomspent the most on packaged food and beverage on e-commerce sites in 2020, at more than Can$460 per adult, while France is second (Can$335), and United States third ($264).
Canada's e-commerce packaged food and beverage market size was $3.0 billion in 2020, equal to 1.6% of the 10-country aggregate.
India (Can$1.5 billion) and Mexico (Can$1.1 billion) packaged food and beverage e-commerce were the smallest in 2020, but both have been growing tremendously at 63% and 41% 2015-2020 Compound Annual Growth Rate (CAGR), respectively, and are poised to be high performers in the years ahead.
At a sector level, Pet Food e-commerce sales have quintupled from 2015 (Can$4.1 billion) to 2020 ($20.0 billion) and the 49% review period CAGR is double that of the packaged food sector.
All countries represent export opportunities for Canadian producers, even if the country ranked poorly in the scorecard tool. For example, Germany is a very fragmented market across industry sectors; Japan is the third largest importer of Canadian food and beverage products; and South Korea is the most developed country of the 10 in terms of e-commerce share of total retail distribution.
Cross-country comparison
Understand the relative attractiveness and characteristics of the packaged food and beverage e-commerce landscape across the 10 countries included in the study
Packaged food
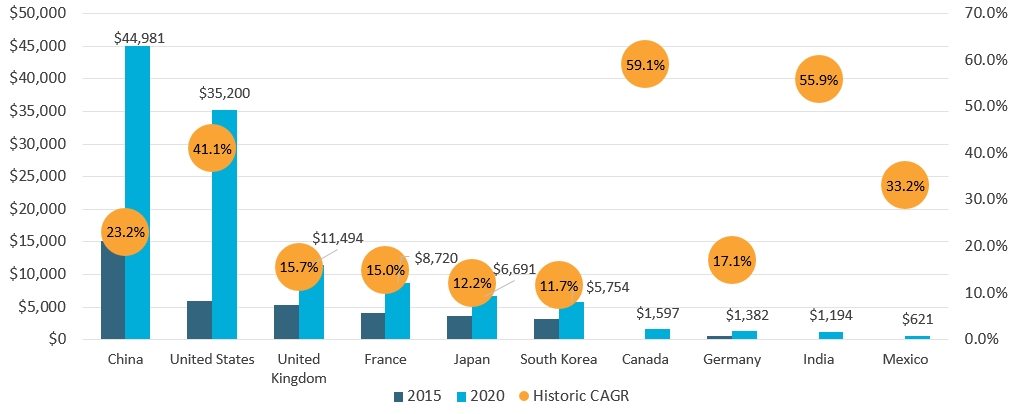
Combined Packaged Food e-commerce channel size for all 10 countries rose at a 25% CAGR from Can$38.3 billion in 2015 to Can$117.6 billion in 2020.
China and United States accounted for 68% of packaged food e-commerce channel size in 2020 among the 10 countries under review.
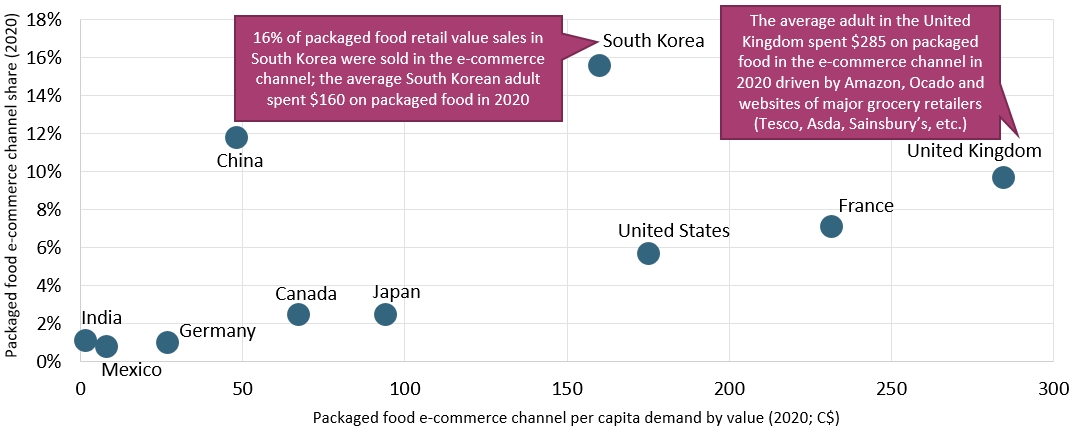
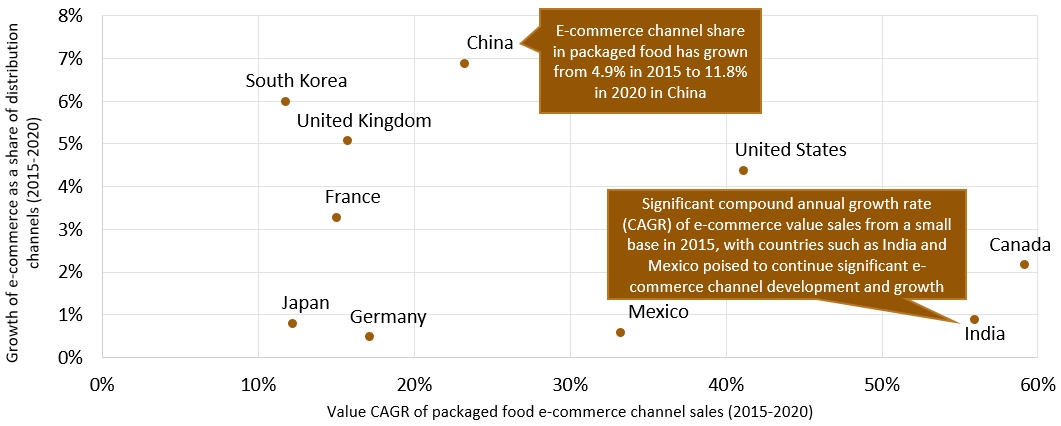
E-commerce channel share of distribution for packaged food is highest in South Korea, while per capita e-commerce spend on packaged food is greatest in the United Kingdom.
China's packaged food e-commerce channel share of distribution has grown the most in the past five years, while Canada registered highest CAGR for packaged food e-commerce.
| Rank | Country | Score |
|---|---|---|
| 1 | China | 108 |
| 2 | United States | 104 |
| 2 | United Kingdom | 104 |
| 4 | France | 96 |
| 5 | Canada | 76 |
| 5 | Japan | 76 |
| 5 | India | 76 |
| 8 | Germany | 72 |
| 8 | South Korea | 72 |
| 10 | Mexico | 56 |
| Note: Sector scorecard maximum score was 140 points per market | ||
Description of above image
| Market | 2015 | 2020 | Historic CAGR* |
|---|---|---|---|
| China | $15,141 | $44,981 | 23.2% |
| United States | $6,004 | $35,200 | 41.1% |
| United Kingdom | $5,299 | $11,494 | 15.7% |
| France | $4,138 | $8,720 | 15.0% |
| Japan | $3,592 | $6,691 | 12.2% |
| South Korea | $3,150 | $5,754 | 11.7% |
| Canada | $149 | $1,597 | 59.1% |
| Germany | $598 | $1,382 | 17.1% |
| India | $124 | $1,194 | 55.9% |
| Mexico | $141 | $621 | 33.2% |
*CAGR: Compound Annual Growth Rate |
|||
Source: Euromonitor International Packaged Food Passport Database
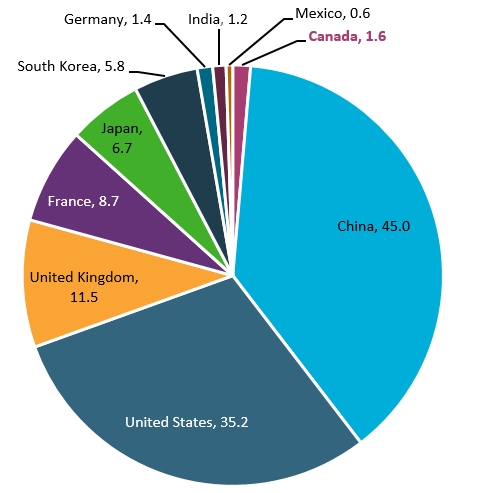
Canada's packaged food e-commerce channel size of Can$1.6 billion is larger than Germany, India and Mexico.
Description of above image
- Canada: 1.6
- China: 45.0
- United States: 35.2
- United Kingdom: 11.5
- France: 8.7
- Japan: 6.7
- South Korea: 5.8
- Germany: 1.4
- India: 1.2
- Mexico: 0.6
Source: Euromonitor International Packaged Food Passport Database
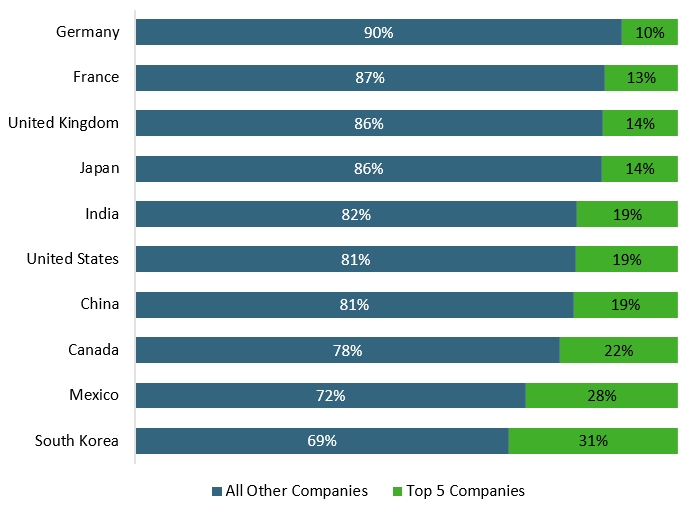
The three European markets have the largest share of sales for non-Top 5 companies.
Description of above image
| Market | All Other Companies | Top 5 Companies |
|---|---|---|
| Germany | 90% | 10% |
| France | 87% | 13% |
| United Kingdom | 86% | 14% |
| Japan | 86% | 14% |
| India | 82% | 19% |
| United States | 81% | 19% |
| China | 81% | 19% |
| Canada | 78% | 22% |
| Mexico | 72% | 28% |
| South Korea | 69% | 31% |
Description of above image
| Market | Packaged food e-commerce channel per capita demand by value (2020; Can$) | Packaged food e-commerce channel share (2020) |
|---|---|---|
| United Kingdom[1] | 284.5 | 10% |
| France | 231.6 | 7% |
| United States | 174.9 | 6% |
| South Korea[2] | 160.1 | 16% |
| Japan | 93.9 | 3% |
| Canada | 67.2 | 3% |
| China | 47.9 | 12% |
| Germany | 26.8 | 1% |
| Mexico | 8 | 1% |
| India | 1.4 | 1% |
1: The average adult in the United Kingdom spent $285 on packaged food in the e-commerce channel in 2020 driven by Amazon, Ocado and websites of major grocery retailers (Tesco, Asda, Sainsbury's, etc.). 2: 16% of packaged food retail value sales in South Korea were sold in the e-commerce channel; the average South Korean adult spent $160 on packaged food in 2020. |
||
Source: Euromonitor International Packaged Food Passport Database
Description of above image
| Market | Compound annual growth rate in value of e-commerce sales (2015-2020) | Growth of e-commerce as a share of distribution channels (2015-2020) |
|---|---|---|
| China[1] | 23% | 7% |
| India[2] | 56% | 1% |
| Japan | 12% | 1% |
| Korea | 12% | 6% |
| Mexico | 33% | 1% |
| Canada | 59% | 2% |
| United States | 41% | 4% |
| France | 15% | 3% |
| Germany | 17% | 1% |
| United Kingdom | 16% | 5% |
1: E-commerce channel share in packaged food has grown from 4.9% in 2015 to 11.8% in 2020 in China. 2: Significant compound annual growth rate (CAGR) of e-commerce value sales from a small base in 2015, with countries such as India and Mexico poised to continue significant e-commerce channel development and growth. |
||
Source: Euromonitor International Packaged Food Passport Database
Non-alcoholic beverages
Combined non-alcoholic beverages e-commerce channel size for all 10 countries posted a 17% CAGR from Can$8.8 billion in 2015 to Can$19.4 billion in 2020.
China accounted for 30% of e-commerce channel size in non-alcoholic beverages in 2020 across the 10 countries under review.
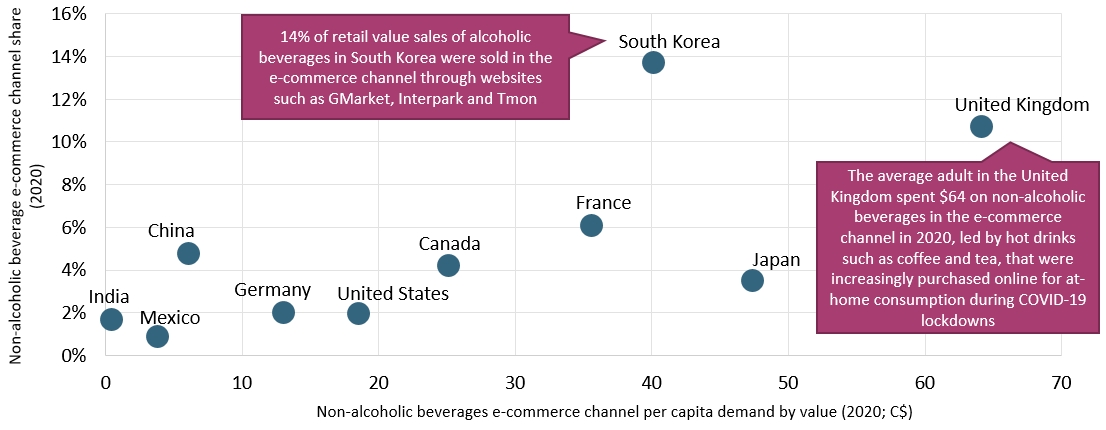
E-commerce channel share of distribution for non-alcoholic beverages is highest in South Korea, while per capita e-commerce spend for the industry is greatest in the United Kingdom.
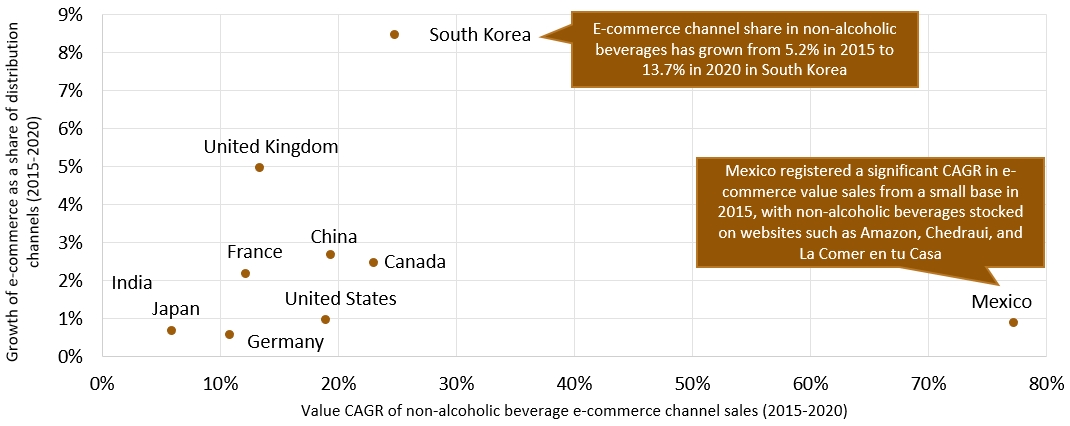
South Korea's e-commerce channel share of distribution of non-alcoholic beverages has grown the most in the past five years, while Mexico had the highest channel CAGR.
| Rank | Country | Score |
|---|---|---|
| 1 | United Kingdom | 116 |
| 1 | China | 116 |
| 3 | South Korea | 100 |
| 4 | United States | 96 |
| 5 | Canada | 80 |
| 6 | France | 72 |
| 7 | Germany | 68 |
| 7 | Mexico | 68 |
| 9 | Japan | 64 |
| 10 | India | 60 |
| Note: Sector scorecard maximum score was 140 points per market | ||
Description of above image
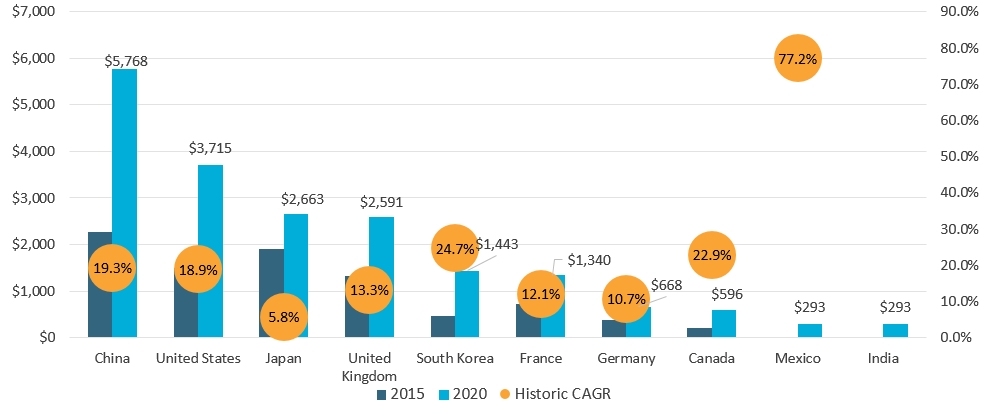
| Market | 2015 | 2020 | Historic CAGR* |
|---|---|---|---|
| China | $2,275 | $5,768 | 19.3% |
| United States | $1,490 | $3,715 | 18.9% |
| Japan | $1,913 | $2,663 | 5.8% |
| United Kingdom | $1,321 | $2,591 | 13.3% |
| South Korea | $457 | $1,443 | 24.7% |
| France | $723 | $1,340 | 12.1% |
| Germany | $383 | $668 | 10.7% |
| Canada | $203 | $596 | 22.9% |
| Mexico | $16 | $293 | 77.2% |
| India | $0 | $293 | Not available[1] |
| *CAGR: Compound Annual Growth Rate | |||
1: India does not include CAGR as the database did not estimate any e-commerce sales in 2015.
Source: Euromonitor International Soft Drinks and Hot Drinks Passport Databases
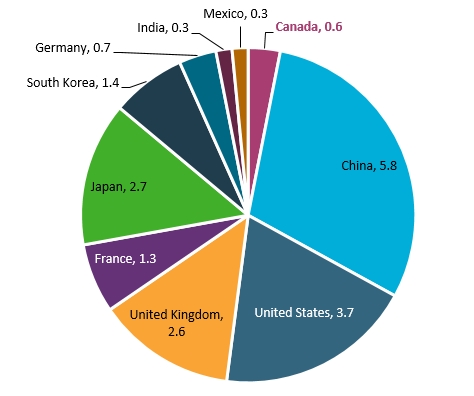
Canada's non-alcoholic beverages e-commerce channel size of Can$0.6 billion is only larger than India and Mexico.
Description of above image
- Canada: 0.6
- China: 5.8
- United States: 3.7
- United Kingdom: 2.6
- France: 1.3
- Japan: 2.7
- South Korea: 1.4
- Germany: 0.7
- India: 0.3
- Mexico: 0.3
Source: Euromonitor International Soft Drinks and Hot Drinks Passport Databases
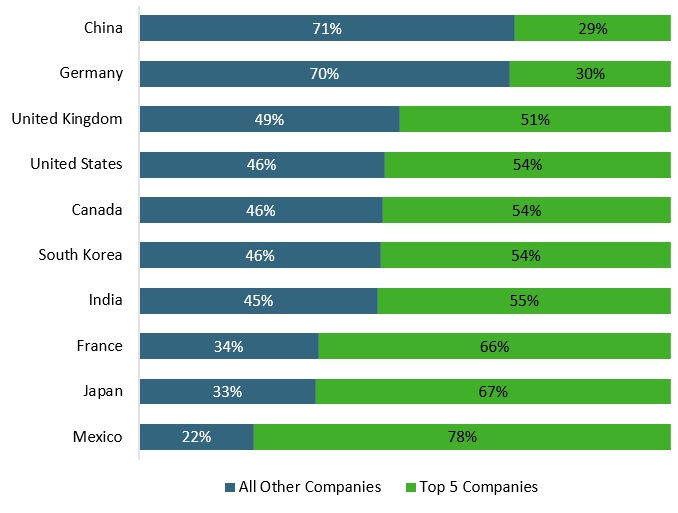
China and Germany are the only markets where non-Top 5 companies account for over half of industry retail value sales
Description of above image
| Market | All Other Companies | Top 5 Companies |
|---|---|---|
| China | 71% | 29% |
| Germany | 70% | 30% |
| United Kingdom | 49% | 51% |
| United States | 46% | 54% |
| Canada | 46% | 54% |
| South Korea | 46% | 54% |
| India | 45% | 55% |
| France | 34% | 66% |
| Japan | 33% | 67% |
| Mexico | 22% | 78% |
Source: Euromonitor International Soft Drinks and Hot Drinks Passport Databases
Description of above image
| Market | Non-alcoholic beverages e-commerce channel per capita demand by value (2020; Can$) | Non-alcoholic beverage e-commerce channel share (2020) |
|---|---|---|
| United Kingdom[1] | 64.1 | 11% |
| France | 35.6 | 6% |
| United States | 18.5 | 2% |
| South Korea[2] | 40.1 | 14% |
| Japan | 47.4 | 4% |
| Canada | 25.1 | 4% |
| China | 6.1 | 5% |
| Germany | 13 | 2% |
| Mexico | 3.8 | 1% |
| India | 0.4 | 2% |
1: The average adult in the United Kingdom spent $64 on non-alcoholic beverages in the e-commerce channel in 2020, led by hot drinks such as coffee and tea, that were increasingly purchased online for at-home consumption during COVID-19 lockdowns. 2: 14% of retail value sales of alcoholic beverages in South Korea were sold in the e-commerce channel through websites such as GMarket, Interpark and Tmon. |
||
Source: Euromonitor International Soft Drinks and Hot Drinks Passport Databases
Description of above image
| Market | Compound annual growth rate in value of e-commerce sales (2015-2020) | Growth of e-commerce as a share of distribution channels (2015-2020) |
|---|---|---|
| China | 19% | 3% |
| India | Not available | 2% |
| Japan | 6% | 1% |
| South Korea[1] | 25% | 9% |
| Mexico[2] | 77% | 1% |
| Canada | 23% | 3% |
| United States | 19% | 1% |
| France | 12% | 2% |
| Germany | 11% | 1% |
| United Kingdom | 13% | 5% |
1: E-commerce channel share in non-alcoholic beverages has grown from 5.2% in 2015 to 13.7% in 2020 in South Korea. 2: Mexico registered a significant compound annual growth rate (CAGR) in e-commerce value sales from a small base in 2015, with non-alcoholic beverages stocked on websites such as Amazon, Chedraui, and La Comer en tu Casa. |
||
Source: Euromonitor International Soft Drinks and Hot Drinks Passport Databases
Alcoholic drinks
Combined alcoholic drinks e-commerce channel size for all countries under review rose at a 12% CAGR from Can$20.1 billion in 2015 to Can$32.1 billion in 2020.
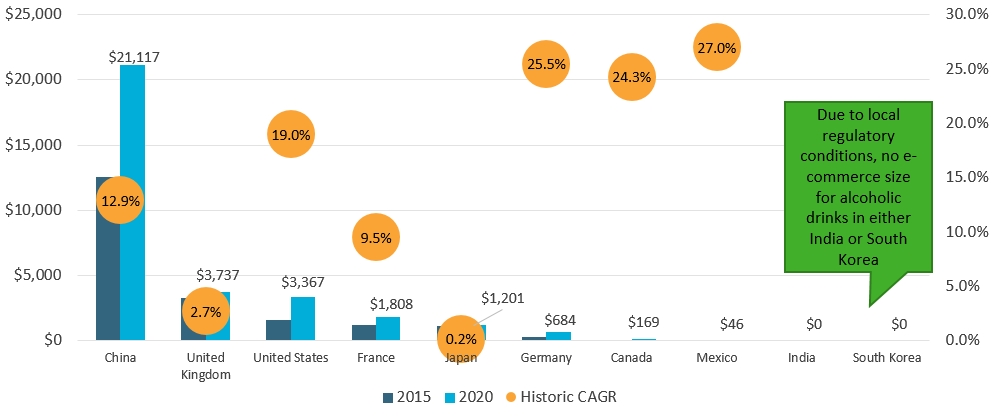
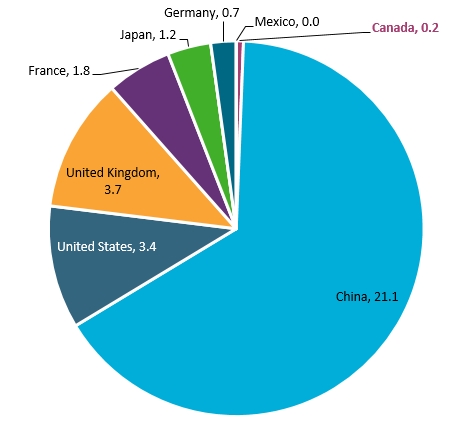
China accounted for two-thirds of e-commerce channel size in alcoholic drinks across the 10 countries under review.
E-commerce channel share of distribution for alcoholic drinks is highest in China, while per capita e-commerce spend on alcoholic drinks is greatest in the United Kingdom.
China's alcoholic drinks e-commerce channel share of distribution has grown the most over the past five years, and Mexico had the highest CAGR for alcoholic drinks e-commerce.
| Rank | Country | Score |
|---|---|---|
| 1 | China | 120 |
| 2 | United Kingdom | 108 |
| 3 | Germany | 100 |
| 3 | France | 100 |
| 5 | United States | 96 |
| 6 | Canada | 88 |
| 7 | Mexico | 72 |
| 8 | Japan | 64 |
| 9 | South Korea | 48 |
| 10 | India | 48 |
Source: Euromonitor International Alcoholic Drinks Passport Database Note: Sector scorecard maximum score was 140 points per market |
||
Description of above image
| Market | 2015 | 2020 | Historic CAGR* |
|---|---|---|---|
| China | $12,540 | $21,117 | 12.9% |
| United Kingdom | $3,244 | $3,737 | 2.7% |
| United States | $1,618 | $3,367 | 19.0% |
| France | $1,210 | $1,808 | 9.5% |
| Japan | $1,150 | $1,201 | 0.2% |
| Germany | $266 | $684 | 25.5% |
| Canada | $68 | $169 | 24.3% |
| Mexico | $17 | $46 | 27.0% |
| India | $0 | $0 | |
| South Korea[1] | $0 | $0 | |
*CAGR: Compound Annual Growth Rate 1: Due to local regulatory conditions, no e-commerce size for alcoholic drinks in either India or South Korea. |
|||
Source: Euromonitor International Alcoholic Drinks Passport Database
Canada's alcoholic drinks e-commerce channel size of Can$0.2 billion is only larger than Mexico, India and South Korea
Description of above image
- Canada: 0.2
- China: 21.1
- United States: 3.4
- United Kingdom: 3.7
- France: 1.8
- Japan: 1.2
- South Korea: 0.0
- Germany: 0.7
- India: 0.0
- Mexico: 0.0
Source: Euromonitor International Alcoholic Drinks Passport Database
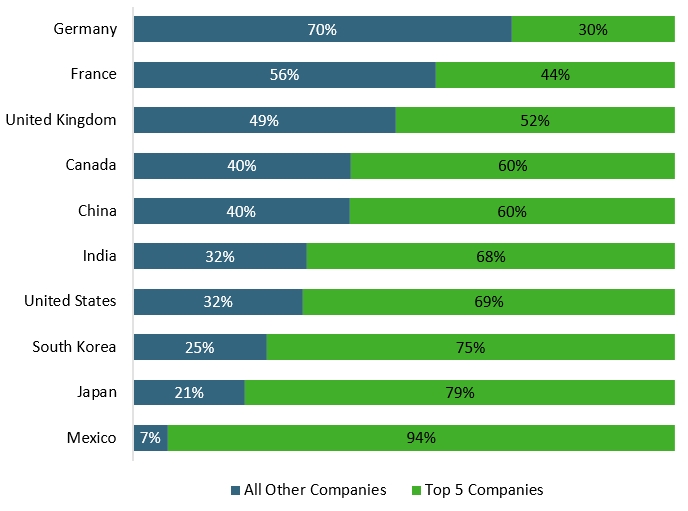
China and Germany are the only markets where non-Top 5 companies account for over half of industry retail value sales
Description of above image
| Market | All Other Companies | Top 5 Companies |
|---|---|---|
| Germany | 70% | 30% |
| France | 56% | 44% |
| United Kingdom | 49% | 52% |
| Canada | 40% | 60% |
| China | 40% | 60% |
| India | 32% | 68% |
| United States | 32% | 69% |
| South Korea | 25% | 75% |
| Japan | 21% | 79% |
| Mexico | 7% | 94% |
Source: Euromonitor International Alcoholic Drinks Passport Database
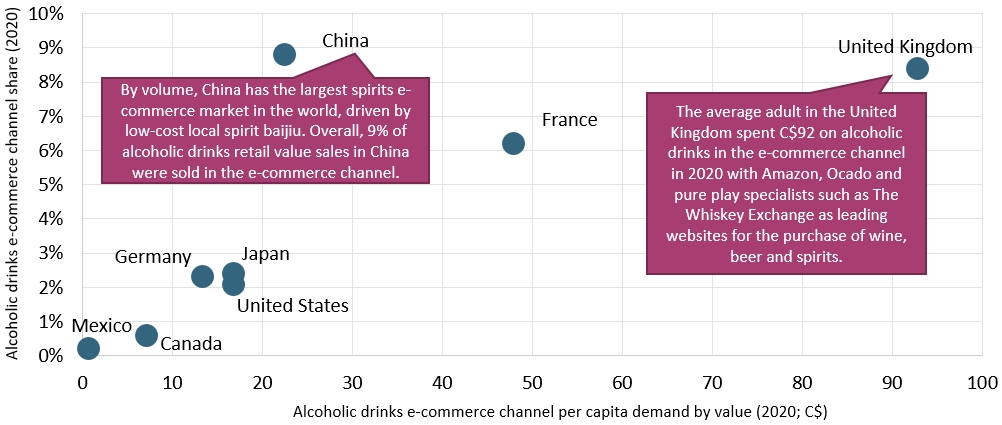
Description of above image
| Market | Alcoholic Drinks e-commerce channel per capita demand by value (2020; Can$) | Alcoholic beverage e-commerce channel share (2020) |
|---|---|---|
| United Kingdom[1] | 92.8 | 8% |
| France | 47.9 | 6% |
| United States | 16.7 | 2% |
| Japan | 16.8 | 2% |
| Canada | 7.1 | 1% |
| China[2] | 22.4 | 9% |
| Germany | 13.3 | 2% |
| Mexico | 0.6 | 0% |
1: The average adult in the United Kingdom spent Can$92 on alcoholic drinks in the e-commerce channel in 2020 with Amazon, Ocado and pure play specialists such as The Whiskey Exchange as leading websites for the purchase of wine, beer and spirits. 2: By volume, China has the largest spirits e-commerce market in the world, driven by low-cost local spirit baijiu. Overall, 9% of alcoholic drinks retail value sales in China were sold in the e-commerce channel. |
||
Source: Euromonitor International Alcoholic Drinks Passport Database
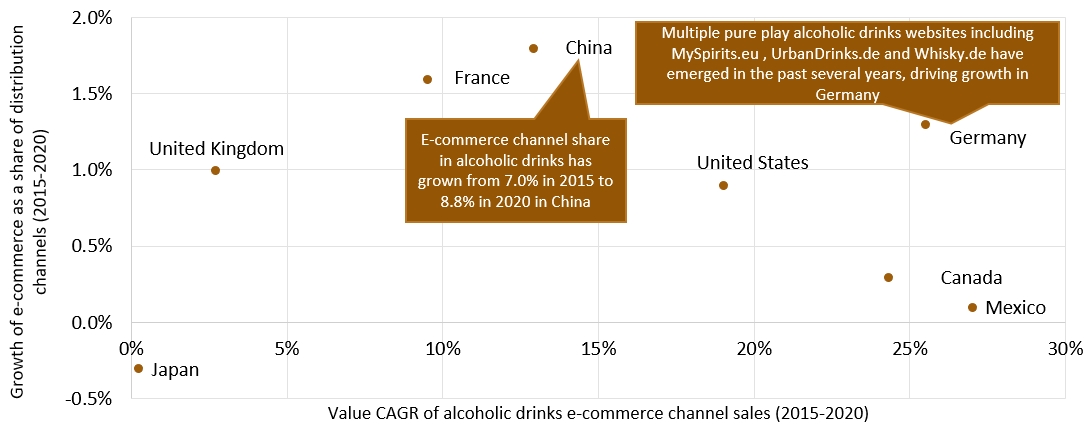
Description of above image
| Market | Compound annual growth rate in value of e-commerce sales (2015-2020) | Growth of e-commerce as a share of distribution channels (2015-2020) |
|---|---|---|
| China[1] | 13% | 1.8% |
| Japan | 0% | −0.3% |
| Mexico | 27% | 0.1% |
| Canada | 24% | 0.3% |
| United States | 19% | 0.9% |
| France | 10% | 1.6% |
| Germany[2] | 26% | 1.3% |
| United Kingdom | 3% | 1.0% |
1: E-commerce channel share in alcoholic drinks has grown from 7.0% in 2015 to 8.8% in 2020 in China. 2: Multiple pure play alcoholic drinks websites including MySpirits.eu, UrbanDrinks.de and Whisky.de have emerged in the past several years, driving growth in Germany. |
||
Source: Euromonitor International Alcoholic Drinks Passport Database
Pet food
Combined 10-country pet food e-commerce channel size rose at a 49% CAGR from Can$4.1 billion in 2015 to Can$20.0 billion in 2020.
The United States accounted for over 54% of pet food e-commerce channel size in 2020 across all 10 countries under review.
E-commerce channel share of distribution for pet food is highest in South Korea, while per capita e-commerce spend on pet food is greatest in the US
Pet food e-commerce share of category distribution in China, the United States and South Korea have each increased more than 15% since 2015
| Rank | Country | Score |
|---|---|---|
| 1 | China | 124 |
| 2 | United States | 112 |
| 3 | Canada | 96 |
| 4 | South Korea | 92 |
| 5 | France | 88 |
| 6 | Germany | 80 |
| 7 | United Kingdom | 68 |
| 8 | Mexico | 64 |
| 8 | India | 64 |
| 10 | Japan | 52 |
Source: Euromonitor International Pet Care Passport Database Note: Sector scorecard maximum score was 140 points per market |
||
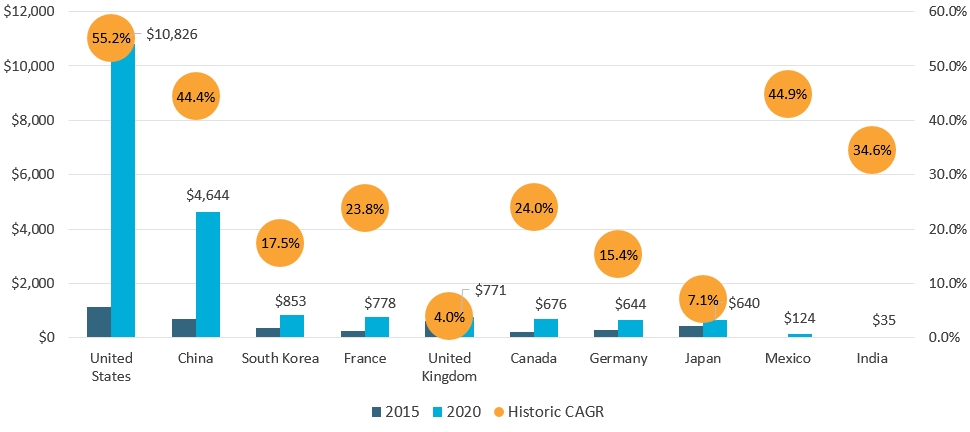
Description of above image
| Market | 2015 | 2020 | Historic CAGR* |
|---|---|---|---|
| United States | $1,146 | $10,826 | 55.2% |
| China | $705 | $4,644 | 44.4% |
| South Korea | $363 | $853 | 17.5% |
| France | $255 | $778 | 23.8% |
| United Kingdom | $605 | $771 | 4.0% |
| Canada | $220 | $676 | 24.0% |
| Germany | $301 | $644 | 15.4% |
| Japan | $433 | $640 | 7.1% |
| Mexico | $19 | $124 | 44.9% |
| India | $8 | $35 | 34.6% |
| *CAGR: Compound Annual Growth Rate | |||
Source: Euromonitor International Pet Care Passport Database
Canada's pet food e-commerce channel size of Can$0.7 billion is larger than Germany, Mexico and India
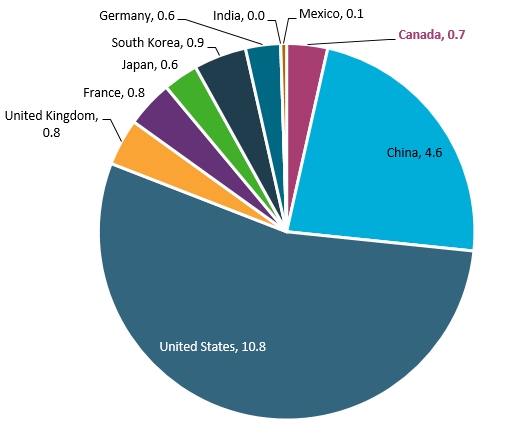
Description of above image
- Canada: 0.7
- China: 4.6
- United States: 10.8
- United Kingdom: 0.8
- France: 0.8
- Japan: 0.6
- South Korea: 0.9
- Germany: 0.6
- India: 0.0
- Mexico: 0.1
Source: Euromonitor International Pet Care Passport Database
China is the most fragmented market by split of pet food retail value sales from non-Top 5 companies
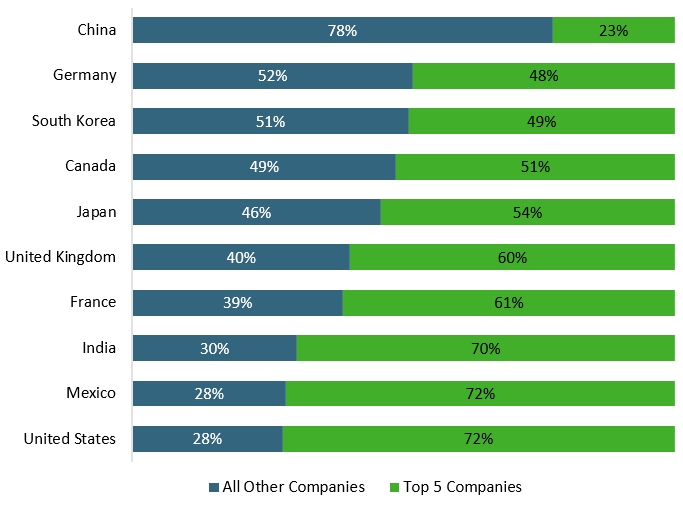
Description of above image
| Market | All Other Companies | Top 5 Companies |
|---|---|---|
| China | 78% | 23% |
| Germany | 52% | 48% |
| South Korea | 51% | 49% |
| Canada | 49% | 51% |
| Japan | 46% | 54% |
| United Kingdom | 40% | 60% |
| France | 39% | 61% |
| India | 30% | 70% |
| Mexico | 28% | 72% |
| United States | 28% | 72% |
Source: Euromonitor International Pet Care Passport Database
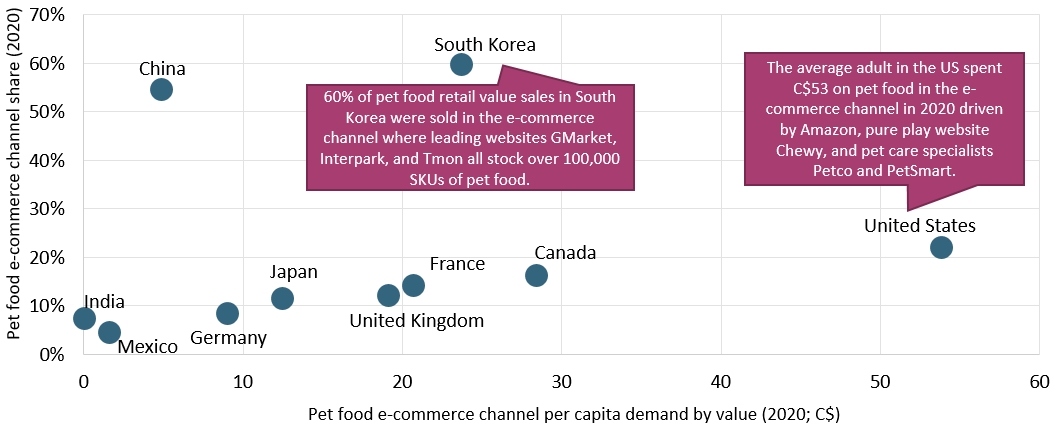
Description of above image
| Market | Pet food e-commerce channel per capita demand by value (2020; Can$) | Pet food e-commerce channel share (2020) |
|---|---|---|
| United Kingdom | 19.1 | 12% |
| France | 20.7 | 14% |
| United States[1] | 53.8 | 22% |
| South Korea[2] | 23.7 | 60% |
| Japan | 9 | 8% |
| Canada | 28.4 | 16% |
| China | 4.9 | 55% |
| Germany | 12.5 | 12% |
| Mexico | 1.6 | 5% |
| India | 0.04 | 7% |
1: The average adult in the United States spent Can$53 on pet food in the e-commerce channel in 2020 driven by Amazon, pure play website Chewy, and pet care specialists Petco and PetSmart. 2: 60% of pet food retail value sales in South Korea were sold in the e-commerce channel where leading websites GMarket, Interpark, and Tmon all stock over 100,000 SKUs of pet food. |
||
Source: Euromonitor International Alcoholic Drinks Passport Database
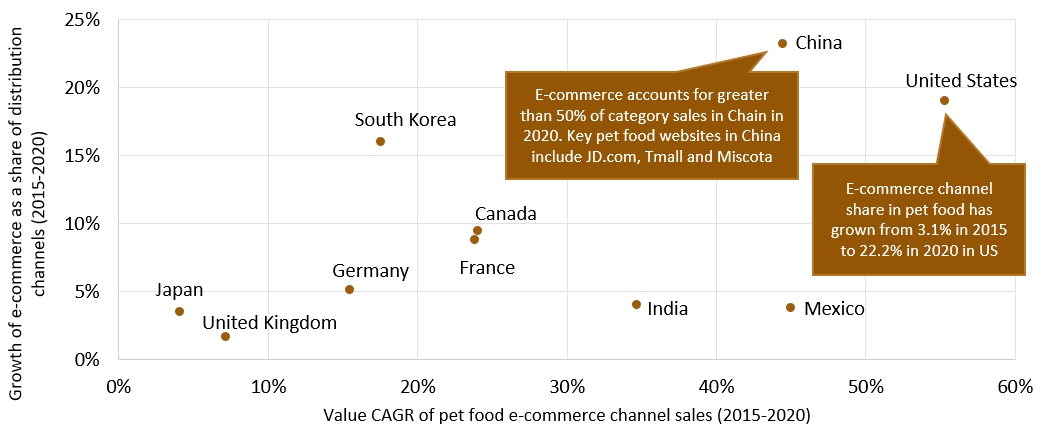
Description of above image
| Market | Compound annual growth rate in value of e-commerce sales (2015-2020) | Growth of e-commerce as a share of distribution channels (2015-2020) |
|---|---|---|
| China[1] | 44% | 23% |
| India | 35% | 4% |
| Japan | 7% | 2% |
| South Korea | 18% | 16% |
| Mexico | 45% | 4% |
| Canada | 24% | 10% |
| United States[2] | 55% | 19% |
| France | 24% | 9% |
| Germany | 15% | 5% |
| United Kingdom | 4% | 4% |
1: E-commerce accounts for greater than 50% of category sales in Chain in 2020. Key pet food websites in China include JD.com, Tmall and Miscota. 2: E-commerce channel share in pet food has grown from 3.1% in 2015 to 22.2% in 2020 in United States. |
||
Source: Euromonitor International Alcoholic Drinks Passport Database
Forecast growth
Looking ahead to 2025, it is forecast that the fastest e-commerce growth will come from markets that were fairly small in 2020, including Canada and India.
| Market | 2019 | 2020 | 2021 | 2022 | 2023 | 2024 | 2025 | 2020-2025 Size Gain | 2020-2025 CAGR* |
|---|---|---|---|---|---|---|---|---|---|
| China | 75.26 | 90.53 | 99.85 | 111.37 | 123.86 | 137.15 | 150.89 | 60.40 | 10.80% |
| United States | 46.13 | 102.15 | 111.25 | 108.21 | 105.56 | 121.93 | 142.23 | 40.10 | 6.80% |
| South Korea | 18.81 | 22.44 | 23.71 | 25.05 | 26.4 | 27.78 | 29.18 | 6.70 | 5.40% |
| United Kingdom | 14.06 | 25.27 | 23.93 | 25.93 | 27.72 | 28.98 | 30.17 | 4.90 | 3.60% |
| Japan | 12.94 | 14.69 | 16.44 | 18.43 | 20.65 | 23.04 | 25.57 | 10.90 | 11.70% |
| France | 11.87 | 16.21 | 18.17 | 19.53 | 20.72 | 21.71 | 22.96 | 6.80 | 7.20% |
| Germany | 2.8 | 3.72 | 3.52 | 3.92 | 4.4 | 4.97 | 5.7 | 2.00 | 8.90% |
| India | 1.96 | 3.56 | 5.71 | 8.7 | 12.68 | 17.76 | 23.98 | 20.40 | 46.40% |
| Canada | 1.22 | 2.53 | 3.36 | 4.33 | 5.29 | 6.27 | 7.21 | 4.70 | 23.30% |
| Mexico | 0.55 | 0.91 | 1.07 | 1.26 | 1.46 | 1.78 | 2.07 | 1.20 | 17.80% |
Source: Euromonitor Retailing Database (E-Commerce by Product Category) *CAGR: Compund Annual Growth Rate Please note this forecast e-commerce data comes from a separate database than others used in the scope of the analysis and excludes Pet Food |
|||||||||