
Market overview
Japan is the 3rd largest importer of Canadian packaged food and beverages and represents the 3rd largest market in 2020 in terms of total retail value sales.
Size of e-commerce is large, but the channel share in the overall retail environment is low and has not grown as fast as other markets under review.
Processed Meat and Seafood is largest Canadian import and e-commerce category in Japan.
Rakuten and Amazon are leading websites for food and beverage e-commerce placement in Japan.
| Metric | Value | Rank (of 10) |
|---|---|---|
| Total Packaged Food and Beverage Market in 2020 | Can$400 billion | 3rd |
| E-commerce Channel Size of Total Packaged Food and Beverage in 2020 | Can$11.2 billion | 5th |
| E-commerce Channel Share of Total Packaged Food and Beverage in 2020 | 2.8% | 6th |
| Size of Canadian Packaged Food and Beverage Imports in 2018 | Can$865 million | 3rd |
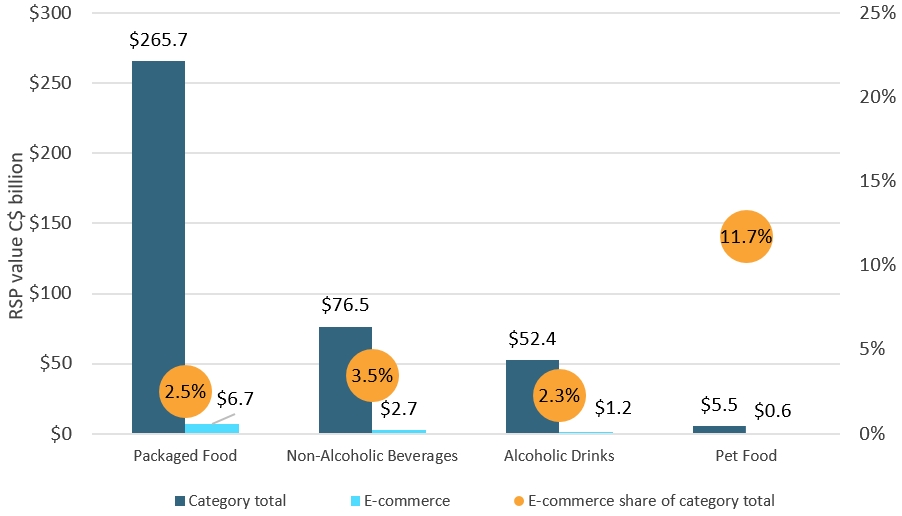
Description of above image
| Category | Category total | E-commerce | E-commerce share of category total |
|---|---|---|---|
| Packaged Food | $265.7 | $6.7 | 2.5% |
| Non-Alcoholic Beverages | $76.5 | $2.7 | 3.5% |
| Alcoholic Drinks | $52.4 | $1.2 | 2.3% |
| Pet Food | $5.5 | $0.6 | 11.7% |
Source: Euromonitor International
Leading import and e-commerce product categories
| Product Category | Imports from Canada (2018, Can$ million) | Historic CAGR* (2014-2018) |
|---|---|---|
| Processed Meat and Seafood | $388.0 | 1.4% |
| Ready Meals | $125.1 | 0.2% |
| Processed Fruits and Vegetables | $82.1 | −2.0% |
| Fats and Oils | $72.7 | 8.7% |
| Syrups and Sweeteners | $44.1 | −6.2% |
| *CAGR: Compound Annual Growth Rate | ||
| Product Category | E-commerce Channel Sales (2020, Can$ million) | Share of E-commerce of all distribution (2020) | Historic E-commerce CAGR* (2015-2020) |
|---|---|---|---|
| Processed Meat and Seafood | $1,434.2 | 2.4% | 7.8% |
| Carbonates/Bottled Water | $1,373.4 | 8.5% | 5.5% |
| Ready Meals | $923.3 | 3.0% | 18.7% |
| Sauces, Dressings and Condiments | $699.6 | 2.8% | 11.4% |
| Pet Food | $639.5 | 11.7% | 7.1% |
| *CAGR: Compound Annual Growth Rate | |||
Industry split of packaged food and beverage e-commerce channel sales in Japan (2020)
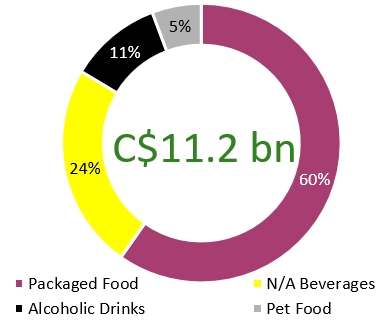
Description of above image
| Category | Packaged food and beverage e-commerce channel sales in Japan |
|---|---|
| Packaged Food | 60% |
| Non-Alcoholic Beverages | 24% |
| Alcoholic Drinks | 11% |
| Pet Food | 5% |
| Total | Can$11.2 billion |
Processed Meat and Seafood and Ready Meals benefit from the strong Canada-Japan trade relationship, while size of category distribution via e-commerce is significant.
| Product Category | Value of Canadian imports by France (Can$ million) | E-commerce channel sales Can$ million | E-commerce channel share (%) of all distribution channels in 2020 |
|---|---|---|---|
| Beer | 0.26 | 457.3 | 2.5% |
| Wine | 1.6 | 248.2 | 4.2% |
| Spirits | 12.6 | 191.8 | 3.0% |
| Carbonates and Bottled Water | 0.82 | 1000 | 4.8% |
| Hot Drinks | 1.4 | 507.4 | 5.2% |
| Juice | 1.4 | 81 | 2.8% |
| Pet Food | 14.4 | 639.5 | 11.7% |
| Processed Meat and Seafood | 447.1 | 1,069.10 | 2.4% |
| Processed Fruits and Vegetables | 82.2 | 72.9 | 2.2% |
| Ready Meals/ Food Preparations | 125.1 | 923.3 | 3.0% |
| Snack Foods | 9.8 | 551.5 | 2.2% |
| Dairy | 15.5 | 536.5 | 1.7% |
| Fats and Oils | 72.7 | 79.6 | 3.6% |
| Source: Euromonitor International (e-commerce channel sales) and UN Comtrade (Canadian import data) | |||
Sector snapshot
Packaged food
As the pandemic hit, many people chose to avoid physical stores entirely, switching to e-commerce and home shopping channels, both of which witnessed a surge in demand. As a result, grocery home delivery providers such as Oisix and Co-opdeli Consumers' Co-operative Union enjoyed a strong sales increase. Products such as noodles, frozen packaged foods and meal kits were among the categories to see the strongest spikes in home deliveries.
Non-alcoholic beverages
There are many soft drinks in Japan, and their main target group is consumers in the workplace, which is reflected in their marketing. Yet, the emergence of COVID-19 forced many players to rethink their strategies and reposition their products in order to stave off a more significant drop in sales.
Due to home seclusion, consumers shifted from on-the-go RTD options for hot drinks (coffee, tea) to ones that could be prepared at home, which are now frequently purchased via e-commerce.
Alcoholic drinks
Japan is the 3rd largest market globally for Spirits volume sold through e-commerce in 2019, with 19 million liters sold online. Beyond Rakuten and Amazon, pure play alcoholic drinks specialist e-commerce sites exist in Japan and could be approached about product placement. These include Musashiya, Saketry and Single Malt World.
Pet food
At over 10% share of distribution, e-commerce is becoming increasingly important in pet food, as consumers appreciate the convenience of ordering products online and having them delivered to their homes.
Cat ownership is on the rise, and within cat food, cat treats were the most dynamic part of the category in 2020 as consumers increasingly look to indulge their pets rather than simply provide basic nutrition.
Industry dynamics and opportunities
E-commerce size and growth
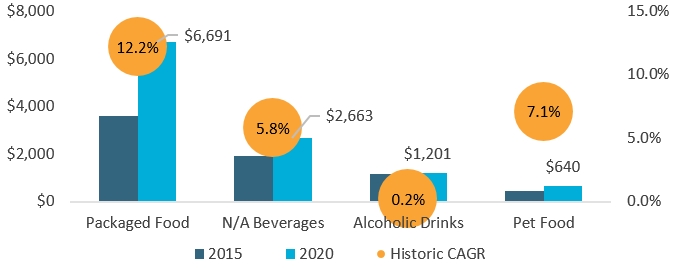
Description of above image
| Market | 2015 | 2020 | Historic CAGR* |
|---|---|---|---|
| Packaged Food | $3,592 | $6,691 | 12.2% |
| Non-Alcoholic Beverages | $1,913 | $2,663 | 5.8% |
| Alcoholic Drinks | $1,150 | $1,201 | 0.2% |
| Pet Food | $433 | $640 | 7.1% |
| *CAGR: Compound Annual Growth Rate | |||
Source: Euromonitor International
Competitive environment
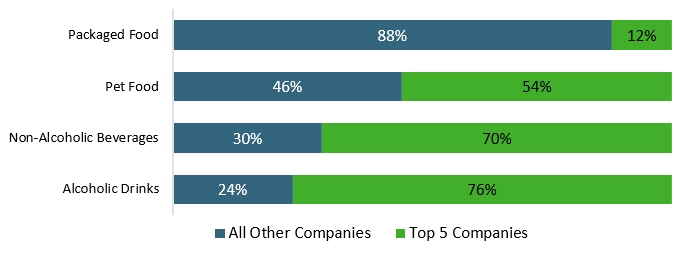
Description of above image
| Category | All Other Companies | Top 5 Companies |
|---|---|---|
| Packaged Food | 88% | 12% |
| Pet Food | 46% | 54% |
| Non-Alcoholic Beverages | 30% | 70% |
| Alcoholic Drinks | 24% | 76% |
Source: Euromonitor International
Key e-commerce websites
| Rank (SKUs[1] on Via) | Packaged Food | Non-Alcoholic Beverages | Alcoholic Drinks | Pet Food |
|---|---|---|---|---|
| 1 | Rakuten (203.1 thousand SKUs) | Rakuten (103.1 thousand) | Rakuten (118.0 thousand) | Rakuten (136.6 thousand) |
| 2 | Amazon (76.5 thousand) | Amazon (31.0 thousand) | Amazon (22.3 thousand) | Amazon (23.7 thousand) |
| 3 | Lohaco (18.1 thousand) | Lohaco (6.7 thousand) | Yodobashi Camera (3.9 thousand) | Miscota (10.4 thousand) |
| 4 | Yodobashi Camera (11.3 thousand) | Yodobashi Camera (4.5 thousand) | Bic Camera (2.7 thousand) | Lohaco (9.9 thousand) |
| 5 | AEON (5.0 thousand) | AEON (0.9 thousand) | Lohaco (2.2 thousand) | Yodobashi Camera (6.7 thousand) |
| 1: SKU data comes from Euromonitor International's proprietary Via data extraction tool, and was extracted in March 2021 | ||||
Key highlights for Canadian producers
Packaged food
Processed meat and seafood and ready meals e-commerce demand are growing due to consumer lifestyle adjustments amid COVID-19 and were the two largest Canada-to-Japan imported packaged food and beverage categories.
Non-alcoholic beverages
On an overall industry basis, health-oriented functional waters, juices and concentrates are expected to grow in soft drinks over the forecast period, while increased work-from-home arrangements drive demand for fresh coffee and tea in hot drinks.
Alcoholic drinks
This market is dominated by large Japanese trading houses, but there could be opportunity to grow Canadian Whisky demand through specialist retailers that carry international spirits.
Pet food
Overall cat food sales are projected to increase at a 4.0% CAGR to 2025 (vs. 0.9% for dog food) as owners seek premium products to treat their "members of the household."