
Market overview
Packaged food and beverage sales are expected to rise at a CAGR of 8.0% through 2025, twice the rate of China, the second fastest-growing market.
India's e-commerce market size in 2020 was larger only than Mexico.
Three packaged food categories surpassed Can$200 million in e-commerce sales in 2020.
While the size of e-commerce only reached Can$1.5 billion in 2020, this is a ten-fold increase versus 2015, when only $131 million of packaged food and beverage was sold online.
| Metric | Value | Rank (of 10) |
|---|---|---|
| Total Packaged Food and Beverage Market in 2020 | Can$152.8 billion | 7th |
| E-commerce Channel Size of Total Packaged Food and Beverage in 2020 | Can$1.5 billion | 9th |
| E-commerce Channel Share of Total Packaged Food and Beverage in 2020 | 1.0% | 9th |
| Size of Canadian Packaged Food and Beverage Imports in 2018 | Can$25 million | 9th |
Description of above image
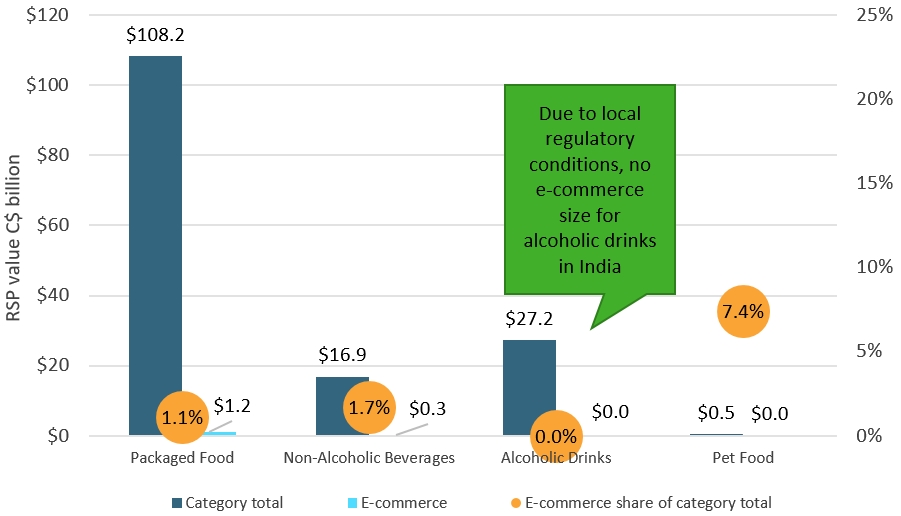
| Category | Category total | E-commerce | E-commerce share of category total |
|---|---|---|---|
| Packaged Food | $108.2 | $1.2 | 1.1% |
| Non-Alcoholic Beverages | $16.9 | $0.3 | 1.7% |
| Alcoholic Drinks[1] | $27.2 | $0.0 | 0.0% |
| Pet Food | $0.5 | $0.0 | 7.4% |
| 1: Due to local regulatory conditions, no e-commerce size for alcoholic drinks in India. | |||
Source: Euromonitor International
Leading import and e-commerce product categories
| Product Category | Imports from Canada (2018, Can$ million) | Historic CAGR* (2014-2018) |
|---|---|---|
| Fats and Oils | $14.0 | 44.9% |
| Syrups and Sweeteners | $4.3 | 6.9% |
| Food Preparations | $2.4 | 10.2% |
| Prepared/Preserved Seafood | $1.6 | 170.1% |
| Dog and Cat Food | $1.4 | 78.2% |
| *CAGR: Compound Annual Growth Rate | ||
| Product Category | E-commerce Channel Sales (2020, Can$ million) | Share of E-commerce of all distribution (2020) | Historic E-commerce CAGR* (2015-2020) |
|---|---|---|---|
| Dairy | $269 | 0.8% | Not available[1] |
| Ready Meals/Food Preps | $207 | 33.2% | 35.4% |
| Rice | $204 | 1.9% | 135.6% |
| Confectionary | $81 | 1.6% | 40.5% |
| Baby Food | $78 | 6.5% | Not available[1] |
|
*CAGR: Compound Annual Growth Rate 1: Not available for historic CAGR means online sales of the product did not exist in 2015 |
|||
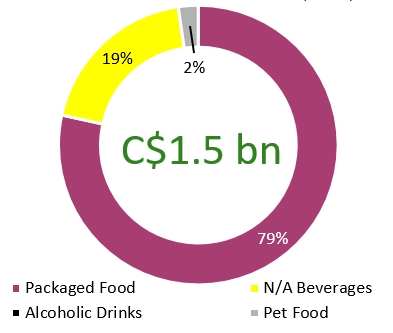
Industry split of packaged food and beverage e-commerce channel sales in India (2020)
Description of above image
| Category | Packaged food and beverage e-commerce channel sales in India |
|---|---|
| Packaged Food | 79% |
| Non-Alcoholic Beverages | 19% |
| Pet Food | 2% |
| Total | Can$1.5 billion |
Ready Meals sales via e-commerce doubled in value sales from 2019-20 in India.
| Product Category | Value of Canadian imports by France (Can$ million) | E-commerce channel sales Can$ million | E-commerce channel share (%) of all distribution channels in 2020 |
|---|---|---|---|
| Carbonates and Bottled Water | 0.8 | 40.3 | 1.3% |
| Hot Drinks | 0.1 | 104.7 | 1.7% |
| Syrups and Sweeteners | 4.3 | 7.6 | 0.2% |
| Pet Food | 1.4 | 35.0 | 7.4% |
| Processed Meat and Seafood | 1.6 | 6.2 | 1.9% |
| Processed Fruits and Vegetables | 0.8 | 6.7 | 2.2% |
| Ready Meals/ Food Preparations | 2.4 | 207.1 | 33.2% |
| Savoury Snacks | 0.1 | 2.3 | 0.1% |
| Fats and Oils | 14.0 | 29.8 | 0.1% |
| Source: Euromonitor International (e-commerce channel sales) and UN Comtrade (Canadian import data) | |||
Sector snapshot
Packaged food
Categories benefiting from the lockdown and greater in-home dining included butter, soft cheese, herbs and spices, and staples such as rice and edible oils. Convenience and ease of preparing and cooking food have also been the main drivers of categories such as noodles, pasta, spreads, and breakfast cereals.
Products such as olive oil, soybean oil, and fortified packaged food products such as bread experienced much higher demand in 2020 as Indian consumers perceived them as beneficial to their health, making them more resistant to the coronavirus.
Non-alcoholic beverages
E-commerce gained share during the pandemic, with particularly strong growth for carbonates and concentrates, benefiting from the availability of bulk pack sizes at low prices. Both PepsiCo and Coca-Cola partnered with Common Services Centres (CSC) to list their products on the Grameen e-Store, a leading site for online groceries. In hot drinks, most major players registered 100% growth through their e-commerce channel. Something Brewing launched an e-commerce marketplace offering a variety of coffee equipment in addition to domestic and international coffee brands.
Alcoholic drinks
In the beginning of the COVID-19 lockdown, the Indian government prohibited alcohol sales for a short time, while governments in 18 states implemented a "Corona Cess" tax on food/drink/tobacco specialists that ranged from 10% to 75% on alcohol, which priced beer outside the reach of most consumers.
India prohibits the sale of alcoholic drinks via e-commerce, but as of late 2020, some Indian states have decided to make alcohol more available through online sales and on-demand delivery or in-person pickup.
Pet food
2020 retail value sales for pet food was less than Can$500 million, which makes it the smallest market for pet food across the 10 countries under review. Pet ownership is increasing in India due to urbanization and rising disposable incomes among middle-class households, coupled with changing attitudes in regards to pets. Most owners in India still feed their dogs and cats non-prepared food, but for the minority that purchase packaged pet food, there is a growing focus on delivering optimum nutrition.
Industry dynamics and opportunities
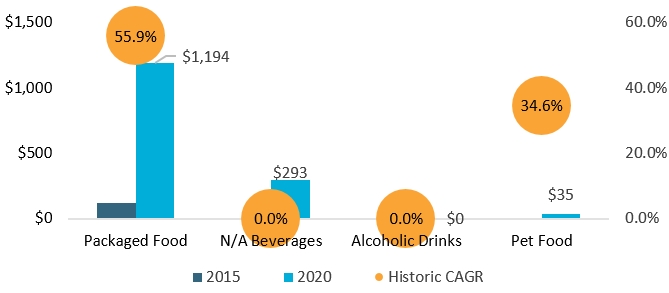
E-commerce size and growth
Description of above image
| Market | 2015 | 2020 | Historic CAGR* |
|---|---|---|---|
| Packaged Food | $124 | $1,194 | 55.9% |
| Non-Alcoholic Beverages | $0 | $293 | |
| Alcoholic Drinks | $0 | $0 | |
| Pet Food | $8 | $35 | 34.6% |
| *CAGR: Compound Annual Growth Rate | |||
Source: Euromonitor International
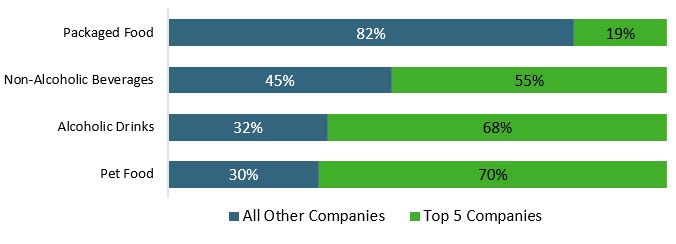
Competitive environment
Description of above image
| Category | All Other Companies | Top 5 Companies |
|---|---|---|
| Packaged Food | 82% | 19% |
| Non-Alcoholic Beverages | 45% | 55% |
| Alcoholic Drinks | 32% | 68% |
| Pet Food | 30% | 70% |
Source: Euromonitor International
Key e-commerce websites
| Rank (SKUs[1] on Via) | Packaged Food | Non-Alcoholic Beverages | Alcoholic Drinks | Pet Food |
|---|---|---|---|---|
| 1 | Flipkart (12.3 thousand SKUs) | Amazon (4.1 thousand) | Nature's Basket (140) | Miscota (10.6 thousand) |
| 2 | Amazon (7.3 thousand) | Flipkart (2.1 thousand) | Amazon (70) | Amazon (5.1 thousand) |
| 3 | Big Basket (5.6 thousand) | Big Basket (1.1 thousand) | Flipkart (44) | Flipkart (2.9 thousand) |
| 4 | Spar (2.0 thousand) | LuLu (0.2 thousand) | Big Basket (14) | Big Basket (0.3 thousand) |
| 5 | Nature's Basket (1.3 thousand) | Spar (0.2 thousand) | LuLu (11) | Grofers (0.1 thousand) |
| 1: SKU data comes from Euromonitor International's proprietary Via data extraction tool, and was extracted in March 2021 | ||||
Key highlights for Canadian producers
Packaged food
Amazon with Amazon Pantry and Flipkart with Flipkart Supermart launched online grocery businesses in India and encouraged millennials and affluent consumers to move from shopping in physical stores to online.
Non-alcoholic beverages
Bottled water and juice are expected to be the best-performing categories over the forecast period and reach 53% of total non-alcoholic beverages sales in 2025.
Alcoholic drinks
E-commerce players such as Amazon, Swiggy, Zomato and Big Basket began delivering alcohol to consumers from stores for a fee, with this trend likely to continue into 2021 and beyond. Going forward, changes to regulations around the sale of alcoholic drinks via e-commerce could come to the fore with this channel's capacity and infrastructure being developed to serve consumers in India.
Pet food
In addition to leading pure play specialist Miscota, MyPetStation and other chains of pet shops such as Heads Up For Tails (HUFT) are taking an omnichannel approach to retailing in order to reach more consumers and provide greater convenience.