

Note: This report includes forecasting data that is based on baseline historical data.
Executive summary
In 2023, China's total population reached 1.41 billion people, which has been increasing at a compound annual growth rate (CAGR) of 0.4% during the period of 2013 to 2023. The country consists of a dispersed population having a median age of 40.2 years in 2023. The Silent Generation (ages 76 to 93) group only accounted for 3.3%, with all other age groups each falling between a share from 15% up to 23% of the total population. The middle youth (ages 30 to 39) falls predominantly in being within the top income band with a gross income higher than the average of US$10,682.6 in 2023. The singletons population and childless families are the fastest growing segments both globally and in China, expected to account for a total share of 56.5% in China by 2033.
In China, 65% of the population was living in urban areas with 35% living in rural areas in 2023. The most populous urban cities in China were Shanghai, Shenzhen, Beijing, Guangzhou, and Chengdu. The Chinese population living below the national poverty line (NPL) was at 14.3% over the year. Disparities in wealth and income distribution play a more prevalent role amongst the lowest income class (social class E) with income inequality remaining as an urgent issue in China (extremely high by global standards). The urban-rural divide remains a huge contributor, where urban dwellers typically earn more due to better employment prospects and access to key services.
In 2023, China ranked as having the lowest inflation rate in the Asia Pacific (APAC) region at as low as 0.235%. This was largely due to a drop in food and energy costs, a downturn in the property market, and strong policy backing for supply over demand. On the flip side, China's economic development faces a downturn in 2024, amid muted global demand, deflationary pressures, escalating trade conflicts, and a prolonged ailing property sector. Despite these challenges, China's economy remains resilient, and the country continues to be a significant player in the global economic landscape.
China had the 16th largest per capita consumer expenditure (PCE) in the APAC region at a total of US$4,705.8 in 2023. Per capita spending mainly consisted of expenditures on housing (23.8%), food and non-alcoholic beverages (21.2%), and transportation (9.8%), with the remaining 45.2% of expenditures being for other goods and services in 2023. Retail value sales of packaged food in China reached total sales of US$303.6 billion in 2023, representing a CAGR of 2.7% (2018 to 2023). Health and wellness (HW) products accounted for 13.4% of sales at US$40.8 billion. Over the year, fortified/functional (FF) products led the market by a share of 37.4%, followed by better for you (BFY) at 20.1%, health benefit at 13.4%, dietary and free from at 11.6%, natural (9.2%), and organic (8.2%) products.
Consumer landscape and lifestyles
Consumer lifestyles
Emerging from the prolonged pandemic, Chinese respondents are indicating that they have a more positive outlook compared to their global counterparts as China's economic situation continues to improve. Chinese workers expect to be happier in the future compared to their current state and are more positively hopeful about their personal wellbeing. Moreover, there exist high expectations of having both a healthier (55% of Chinese respondents versus 46% globally) and a financially better off future (32% of Chinese express a sense of financial security comfortable with their current situation); with 27% stating that they have sufficient funds readily accessible for unexpected emergencies. As a result, more consumers in China are indulging in branded goods, luxury items and want to have unique shopping experiences with a high willingness to use products and services that are tailored to them.Footnote 1
Demographic shifts are reshaping the consumer landscape in China in key areas such as increased urbanization, higher life expectancy and falling birth rates; along with changing consumer values as the ageing population is growing the fastest (aged 65+) and with a declining number of marriages, this is positioning Chinese consumers to more often live alone. The singletons population and childless families are the fastest growing segments both globally and in China. Generation X and Millennials (aged 25-56 years) are emerging as the dominant groups.Footnote 1
Consumers in China across all generations rely on technology, with 72% stating that they utilize technology to enhance their day-to-day lives. Chinese consumers (27%) said that they anticipate a further shift to move towards online platforms as a part of their everyday activities. As 5G services have rapidly expanded across China, smartphones and the availability of diverse apps are tools that have become an integral part of daily living.Footnote 1
Steady growth in consumer spending
In China, spending per capita mainly consisted of consumer expenditures such as housing (23.8%), food and non-alcoholic beverages (21.2%), transportation (9.8%), health goods and medical services (8.6%), with the remaining 36.6% of expenditures being for other goods and services in 2023. The growing middle class continues to drive spending growth, while inflation remains comparatively low at around 0.235% - set to rise again and return to higher pre-pandemic levels around the 2.0% range by 2026. Middle-aged Millennials are projected to be prevalent in the top-income band. Moreover, the higher end of the Generation Z (aged 9-24 years) group are becoming of age and having a growing influence on the consumer profile in China.Footnote 1
In 2023, China was the largest global importer (US$232.1 billion) compared to Canada (US$51.1 billion - 11th largest) for agri-food and seafood products from the world. With China having an agri-food trade deficit of approximately US$133.2 million (exports: US$98.9 billion) in 2023, the country is most highly dependent on oil seeds and oleaginous fruits and miscellaneous grains (Chapter 12 - imports of US$68.5 billion), meat and edible meat offal products (Chapter 02 - US$26.7 billion), cereals (Chapter 10 - US$20.5 billion), edible fruit and nuts, including peel of citrus fruit or melons (Chapter 08 - US$18.8 billion), and fish and crustaceans, including molluscs and other aquatic invertebrates (Chapter 03 - US$18.8 billion). Last year, according to Canada's statistics, the country exported a total of US$8.5 billion to China. Many of these being highly dependent commodities to China including oil seeds/oleaginous fruits/miscellaneous grains at exports of US$3.8 billion (mainly canola seeds, soya beans, plants and its parts, and other oil or oleaginous fruit seeds), cereals at US$1.5 billion (primarily non-durum wheat, barley and oats), fish and crustaceans and mulluscs at US$8.5 billion (mainly crustaceans, molluscs, frozen fish, aquatic invertebrates), meat and edible meat offal at US$416.7 million (primarily meat of swine, edible offal of animals like bovine, swine, sheep, goats, horses and similar), and edible fruit and nuts at US$29.0 million (mainly frozen fruit and nuts, fresh and dried apricots, cherries, peaches, nectarines, plums, sloes).Footnote 2
Key demographic indicators
In 2023, China's total population was 1.41 billion people, representing a CAGR of 0.4% (2013 to 2023). China's total population is expected to decrease between 2023 and 2033 with a CAGR of −0.2% to reach approximately 1.38 billion by 2033. China is the most populous country in the APAC, followed by populations in the region such as India, Indonesia, Pakistan, Bangladesh, Japan, and the Philippines.
In China, 65% of the population was living in urban areas with 35% living in rural areas in 2023. The urban population is expected to grow faster at a CAGR of 1.0% over the rural population that will decline by 2.8% (2023-2033). The most populous urban cities in China were Shanghai at 21.0 million people, followed by Shenzhen (19.1 million), Beijing (18.6 million), Guangzhou (17.3 million), and Chengdu (12.4 million) in 2023.
| Category | 2013 | 2018 | 2023 | CAGR* % 2013-2023 | 2024 | 2033 | CAGR* % 2023-2033 |
|---|---|---|---|---|---|---|---|
| Total - population ('000) | 1,359,220 | 1,400,110 | 1,411,750 | 0.4 | 1,409,670 | 1,383,297 | −0.2 |
| Urban population ('000) | 726,707 | 834,321 | 917,422 | 2.4 | 929,721 | 1,010,601 | 1.0 |
| Urban population | 53.5 | 59.6 | 65.0 | 2.0 | 66.0 | 73.1 | 1.2 |
| Rural population ('000) | 632,512 | 565,789 | 494,328 | −2.4 | 479,949 | 372,696 | −2.8 |
| Rural population | 46.5 | 40.4 | 35.0 | −2.8 | 34.0 | 26.9 | −2.6 |
| Population density (person per km2) | 144.8 | 149.1 | 150.4 | 0.4 | 150.2 | 147.3 | −0.2 |
|
Source: Euromonitor International, 2024 *CAGR: Compound Annual Growth Rate |
|||||||
| City | 2013 | 2018 | 2023 | CAGR* % 2013-2023 | 2024 | 2033 | CAGR* % 2023-2033 |
|---|---|---|---|---|---|---|---|
| Shanghai | 19,987.6 | 20,779.3 | 20,997.9 | 0.5 | 20,985.8 | 20,653.3 | −0.2 |
| Shenzhen | 11,490.4 | 15,034.9 | 19,068.5 | 5.2 | 19,728.6 | 22,849.8 | 1.8 |
| Beijing | 17,082.2 | 18,133.2 | 18,595.3 | 0.9 | 18,627.7 | 18,529.6 | 0.0 |
| Guangzhou | 11,733.8 | 14,480.1 | 17,293.9 | 4.0 | 17,726.6 | 19,653.2 | 1.3 |
| Chengdu | 8,133.8 | 10,242.0 | 12,392.3 | 4.3 | 12,725.3 | 14,227.3 | 1.4 |
| Dongguan | 8,692.4 | 9,832.4 | 10,825.8 | 2.2 | 10,962.1 | 11,473.0 | 0.6 |
| Tianjin | 9,634.6 | 10,073.4 | 10,210.6 | 0.6 | 10,208.2 | 10,063.5 | −0.1 |
| Hangzhou | 6,763.2 | 8,144.4 | 9,434.8 | 3.4 | 9,624.9 | 10,433.8 | 1.0 |
| Chongqing | 7,834.4 | 8,731.5 | 9,302.9 | 1.7 | 9,366.1 | 9,545.0 | 0.3 |
| Wuhan | 6,964.3 | 8,045.3 | 8,971.8 | 2.6 | 9,099.7 | 9,599.3 | 0.7 |
| Total - top 10 cities | 108,316.7 | 123,496.5 | 137,093.8 | 2.4 | 139,055.0 | 147,027.8 | 0.7 |
| % in top 10 urban cities | 14.9 | 14.8 | 14.9 | 0.03 | 15.0 | 14.5 | −0.3 |
|
Source: Euromonitor International, 2024 *CAGR: Compound Annual Growth Rate |
|||||||
In 2023, the Chinese population was quite dispersed amongst all age groups at the exception of the Silent Generation (ages 76-93) group only accounting for 3.3% of the total population. The largest cohorts moved from the Generation X (ages 41-56) group at 23.2%, followed by Millennials (ages 25-40) at 21.6%, Baby Boomers (ages 57-75) at 18.4%, the Generation Z (ages 9-24) group at 18.0%, and the Generation Alpha (ages under 11) group at 15.4%.
| Category | 2013 | 2018 | 2023 | CAGR* % 2013-2023 | 2024 | 2033 | CAGR* % 2023-2033 |
|---|---|---|---|---|---|---|---|
| Generation Alpha (2010~2024, ages under 11) | 70,189.7 | 157,996.1 | 217,802.0 | 12.0 | 226,902.1 | 226,247.7 | 0.4 |
| Generation Z (1997~2012, ages 9 to 24) | 254,071.8 | 253,555.8 | 253,570.2 | −0.02 | 253,327.4 | 252,355.7 | −0.05 |
| Millennials (1981~1996, ages 25 to 40) | 306,942.6 | 305,539.4 | 305,166.6 | −0.1 | 305,034.3 | 303,339.3 | −0.1 |
| Generation X (1965~1980, ages 41 to 56) | 335,350.6 | 331,868.4 | 328,125.1 | −0.2 | 327,016.0 | 311,794.0 | −0.5 |
| Boomers (1946~1964, ages 57 to 75) | 291,954.8 | 278,530.7 | 260,130.6 | −1.1 | 255,302.2 | 199,426.0 | −2.6 |
| Silent Generation (1928~1945, ages 76 to 93) | 97,299.1 | 70,615.9 | 46,536.7 | −7.1 | 42,087.8 | 11,352.0 | −13.2 |
| Total population | 1,359,220 | 1,400,110 | 1,411,750 | 0.4 | 1,409,670 | 1,383,297 | −0.2 |
|
Source: Euromonitor International from national statistics / UN, 2024 *CAGR: Compound Annual Growth Rate |
|||||||
In 2023, the male-to-female population in China was distributed with approximately 2% more males (719.7 million) than females (692.1 million). The median age for females was 41.8 and for males was 38.6 years. By 2033, the median age of the total population is expected to increase at a CAGR of 1.2% to reach an average of 45.3 years from 40.2 years in 2023, while the population is expected to decline at a CAGR of 0.2% between 2023 and 2033.
In China (2013 to 2023), later lifers (aged 65 to 79) grew the most at a CAGR of 5.0%, followed by seniors (aged 80+) by a rate of 3.4% with the amount of babies/infants (aged 0-2) having declined at a CAGR of 5.5% - along with other decreasing age groups between the ages of 13 and 44 years (teens to middle youth). Between 2023 and 2033, seniors (aged 80+) are expected to grow at the highest rate (CAGR: 5.8%) with all other age groups expected to register declines over the same period, at the exception of teens (+0.4%) and later lifers (+3.1%) age groups.
| Category | 2013 | 2018 | 2023 | CAGR* % 2013-2023 | 2024 | 2033 | CAGR* % 2023-2033 |
|---|---|---|---|---|---|---|---|
| Total - male population | 695,512.9 | 715,744.5 | 719,699.7 | 0.3 | 718,107.2 | 700,926.0 | −0.3 |
| Median age (yrs) - male | 35.6 | 36.5 | 38.6 | 0.8 | 39.0 | 43.8 | 1.3 |
| Total - female population | 663,707.1 | 684,365.5 | 692,050.3 | 0.4 | 691,562.8 | 682,370.6 | −0.1 |
| Median age (yrs) - female | 38.2 | 39.7 | 41.8 | 0.9 | 42.3 | 46.9 | 1.2 |
| Total - population | 1,359,220 | 1,400,110 | 1,411,750 | 0.4 | 1,409,670 | 1,383,297 | −0.2 |
| Median age of population (yrs) | 37.0 | 37.9 | 40.2 | 0.8 | 40.6 | 45.3 | 1.2 |
| Babies/Infants (aged 0-2) | 54,424.2 | 52,422.1 | 30,850.8 | −5.5 | 28,542.7 | 26,000.6 | −1.7 |
| Kids (aged 3-12) | 77,893.2 | 89,821.9 | 81,005.1 | 0.4 | 74,068.6 | 43,813.5 | −6.0 |
| Tweens (aged 8-12) | 79,733.0 | 77,830.1 | 90,139.3 | 1.2 | 90,802.9 | 48,855.8 | −5.9 |
| Teens (aged 13-17) | 92,623.5 | 79,637.5 | 78,064.2 | −1.7 | 80,288.7 | 81,130.5 | 0.4 |
| Young Adults (aged 18-29) | 252,227.6 | 238,859.2 | 211,174.2 | −1.8 | 206,526.8 | 197,334.5 | −0.7 |
| Middle Youth (aged 30-44) | 314,376.9 | 290,331.6 | 300,787.3 | −0.4 | 305,034.3 | 287,031.2 | −0.5 |
| Mid-Lifers (aged 45-64) | 357,636.1 | 405,903.1 | 412,608.4 | 1.4 | 412,556.1 | 403,504.6 | −0.2 |
| Later Lifers (aged 65-79) | 104,999.7 | 134,412.6 | 171,614.2 | 5.0 | 175,481.1 | 233,200.4 | 3.1 |
| Seniors (aged 80+) | 25,305.9 | 30,892.1 | 35,506.6 | 3.4 | 36,368.9 | 62,425.6 | 5.8 |
|
Source: Euromonitor International, 2024 *CAGR: Compound Annual Growth Rate |
|||||||
In China, the majority of the total population consists of 58.7% of married people (828.1 million), followed by 35.2% of single people (496.7 million), 4.8% of widowed people (67.8 million), and 1.4% of divorced individuals (19.1 million) in 2023. These statistics relate to marriage rates of 5.7 persons (per thousand in the population) and divorce rates of 2.0 persons (per thousand) over the year.
| Type | 2013 | 2018 | 2023 | CAGR* % 2013-2023 | 2028 | 2033 | CAGR* % 2013-2033 |
|---|---|---|---|---|---|---|---|
| Total - population('000) | 1,359,220 | 1,400,110 | 1,411,750 | 0.4 | 1,409,670 | 1,383,297 | −0.2 |
| Married ('000) | 790,937.1 | 819,890.5 | 828,130.1 | 0.5 | 821,861.3 | 811,920.2 | −0.2 |
| Divorced ('000) | 16,910.8 | 18,617.0 | 19,119.2 | 1.2 | 19,060.3 | 18,852.8 | −0.1 |
| Widowed ('000) | 64,048.7 | 66,982.3 | 67,822.1 | 0.6 | 67,353.6 | 66,551.0 | −0.2 |
| Single ('000) | 487,323.4 | 494,620.3 | 496,678.6 | 0.2 | 492,135.6 | 485,972.6 | −0.2 |
| Marriage rates (per '000 population) | 9.9 | 7.2 | 5.7 | −5.4 | 5.4 | 5.2 | −0.9 |
| Number of marriages ('000) | 13,469.3 | 10,139.4 | 8,055.7 | −5.0 | 7,577.7 | 7,261.8 | −1.0 |
| Divorce rates (per '000 population) | 2.6 | 3.2 | 2.0 | −2.6 | 1.8 | 1.7 | −1.6 |
| Number of divorces ('000) | 3,500.1 | 4,460.8 | 2,768.7 | −2.3 | 2,545.6 | 2,403.5 | −1.4 |
|
Source: Euromonitor International from national statistics / UN, 2024 *CAGR: Compound Annual Growth Rate |
|||||||
In 2023, the Chinese population by ethnicity or race mainly consisted of 91.7% (out of 99.6% of the reported population) of Han citizens, followed by Zhuang (1.3%), Hui (0.8%), Uyghur (0.8%), Manchu (0.7%), Miao (0.7%), and Yi (0.7%) - when reported by individual ethnicity/race. The majority of the Chinese population speak Mandarin (69.0%), followed by the Wu (6.5%), Cantonese (4.7%), Min (3.3%), and Xiang (3.3%) languages in 2023. A large portion of the population in China do not follow a religion (41.5%), while other reported religions followed in the country include syncretic (27.9%), Buddhism (16.6%), Christianity (7.7%), Islam (1.5%).
| Categorization type (individual breakdown) | 2023 |
|---|---|
| Han | 91.7 |
| Zhuang | 1.3 |
| Hui, Uyghur (0.8% each) | 1.6 |
| Manchu, Miao, Yi (0.7% each) | 2.1 |
| Tujia | 0.6 |
| Tibetan | 0.5 |
| Mongols | 0.4 |
| Bouyei, Dong, Yao | 0.6 |
| Bai, Dai, Hani Kazakhs, Korean, Li, Lisu, She (0.1% each) | 0.8 |
| Total population - China (% breakdown) | 99.6 |
| Source: Euromonitor International from national statistics/UN, 2024 | |
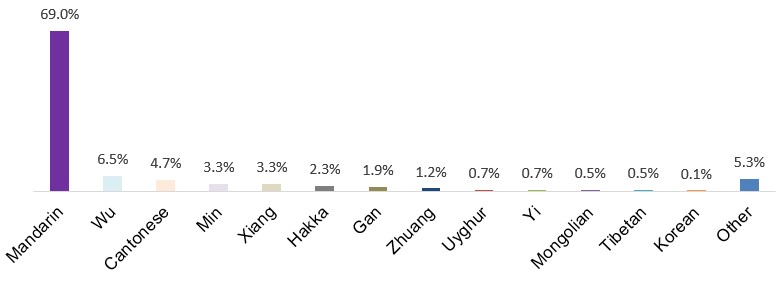
Description of above image
- Mandarin: 69.0%
- Wu: 6.5%
- Cantonese: 4.7%
- Min: 3.3%
- Xiang: 3.3%
- Hakka: 2.3%
- Gan: 1.9%
- Zhuang: 1.2%
- Uyghur: 0.7%
- Yi: 0.7%
- Mongolian: 0.5%
- Tibetan: 0.5%
- Korean: 0.1%
- Other: 5.3%
Total population in 2023: 1.41 billion people
Source: Euromonitor International from national statistics/UN, 2024
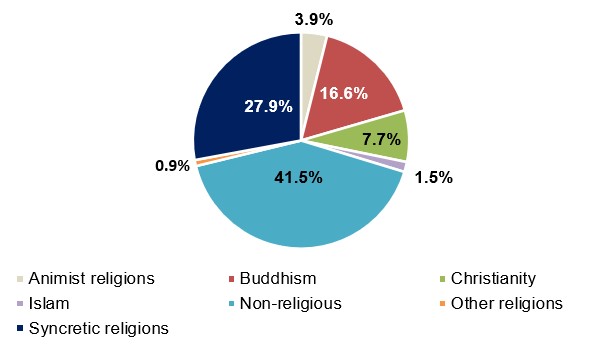
Description of above image
- Animist religions: 3.9%
- Buddhism: 16.6%
- Christianity: 7.7%
- Islam: 1.5%
- Non-religious: 41.5%
- Other religions: 0.9%
- Syncretic religions: 27.9%
Total population in 2023: 1.41 billion people
Source: Euromonitor International from national statistics/UN, 2024
China's vital/health statistics
In 2023, in China the life expectancy at birth is approximately 78 years of age with a healthy life expectancy being reported as 68.8 years. Over the year, 90.4% of females and 82% of males have survived beyond the age of 65. By 2033, life expectancy is forecast to increase by a CAGR of 0.2% to reach 80.4 years of age, with 92.3% of females and 85.8% of males expected to continue to survive beyond the age of 65.
The average age of a woman at their first childbirth in China has moved up to approximately 28 years in 2023, which has increased by a CAGR of 0.9% over the last decade and is expected to increase by a rate of 0.5% in the next ten years (2023 to 2033). The fertility rate was 1.1 born per female with around 9.0 million live births in the country in 2023, which is equivalent to a birth rate of 6.4 per thousand in the population of children born over the year. The Chinese fertility rate is forecast to decline by a CAGR of 1.4% from 2013 through to 2033, with birth rates decreasing gradually down to 6.2 births per thousand people, despite a slightly higher fertility rate of 1.2 born per female by 2033.
| Category | 2013 | 2018 | 2023 | 2028 | 2033 | CAGR* % 2013-2033 |
|---|---|---|---|---|---|---|
| Life expectancy at birth (years) | 76.5 | 77.7 | 78.0 | 79.4 | 80.4 | 0.2 |
| Healthy life expectancy at birth (years) | 68.0 | 68.9 | 68.8 | 70.0 | 70.8 | 0.2 |
| Survival to age 65: males (% of cohort) | 79.7 | 81.3 | 82.0 | 84.1 | 85.8 | 0.4 |
| Survival to age 65: females (% of cohort) | 88.6 | 90.0 | 90.4 | 91.6 | 92.3 | 0.2 |
| Average age of women at first childbirth (years) | 26.0 | 27.3 | 28.3 | 29.1 | 29.7 | 0.7 |
| Birth rates (per '000 population) | 13.0 | 10.9 | 6.4 | 6.1 | 6.2 | −3.6 |
| Live births ('000) | 17,763.0 | 15,234.0 | 9,014.4 | 8,596.6 | 8,498.3 | −3.6 |
| Fertility rates (children born per female) | 1.6 | 1.5 | 1.1 | 1.1 | 1.2 | −1.4 |
| Infant mortality rates (per '000 live births) | 9.5 | 6.1 | 4.5 | 4.5 | 3.8 | −4.5 |
| Infant deaths (number) | 173,823 | 93,678 | 40,176 | 37,918 | 32,026 | −8.1 |
| Death rates (per '000 population) | 7.1 | 7.1 | 7.9 | 8.2 | 9.2 | 1.3 |
| Deaths ('000) | 9,719.9 | 9,931.5 | 11,102.3 | 11,431.7 | 12,759.5 | 1.4 |
| Refugees and asylum seekers (number) | 301,419 | 322,341 | 1,044 | |||
| Natural change ('000) | 8,043.1 | 5,302.4 | −2,087.9 | −2,835.1 | −4,261.2 | |
| Rate of natural change (per '000 population) | 5.9 | 3.8 | −1.5 | −2.0 | −3.1 | |
|
Source: Euromonitor International from national statistics/UN/Eurostat/World Bank, 2024 *CAGR: Compound Annual Growth Rate |
||||||
| Category | 2013 | 2018 | 2023 | 2028 | 2033 |
|---|---|---|---|---|---|
| Breastfeeding of Infants (% of population) | 20.8 | 26.0 | 27.7 | ||
| Vegetarian population ('000) | 43,457.8 | 46,755.0 | 60,045.9 | ||
| Vegetarian (% of population) | 3.2 | 3.3 | 4.3 | ||
| Dental health (average number of DMFT[1] at age 12) | 0.8 | 0.9 | 1.0 | ||
| Diabetes prevalence (% of population aged 20-79) | 10.3 | 10.0 | 11.1 | 11.7 | 12.0 |
| High blood glucose prevalence (% aged 18+) | 9.1 | 10.9 | 11.8 | ||
| High blood pressure prevalence (% aged 18+) | 19.2 | 17.7 | 16.9 | ||
| Prevalence of insufficient physical activity among adults (% aged 18+) | 26.6 | 30.0 | 31.8 | ||
| Raised cholesterol prevalence (% aged 25+) | 35.9 | 37.3 | 38.0 | ||
| Mean BMI[2] (kg/m2) score | 23.5 | 24.1 | 24.7 | 25.3 | 25.9 |
| Obese population (BMI 30kg/m2 or more) (% aged 18+) | 4.9 | 6.6 | 8.6 | 10.5 | 12.3 |
| Overweight population (BMI 25-30kg/m2) (% aged 18+) | 25.1 | 28.5 | 31.2 | 32.6 | 33.3 |
| Incidence of AIDS or HIV (number) | 42,246 | 64,220 | 52,443 | ||
| Measles Incidence (number) | 26,883 | 3,940 | 621 | ||
|
Source: Euromonitor International from WHO/OECD 1: Decayed, missing and filled teeth index measure 2: Body Mass Index |
|||||
Household structure in China
In 2023, the total number of households in China was 553.1 million that were located within 65.5% urban and 34.5% rural areas throughout the country. The majority of Chinese people live in an apartment (346.8 million) accounting for a total share of 62.7%, followed by 37.2% of households living in a house (205.7 million), and 0.1% living in other types of households (655.3 thousand) in 2023. Amongst those Chinese population living in a house, 88.8% were home owners, whereby many owning their house without a mortgage (64%) - with 36% of home owners that are currently paying a mortgage. Meanwhile, 9.6% of households living in a dwelling were renters, leaving 1.6% of other forms of tenancy living under other unreported occupancy agreements.
| Type | 2013 | 2018 | 2023 | 2028 | 2033 | CAGR* % 2013-2033 |
|---|---|---|---|---|---|---|
| Total - number of households ('000) | 445,115.1 | 499,780.8 | 553,096.1 | 595,487.1 | 630,697.1 | 1.8 |
| Urban households ('000) | 242,189.3 | 301,184.2 | 362,225.8 | 416,036.6 | 462,909.5 | 3.3 |
| Urban households (%) | 54.4 | 60.3 | 65.5 | 69.9 | 73.4 | 1.5 |
| Rural households ('000) | 202,925.7 | 198,596.6 | 190,870.3 | 179,450.5 | 167,787.5 | −0.9 |
| Rural households (%) | 45.6 | 39.7 | 34.5 | 30.1 | 26.6 | −2.7 |
|
Source: Euromonitor International from national statistics / UN, 2024 *CAGR: Compound Annual Growth Rate |
||||||
| Type | 2013 | 2018 | 2023 | 2028 | 2033 | CAGR* % 2013-2033 |
|---|---|---|---|---|---|---|
| Total - households ('000) | 445,115.1 | 499,780.8 | 553,096.1 | 595,487.1 | 630,697.1 | 1.8 |
| Households in a house ('000) | 188,187.7 | 192,748.0 | 205,663.2 | 218,352.3 | 230,039.5 | 1.0 |
| Households in an apartment ('000) | 256,342.8 | 306,423.0 | 346,777.6 | 376,437.2 | 399,921.9 | 2.2 |
| Households - other ('000) | 584.5 | 609.8 | 655.3 | 697.6 | 735.6 | 1.2 |
| Total - home owners ('000) | 388,387.1 | 442,282.0 | 491,270.0 | 529,442.1 | 560,895.7 | 1.9 |
| Owner without mortgage ('000) | 259,173.8 | 286,921.1 | 314,216.5 | 336,234.9 | 354,944.5 | 1.6 |
| Owner with mortgage ('000) | 129,213.3 | 155,360.9 | 177,053.5 | 193,207.2 | 205,951.2 | 2.4 |
| Renters ('000) | 47,651.4 | 49,246.8 | 53,231.5 | 56,943.8 | 60,205.3 | 1.2 |
| Other - households by tenure ('000) | 9,076.5 | 8,252.0 | 8,594.7 | 9,101.3 | 9,596.1 | 0.3 |
| House price index (2010=100) | 111.9 | 185.0 | 220.8 | |||
|
Source: Euromonitor International from national statistics/UN, 2024 *CAGR: Compound Annual Growth Rate |
||||||
In China, the average household size was 2.6 persons in 2023. Over the year, couples with children were the largest type of household (171.3 million), followed by single person households (142.9 million), couples without children (116.0 million), other blended families (93.9 million), and single-parent family households (29.1 million).
Based on historic and forecast previsions (2013 to 2033), it is expected that the average household size will continue to decrease by a CAGR of 1.7%; declining to a size of 2.2 persons by 2033. The number of single person households will surpass that of couples with children by 2027, as well as couples without children are forecast to increase the most at CAGRs of 5.7% and 2.2%, respectively over the same 20-year period. Overall the number of single households and those without children are expected to account for a total share of 56.5% by 2033 (over households of couples with children at 25.2%); which will be the type of households expected to increase the most by respective CAGRs of 4.5% and 1.6% (2023 to 2033), to reach a combined total of 356.5 million households.
By 2033, the percent of the number of children per household is supposed to decline the most amongst households reaching four children, decreasing by a CAGR of 10.5% between 2023 and 2033 - whereby the total number of children per household is expected to follow the trend close behind to also, significantly decline, for households with one child up to three children. Moreover, households without children are forecast to represent 83.5% of the population in 2033, which will have increased from 74.7% (413.1 million) in 2023 to reach a total of 526.8 million households.
| Type | 2013 | 2018 | 2023 | 2028 | 2033 | CAGR* % 2013-2033 |
|---|---|---|---|---|---|---|
| Average household size (number) | 3.1 | 2.8 | 2.6 | 2.4 | 2.2 | −1.7 |
| Single person ('000) | 72,538.3 | 102,744.2 | 142,879.8 | 183,063.2 | 221,220.0 | 5.7 |
| Couple without children ('000) | 86,909.9 | 102,159.6 | 115,950.2 | 126,780.8 | 135,256.0 | 2.2 |
| Couple with children ('000) | 168,915.8 | 172,590.1 | 171,260.5 | 165,747.8 | 158,876.8 | −0.3 |
| Single-parent family ('000) | 23,765.8 | 27,553.2 | 29,142.5 | 29,121.4 | 28,365.9 | 0.9 |
| Other blended family ('000) | 92,985.3 | 94,733.7 | 93,863.1 | 90,773.9 | 86,978.3 | −0.3 |
| Total - households ('000) | 445,115.1 | 499,780.8 | 553,096.1 | 595,487.1 | 630,697.1 | 1.8 |
|
Source: Euromonitor International from national statistics / UN, 2024 *CAGR: Compound Annual Growth Rate |
||||||
| Type | 2013 | 2018 | 2023 | 2028 | 2033 | CAGR* % 2013-2033 |
|---|---|---|---|---|---|---|
| Average number of children per household | 0.7 | 0.6 | 0.5 | 0.4 | 0.3 | −4.1 |
| Households without children ('000) | 268,016.8 | 335,990.4 | 413,131.7 | 472,210.0 | 526,817.5 | 3.4 |
| Households without children (%) | 60.2 | 67.2 | 74.7 | 79.3 | 83.5 | 1.7 |
| Households with 1 child ('000) | 91,148.5 | 70,404.9 | 40,944.0 | 26,772.6 | 18,226.2 | −7.7 |
| Households with 1 child (%) | 20.5 | 14.1 | 7.4 | 4.5 | 2.9 | −9.3 |
| Households with 2 children ('000) | 56,102.2 | 62,381.6 | 67,857.8 | 70,524.4 | 67,114.5 | 0.9 |
| Households with 2 children (%) | 12.6 | 12.5 | 12.3 | 11.8 | 10.6 | −0.8 |
| Households with 3 children ('000) | 20,517.9 | 21,829.0 | 22,517.5 | 20,032.9 | 15,276.9 | −1.5 |
| Households with 3 children (%) | 4.6 | 4.4 | 4.1 | 3.4 | 2.4 | −3.2 |
| Households with 4 or more children ('000) | 9,329.7 | 9,174.9 | 8,645.2 | 5,947.3 | 3,262.0 | −5.1 |
| Households with 4 or more children (%) | 2.1 | 1.8 | 1.6 | 1.0 | 0.5 | −6.8 |
| Total - number of households ('000) | 445,115.1 | 499,780.8 | 553,096.1 | 595,487.1 | 630,697.1 | 1.8 |
|
Source: Euromonitor International from national statistics / UN, 2024 *CAGR: Compound Annual Growth Rate |
||||||
Business environment and economic indicators
The economy in China spiked from a real gross domestic product (GDP) growth of 2.2% in 2020 to 8.4% in 2021, then fluctuated back down to approximately 3.0% in 2022. In 2023, China's GDP grew by 5.2% reaching US$17.8 trillion - outpacing the Asia Pacific (APAC) average, driven by private spending and gross fixed capital formation. However, a slowdown to 4.8% is expected in 2024, due to factors such as a continued downturn in the real estate market and escalating trade conflicts (amongst other issues). Nonetheless, China's economy is predicted to expand at an average annual real rate of 4.0% over 2023 to 2028.Footnote 3
Alternatively, GDP per capita reached US$12,604.8 in 2023, which grew by a CAGR of 6.3% (2018 to 2023). Inflation growth (CAGR: −35.3%) in China has been improving over this same period to reach as low as 0.235% in 2023. Notably, China ranked lowest in the APAC region in terms of inflation in 2023. This was largely due to a drop in food and energy costs, a downturn in the property market, and policy backing for supply over demand. Initially dropping another 0.8% from a year earlier in January 2024, this marked the lowest rate of inflation observed in the past 15 years.Footnote 3 Albeit, the country's lower inflation rate will be short lived and by 2025 is expected to increase back up to 1.400% with continued growth, to stabilize to around 2.001% by 2033 (CAGR: +23.9%).
In 2023, China's government operated under a budget deficit, which amounted to 7.1% of total GDP - projected to expand to 7.2% in 2024. The most growth in government spending during 2023 was observed in economic services, making up 29.7% of total public expenditure. In 2024, China continues to aim at its expansionary fiscal strategy to stimulate its economy by focusing on enhancing market assurance, prioritizing the growth of strategic sectors (including technological innovation and advanced manufacturing) through fiscal and loan interest subsidies and the addition of tax benefits.Footnote 3
On the other end, China's budget deficit has been mostly impacted by a strong downturn in the property market and local governments being burdened with debt. Furthermore, global economic uncertainty remains elevated, posing risks to China's growth prospects with the main risk facing China's economy being a combination of stagnation in global economic activity and high inflation (stagflation) - driven by further disruption to global energy and food supply in the context of heightened geopolitical tensions. Ultimately, igniting a resurgence of global inflation, which will result in the likelihood of more persistent price increase pressures in the global economy.Footnote 3 Overall, China is projected to rank 30th out of 84 countries in Euromonitor International's Wealth Index in 2030.Footnote 4
| Category | 2013 | 2018 | 2023 | CAGR* % 2018-2023 | 2028 | 2033 |
|---|---|---|---|---|---|---|
| GDP[1] in US$ billions | 8,370.5 | 12,976.9 | 17,794.8 | 6.5 | 22,936.1 | 29,784.8 |
| GDP per capita (US dollar) | 6,158.3 | 9,268.5 | 12,604.8 | 6.3 | 16,377.1 | 21,530.5 |
| GDP measured at purchasing power parity per capita (international dollar million) | 11,975.5 | 15,453.2 | 23,328.9 | 8.6 | 32,267.6 | 42,543.8 |
| Real GDP (% growth) | 7.766 | 6.750 | 5.250 | −4.9 | 3.500 | 3.300 |
| GDP deflator (2010 = 100) | 113.3 | 125.3 | 134.9 | 1.5 | 142.4 | 157.2 |
| Inflation (% growth) | 2.621 | 2.075 | 0.235 | −35.3 | 2.000 | 2.001 |
| Gross value added from production from agriculture, hunting, forestry and fishing (US$ billion) | 801.2 | 953.7 | 1,359.0 | 7.3 | ||
| Net exports of goods and services (US$M) | 205,434.8 | 99,576.5 | 676,716.6 | 46.7 | ||
| Exports ($ billions) | 2,059.1 | 2,480.2 | 3,763.7 | 8.7 | ||
| Imports ($ billions) | 1,853.6 | 2,380.6 | 3,087.0 | 5.3 | ||
|
Source: Euromonitor International, 2024 *CAGR: Compound Annual Growth Rate 1: Gross Domestic Product |
||||||
In 2023, the employment rate (age 15 to 64) in China was equivalent to 70.4% - a drop of 2.9 percentage points since 2018. The employed population consisted of men at an employment rate of 72.7%, with working females at a rate of 67.9% and working youth (age 15 to 24) at a rate of 41.4% in 2023. Between 2018 and 2023, the unemployment rate in China has been increasing by a CAGR of 7.7%, increasing to an unemployment rate of 5.300% in 2023 from 3.652% in 2018. Even though the unemployment rate is forecast to stabilize over the next decade to slightly decline to 5.100% by 2033 (CAGR: −0.4%), disparities in wealth and income distribution may play a more prevalent role amongst the lowest income class (social class E). Some individuals may struggle to find stable employment or may be employed in low-wage jobs, and with rising automation in the country, this will end up reducing employment opportunities for unskilled labour in China.Footnote 4
The disposable income per capita in China is higher amongst males at US$9,412.1 over females at US$6,061.3 in 2023. Meanwhile, the population living below the national poverty line (NPL) has lowered by CAGR of −3.6% (2018 to 2023), to account for 14.3% of the Chinese population over the year. Income inequality remains an urgent issue in China and is estimated to increase over the long term and remain extremely high by global standards. The urban-rural divide remains a huge contributor to income disparities, where urban dwellers typically earn more due to better employment prospects and access to services such as education and healthcare.Footnote 4
| Category | 2013 | 2018 | 2023 | CAGR* % 2018-2023 | 2028 | 2033 |
|---|---|---|---|---|---|---|
| Labour force participation rate (% age 15-64) | 77.4 | 76.2 | 74.6 | −0.4 | ||
| Employment rate (% age 15-64) | 75.1 | 73.3 | 70.4 | −0.8 | ||
| Economically active population ('000) | 793,000.0 | 786,530.0 | 770,991.9 | −0.4 | 752,714.0 | 739,326.5 |
| Male active population ('000) | 439,967.5 | 438,375.3 | 423,259.0 | −0.7 | 413,224.8 | 405,875.4 |
| Female active population ('000) | 353,032.5 | 348,154.7 | 347,732.8 | 0.0 | 339,489.1 | 333,451.1 |
| Employed population ('000) | 769,626.3 | 757,802.0 | 730,129.3 | −0.7 | 715,078.3 | 701,620.9 |
| Male employment rate (% age 15-64) | 80.9 | 78.7 | 72.7 | −1.6 | ||
| Female employment rate (% age 15-64) | 69.0 | 67.5 | 67.9 | 0.1 | ||
| Youth employment rate (% age 15-24) | 46.2 | 39.0 | 41.4 | 1.2 | ||
| Unemployed population ('000) | 23,373.7 | 28,728.0 | 40,862.6 | 7.3 | 37,635.7 | 37,705.7 |
| Unemployment rate (% economically active) | 2.948 | 3.652 | 5.300 | 7.7 | 5.000 | 5.100 |
| Male unemployment rate (%) | 3.242 | 3.960 | 5.724 | 7.6 | 5.255 | 5.332 |
| Female unemployment rate (%) | 2.580 | 3.266 | 4.784 | 7.9 | 4.690 | 4.818 |
| Youth unemployment rate (% aged 15-24) | 5.553 | 9.361 | 15.567 | 10.7 | ||
| Disposable income per capita (US$) | 3,549.3 | 5,477.7 | 7,769.5 | 7.2 | 10,659.9 | 14,528.0 |
| Male disposable income per capita | 4,306.3 | 6,727.3 | 9,412.1 | 6.9 | 12,841.6 | 17,490.6 |
| Female disposable income per capita | 2,756.0 | 4,170.9 | 6,061.3 | 7.8 | 8,406.1 | 11,485.0 |
| Population living below *NPL (%) | 19.4 | 17.2 | 14.3 | −3.6 | ||
|
Source: Euromonitor International, 2024 *NPL: National Poverty Line*CAGR: Compound Annual Growth Rate |
||||||
Measured by education level of head of households in China, 65.4% holds a secondary education level and 11.7% of head of households possess a higher education level in 2023. Meanwhile, 22.9% of head of households have either no or up to primary level of education. In 2023, the number of households measured by economic status of head of households consist of 41.4% of employees (228.9 million), 26.4% of employers and/or self-employed (146.2 million), 29.3% of other employment status (162.3 million), and 2.8% of unemployed workers (15.7 million).
| Category | 2013 | 2018 | 2023 | 2028 | 2033 | CAGR* % 2013-2033 |
|---|---|---|---|---|---|---|
| Number of households | 445,115.1 | 499,780.8 | 553,096.1 | 595,487.1 | 630,697.1 | 1.8 |
| Households by education of head of household [primary and no education] | 130,784.2 | 130,014.6 | 126,828.7 | 120,216.1 | 116,816.5 | −0.6 |
| Households by education of head of household [secondary] | 274,781.1 | 318,269.6 | 361,558.7 | 398,288.1 | 427,638.4 | 2.2 |
| Households by education of head of household [higher] | 39,549.8 | 51,496.6 | 64,708.7 | 76,982.8 | 86,242.2 | 4.0 |
| Head of household - employee | 152,792.5 | 203,287.8 | 228,905.1 | 242,665.4 | 252,177.1 | 2.5 |
| Head of household - employer and self-employed | 173,665.8 | 151,606.1 | 146,187.3 | 150,828.3 | 156,506.2 | −0.5 |
| Head of household - unemployed | 7,068.3 | 10,098.5 | 15,727.0 | 12,920.4 | 13,969.6 | 3.5 |
| Head of household - other | 111,588.5 | 134,788.5 | 162,276.8 | 189,072.9 | 208,044.1 | 3.2 |
|
Source: Euromonitor International, 2024 *CAGR: Compound Annual Growth Rate |
||||||
The average gross income of the population from age 15+ within China was US$10,682.6 growing at a CAGR of 6.9% (2013-2033), which is equivalent to the Chinese yuan renminbi of CNY$75,675.8 in 2023. The largest average gross income peaks at the population aged between 30 and 34 years (middle youth) at a value of US$13,125.8 with its lowest average being between 15-19 years (US$4,381.7) and ages 65+ (US$8,352.4) in 2023.
China held sixth position among 22 APAC nations in terms of average gross income, over the year. The country recorded a notable growth regarding per capita disposable income levels, which increased by 5.9% in real terms in 2023, compared to 0.8% growth in 2022. The surge in consumer income was primarily driven by an expanding economy, a decrease in unemployment rates and an increase in labour productivity (equivalent to US$24,372 in real terms compared to APAC's average of US$18,566). Over the year, income growth for rural residents outpaced those of city dwellers, with real per capita disposable income in rural areas growing by 7.6%. Employment is an important policy issue for the country's government, aiming to create over 12 million jobs in urban areas in 2024.Footnote 4
| Type of statistic | 2013 | 2018 | 2023 | 2028 | 2033 | CAGR* % 2013-2033 |
|---|---|---|---|---|---|---|
| Average gross income (15+ yrs) - US$ | 4,889.5 | 7,741.5 | 10,682.6 | 14,194.9 | 18,705.9 | 6.9 |
| Average gross income (15+ yrs) - CNY[1] | 34,636.9 | 54,840.4 | 75,675.8 | 100,556.7 | 132,512.8 | 6.9 |
| Population aged 15-19 (US$) | 1,975.8 | 3,139.1 | 4,381.7 | 5,930.5 | 7,962.8 | 7.2 |
| Population aged 20-24 (US$) | 4,751.5 | 7,614.1 | 10,663.6 | 14,426.1 | 19,364.5 | 7.3 |
| Population aged 25-29 (US$) | 5,722.1 | 9,029.5 | 12,519.8 | 16,896.3 | 22,645.6 | 7.1 |
| Population aged 30-34 (US$) | 6,003.8 | 9,474.3 | 13,125.8 | 17,679.7 | 23,666.2 | 7.1 |
| Population aged 35-39 (US$) | 5,854.5 | 9,251.4 | 12,816.4 | 17,249.6 | 23,079.0 | 7.1 |
| Population aged 40-44 (US$) | 5,563.8 | 8,769.6 | 12,136.2 | 16,338.1 | 21,862.8 | 7.1 |
| Population aged 45-49 (US$) | 5,328.9 | 8,407.5 | 11,646.7 | 15,688.1 | 21,000.7 | 7.1 |
| Population aged 50-54 (US$) | 5,215.4 | 8,228.3 | 11,398.0 | 15,352.7 | 20,551.6 | 7.1 |
| Population aged 55-59 (US$) | 5,051.5 | 7,939.4 | 10,970.5 | 14,764.0 | 19,752.4 | 7.1 |
| Population aged 60-64 (US$) | 4,695.9 | 7,404.0 | 10,247.6 | 13,785.8 | 18,439.0 | 7.1 |
| Population aged 65+ (US$) | 3,762.4 | 5,993.1 | 8,352.4 | 11,292.2 | 15,152.0 | 7.2 |
|
Source: Euromonitor International, 2024 *CAGR:Compound Annual Growth Rate 1: Chinese yuan renminbi |
||||||
Out of a population cohort in China of 1.18 billion in 2023, the highest number of workers (33.0%) made an average gross income within social class E (<50%: <US$5,341.3) and 29.9% within social class D (50-100%), followed by 17.2% between middle social class C (100-150%: US$10,682.6-$16,023.9), 10.9% at social class A (>200%: >US$21,365.2), and 9.0% at social class B (150-200%). Social class E is set to grow the most expanding from a CAGR of 0.4% (2018 to 2023) to a CAGR of 0.6% (2023 to 2028) to reach 415.5 million people by 2033 - over the other social classes, which are set to all decrease over the same forecast period. Projections for 2023 to 2028 indicate a median disposable income per household CAGR increase of 4.7%, which is a decrease from an historical growth at a CAGR of 5.3% between 2018 and 2023.
| Type of statistic | 2013 | 2018 | 2023 | 2028 | 2033 | CAGR* % 2013-2033 |
|---|---|---|---|---|---|---|
| Average gross income (15+ yrs) - US$ | 4,889.5 | 7,741.5 | 10,682.6 | 14,194.9 | 18,705.9 | 6.9 |
| Total - population in cohort by social class ('000) | 1,112,746 | 1,148,891 | 1,178,348 | 1,208,368 | 1,236,135 | 0.5 |
| Social class A (gross income >200% of average gross income) | 124,918.5 | 126,194.1 | 128,437.4 | 130,363.8 | 130,253.0 | 0.2 |
| Social class B (between 150-200%) | 99,096.9 | 103,210.5 | 105,787.6 | 107,520.7 | 108,193.8 | 0.4 |
| Social class C (between 100-150%) | 186,425.5 | 196,590.3 | 202,587.4 | 206,881.0 | 210,080.9 | 0.6 |
| Social class D (between 50-100%) | 322,169.8 | 340,707.1 | 352,565.0 | 361,992.9 | 372,090.5 | 0.7 |
| Social class E (gross income <50% of average gross income) | 380,135.0 | 382,188.8 | 388,970.1 | 401,609.3 | 415,516.5 | 0.4 |
| Total - population ('000) | 1,359,220 | 1,400,110 | 1,411,750 | 1,400,411 | 1,383,297 | 0.1 |
| Middle class households ('000) | 100,210.4 | 108,494.7 | 119,173.9 | 127,844.5 | 135,089.4 | 1.5 |
| Middle class households (% of total) | 22.5 | 21.7 | 21.5 | 21.5 | 21.4 | −0.3 |
| Median disposable income per household (US$) | 7,586.3 | 10,986.2 | 14,218.4 | 17,896.2 | 22,687.2 | 5.6 |
|
Source: Euromonitor International, 2024 *CAGR: Compound Annual Growth Rate |
||||||
Food and beverage expenditures and consumer preferences
Retail value sales of packaged food in China reached total sales of US$303.6 billion in 2023, representing a CAGR of 2.7% (2018 to 2023) and a forecast growth at a CAGR of 1.7% (2023 to 2028) to reach US$330.1 billion by 2028. Most likely due to high prices in food products, total packaged food sales decreased by 2.4% from US$311.0 billion in 2022. This decrease was mainly due to consumers cutting back on dairy products and alternatives, declining to sales of US$81.3 billion in 2023, equivalent to a CAGR of −0.2% (2018 to 2023). In 2023, Chinese consumers have spent the most on staple foods at sales of US$105.6 billion (5-yr CAGR: 4.8%), followed by snacks (after dairy and alternatives) at US$65.7 billion (+2.3%), and cooking ingredients and meals at US$51.0 billion (+3.9%).
In 2023, per capita expenditure by main packaged food categories included staple foods at an expenditure of US$80.4 PCE, dairy products and alternatives (US$57.6 PCE), snacks (US$46.5 PCE), and cooking ingredients and meals (US$38.9 PCE) in 2023. Over the year, the top 10 products that Chinese consumers particularly spent the most on in terms of retail sales value were drinking milk products, noodles, milk formula, yoghurt and sour milk products, cakes, processed meat, rice, pastries, tofu and derivatives and meat snacks. In terms of beverages, Chinese consumers spent approximately US$72.0 PCE on non-alcohol hot/soft drinks (Top 5 beverages: bottled water, ready-to-drink teas, hot tea, carbonates, juice); and US$133.8 PCE on alcoholic drinks in 2023.
| Category | 2018 | 2023 | CAGR* % 2018-2023 | 2024 | 2028 | CAGR* % 2023-2028 |
|---|---|---|---|---|---|---|
| Total - retail packaged food (off-trade) | 193.7 | 223.4 | 2.9 | 227.2 | 256.9 | 2.8 |
| Cooking ingredients and meals | 31.2 | 38.9 | 4.5 | 40.8 | 49.4 | 4.9 |
| Edible oils | 10.3 | 11.0 | 1.3 | 11.4 | 12.9 | 3.2 |
| Meals and soups | 6.9 | 10.4 | 8.6 | 11.2 | 14.6 | 7.0 |
| Sauces, dips and condiments | 13.1 | 16.5 | 4.7 | 17.3 | 20.8 | 4.7 |
| Sweet spreads | 0.9 | 1.0 | 2.1 | 1.0 | 1.1 | 1.9 |
| Dairy products and alternatives | 58.5 | 57.6 | −0.3 | 55.0 | 53.7 | −1.4 |
| Baby food | 18.1 | 17.2 | −1.0 | 16.1 | 14.4 | −3.5 |
| Dairy | 36.2 | 36.8 | 0.3 | 35.3 | 35.6 | −0.7 |
| Plant-based dairy | 4.3 | 3.6 | −3.5 | 3.5 | 3.7 | 0.5 |
| Staple foods | 62.2 | 80.4 | 5.3 | 84.7 | 102.0 | 4.9 |
| Baked goods | 21.6 | 25.9 | 3.7 | 27.7 | 34.9 | 6.1 |
| Breakfast cereals | 0.8 | 1.0 | 4.6 | 1.0 | 1.2 | 3.7 |
| Processed fruit and vegetables | 1.1 | 1.6 | 7.8 | 1.7 | 2.0 | 4.6 |
| Processed meat, seafood and alternatives to meat | 16.1 | 21.2 | 5.7 | 22.3 | 26.4 | 4.5 |
| Rice, pasta and noodles | 22.5 | 30.7 | 6.4 | 32.0 | 37.4 | 4.0 |
| Snacks | 41.8 | 46.5 | 2.2 | 46.7 | 51.8 | 2.2 |
| Confectionery | 9.7 | 8.9 | −1.7 | 9.2 | 10.4 | 3.2 |
| Ice cream | 4.4 | 5.1 | 3.0 | 4.8 | 5.2 | 0.4 |
| Savoury snacks | 22.0 | 26.7 | 3.9 | 26.8 | 29.7 | 2.2 |
| Sweet biscuits, snack bars and fruit snacks | 5.7 | 5.9 | 0.7 | 6.0 | 6.6 | 2.3 |
| Total - retail non-alcohol drinks (off-trade) | 59.6 | 72.0 | 3.9 | 75.9 | 89.0 | 4.3 |
| Hot drinks | 13.7 | 16.3 | 3.5 | 17.0 | 19.0 | 3.1 |
| Soft drinks | 45.9 | 55.7 | 3.9 | 58.9 | 70.0 | 4.7 |
| Alcoholic drinks | 112.4 | 133.8 | 3.5 | 139.6 | 164.4 | 4.2 |
|
Source: Euromonitor International from trade sources/national statistics, 2024 *CAGR: Compound Annual Growth Rate |
||||||
Within the APAC region, the total average consumer expenditure per capita (PCE) was equivalent to US$3,567.1 in 2023. China was the largest country within the APAC region in terms of total consumer expenditure, spending a total of approximately US$15.7 trillion on all goods and services - equivalent to being the 16th largest consumer market in the region at a PCE of US$4,705.8. The most well off areas when measured by per capita expenditure being Macau (China) at as high as (US$56,803.4 PCE), followed by Guam, Hong Kong (China), Singapore, New Caledonia, Japan, South Korea, French Polynesia, Taiwan, and the Maldives (all PCEs: >US$12,450) in 2023. Overall, China was also the largest APAC region spending around US$1.4 trillion on food and non-alcoholic beverages alone, in 2023. In terms of per capita expenditure on food and non-alcoholic drinks, China was the 11th largest market over the year.
China's, per capita spending on common consumer expenditures mainly consisted of housing at US$1,120.4 (23.8%), food (20.6%) and non-alcoholic beverages (0.7%) at US$998.9, transportation at US$459.9 (9.8%), health goods and medical services at US$405.5 (8.6%); with the remaining expenditures on other goods and services (36.6%) totalling US$1,721.1 in 2023. Consumer expenditure categories that have grown the most over the historic period (2018 to 2023) were expenses on tobacco (+8.8%), non-alcoholic beverages (+7.9%), and food (+7.6%).
As a result of price increases, Chinese consumers are expected to spend less on goods and services, where they can cut back on the most such as food, non-alcoholic and alcoholic drinks, tobacco, and hotels and caterings. Meanwhile, consumers are forecast to continue to spend more on non-essential items with expected growth in categories such as clothing and footwear, household goods, and leisure and recreation expenditures. Meanwhile, consumer expenditure is forecast to continue to increase on those more essential goods and services (where consumers have little control over having to spend more on) in areas such as higher costs in transportation, housing and household services, communications, and education.
| Consumer expenditure | 2018 | 2023 | CAGR* % 2018-2023 | 2024 | 2028 | CAGR* % 2023-2028 |
|---|---|---|---|---|---|---|
| Total - consumer expenditure of all goods | 3,547.3 | 4,705.8 | 5.8 | 4,975.8 | 6,365.0 | 6.2 |
| Total - food and non-alcoholic beverages | 693.0 | 998.9 | 7.6 | 1,067.8 | 1,269.4 | 4.9 |
| Food | 672.0 | 968.2 | 7.6 | 1,035.0 | 1,230.5 | 4.9 |
| Non-Alcoholic Beverages | 20.9 | 30.6 | 7.9 | 32.8 | 38.9 | 4.9 |
| Alcoholic drinks | 41.6 | 59.7 | 7.5 | 64.4 | 77.6 | 5.4 |
| Tobacco | 58.4 | 89.1 | 8.8 | 95.1 | 118.4 | 5.9 |
| Clothing and footwear | 230.3 | 256.4 | 2.2 | 267.1 | 331.2 | 5.3 |
| Housing | 830.2 | 1,120.4 | 6.2 | 1,188.0 | 1,571.2 | 7.0 |
| Household goods and services | 176.9 | 214.8 | 4.0 | 226.2 | 285.8 | 5.9 |
| Health goods and medical services | 301.1 | 405.5 | 6.1 | 427.7 | 566.9 | 6.9 |
| Transportation | 352.3 | 459.9 | 5.5 | 485.4 | 647.5 | 7.1 |
| Communications | 125.8 | 153.3 | 4.0 | 161.4 | 211.4 | 6.6 |
| Leisure and recreation | 197.8 | 238.4 | 3.8 | 246.1 | 320.8 | 6.1 |
| Education | 199.9 | 245.3 | 4.2 | 255.4 | 330.2 | 6.1 |
| Hotels and catering | 213.1 | 294.5 | 6.7 | 311.6 | 403.3 | 6.5 |
| Miscellaneous goods and services | 126.9 | 169.6 | 6.0 | 179.6 | 231.2 | 6.4 |
|
Source: Euromonitor International from national statistics/Eurostat/UN/OECD, 2024 *CAGR: Compound Annual Growth Rate |
||||||
Health and wellness
Health and wellness (HW) continues to gain traction among Chinese consumers to alleviate concerns around mental health and physical fitness. Euromonitor's survey in 2023, indicated that consumers in China are active runners (highest amongst Millennials, aged 25 to 40) - where a total of 84% say that they run either almost every day (19%), 1 to 2 times a week (49%) or 1-2 times a month (16%); with another 16% indicating that they run less than once a month (14%) or never (2%). Other exercise habits frequented most often by Chinese consumers almost every day include yoga (30%) and cycling/biking (37%) - highest amongst Gen X consumers (aged 41 to 56); while other HW activities frequented most often at least 1-2 times per week include walking and/or hiking (46%). Furthermore, sleeping aids are popular in China. Chinese respondents said that the most common stress-reduction or mental well-being activities that they participated in within the last six months were massages (~56%), sleep aids (44%), yoga (42%), spa visit (40%), meditation (35%), therapy or counselling (32%), and herbal remedies (31%) - seems to be most commonly practiced by Millennials, followed by the Gen X age group and closely behind by Gen Z (aged 9 to 24), then by Baby Boomers (aged 57 to 75).
Moreover, 42% of Chinese consumers said they look for health ingredients in food and beverages, where 58% feel they can make a difference to the world through their sustainable choices and actions, and 63% say that they buy from brands that they trust completely. At the same time, Chinese when compared to global consumers, really enjoy eating out at a restaurant (71% vs. 33%) or ordering ready-made food for takeaway/pick-up (64% vs. 38%) or for home delivery (69% vs. 33%) at least weekly. Approximately, 26% of Chinese consumers say that restaurants serve more delicious food than home-cooked meals, while it being a more convenient option (25%) - younger generations prefer to order food for delivery the most. Almost the same share of Chinese cook or bake (at least weekly) when compared to their global counterparts (73% vs. 71%), while once again, more Chinese tend to reheat or prepare a ready meal over global consumers (59% vs. 42%).Footnote 5
In China, total HW product sales reached approximately US$40.8 billion in 2023. Between 2019 and 2023, the HW sector grew by a CAGR of 2.7% and is forecast to grow by a CAGR of 5.8% between 2023 and 2028, to reach US$56.7 billion by 2028. In 2023, the largest HW category in China was for fortified/functional (FF) products by a market share of 37.4%, followed by better for you (BFY) at 20.1%, health benefit at 13.4%, dietary and free from at 11.6%, natural (9.2%), and organic (8.2%) products.
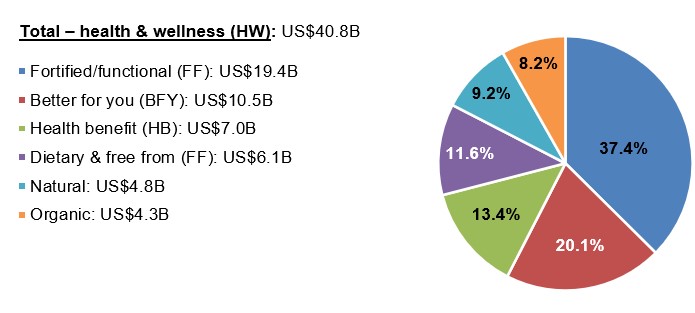
Description of above image
- Total – health and wellness (HW): US$40.8 billion
- Fortified/functional (FF): US$19.4 billion (37.4%)
- Better for you (BFY): US$10.5 billion (20.1%)
- Health benefit (HB): US$7.0 billion (13.4%)
- Dietary and free from (FF): US$6.1 billion (11.6%)
- Natural: US$4.8 billion (9.2%)
- Organic: US$4.3 billion (8.2%)
Source: Euromonitor International, 2024
Chinese consumer values and behaviour
56% of Chinese consumers say they enjoy spending their money rather than saving it and 26% feel that more of their everyday activities will shift to online platforms. Branded goods to non-branded, new and uniquely tailored products and services and in-person/engaging experiences are strongly important to them. Millennials are most likely to try a new product or service and are most optimistic about their future financial situation, while cinemas are most loved by them as well. Chinese consumers also, expect more in-person activities. While at home, consumers in China like to interact by connecting with friends or family virtually. A safe location and smart home functionality is what Chinese consumers are looking for the most in their homes.Footnote 5
Just over a third (36%) of Chinese consumers are looking for a good work-life balance the most - to a higher extent than their global counterpart (25%). Similarly, Chinese consumers do not feel as strongly when compared to global numbers regarding the importance of working close to home, working by themselves, setting their own work hours, nor being able to telework from home. Consumers in China primarily desire job security slightly over earning a high salary and to a lesser extent on factors such as working for a company that prioritizes employee health and safety, that is successful, offers good training or takes ethical and social responsibilities seriously, nor work that is challenging with a high responsibility level etc. Nevertheless, Chinese consumers expect a clear separation between their professional and personal life. Chinese love experiencing local culture, while travelling and baby boomers like ecotourism, nature and outdoor activities.Footnote 5
For more information
The Canadian Trade Commissioner Service:
International Trade Commissioners can provide Canadian industry with on-the-ground expertise regarding market potential, current conditions and local business contacts, and are an excellent point of contact for export advice.
More agri-food market intelligence:
International agri-food market intelligence
Discover global agriculture and food opportunities, the complete library of Global Analysis reports, market trends and forecasts, and information on Canada's free trade agreements.
Agri-food market intelligence service
Canadian agri-food and seafood businesses can take advantage of a customized service of reports and analysis, and join our email subscription service to have the latest reports delivered directly to their inbox.
More on Canada's agriculture and agri-food sectors:
Canada's agriculture sectors
Information on the agriculture industry by sector. Data on international markets. Initiatives to support awareness of the industry in Canada. How the department engages with the industry.
For additional information on the Food & Hospitality China in Shanghai contact:
Michelle Jardine, Deputy Director
Indo-Pacific Market Development and Promotion
Agriculture and agri-food Canada
michelle.jardine@agr.gc.ca
Resources
- Euromonitor International | 28 June 2023. Country report: China – Consumer Profile
- Euromonitor International | 6 June 2024. Country report: Consumer Values and Behaviour in China
- Euromonitor International | 20 May 2024. Country report: Economy, Finance and Trade – China
- Euromonitor International | 28 June 2024. Country report: Income and Expenditure – China
- Global Trade Tracker (GTT), 2024
Consumer Profile – China
Global Analysis Report
Prepared by: Erin-Ann Chauvin, Senior Market Analyst
© His Majesty the King in Right of Canada, represented by the Minister of Agriculture and Agri-Food (2025).
Photo credits
All photographs reproduced in this publication are used by permission of the rights holders.
All images, unless otherwise noted, are copyright His Majesty the King in Right of Canada.
To join our distribution list or to suggest additional report topics or markets, please contact:
Agriculture and Agri-Food Canada, Global Analysis1341 Baseline Rd, Tower 5, 3rd floor
Ottawa ON K1A 0C5
Canada
Email: aafc.mas-sam.aac@agr.gc.ca
The Government of Canada has prepared this report based on primary and secondary sources of information. Although every effort has been made to ensure that the information is accurate, Agriculture and Agri-Food Canada (AAFC) assumes no liability for any actions taken based on the information contained herein.
Reproduction or redistribution of this document, in whole or in part, must include acknowledgement of agriculture and agri-food Canada as the owner of the copyright in the document, through a reference citing AAFC, the title of the document and the year. Where the reproduction or redistribution includes data from this document, it must also include an acknowledgement of the specific data source(s), as noted in this document.
Agriculture and Agri-Food Canada provides this document and other report services to agriculture and food industry clients free of charge.