

Note: This report includes forecasting data that is based on baseline historical data.
Executive summary
Frozen baked goods in China remain marginal, but the market is growing at a rapid rate, as evidenced by the number of new product launches. For the time being, the market remains concentrated in China's largest, richest and most important cities. However, as the cold chain develops throughout the country, secondary cities are expected to become markets for frozen baked goods.
In general, packaged baked goods in China are growing at a steady rate, whether measured by value or by tonnage. Pastries and cakes are the most important categories by value, and they are also the fastest-growing categories by value. Bread volume is high, but cakes represent more value-added. In 2022, their retail volume was less than that of bread, but their retail value was nearly three times that of bread. Divergence in value is forecasted through 2027.
Domestic and international players are both present in the Chinese frozen baked goods market. One international player developing and marketing products in the Chinese market is Mondelez. Euromonitor has identified that their Oreo-brand small ice cream cakes are gaining in popularity due to their small, snack-sized portions.
In addition to supplying the domestic market, Chinese companies manufacture frozen baked goods for export. These goods can be found throughout Europe, Asia and the Americas.
Retail environment and trends
Frozen baked goods are sold in China. However, tracking sales data for frozen baked goods is difficult, and Euromonitor International does not separately measure frozen product sales in China. These appear to have a much smaller market share than other baked goods in China, and they may therefore be captured in the sales statistics for these products.
| Category | 2017 | 2022 | CAGR* % 2017-2022 | 2023 | 2027 | CAGR* % 2022-2027 |
|---|---|---|---|---|---|---|
| Baked Goods | 28,380.8 | 38,095.8 | 5.0 | 41,265.3 | 53,975.9 | 6.0 |
| Bread | 5,001.2 | 6,550.7 | 4.6 | 6,972.9 | 8,581.3 | 4.6 |
| Cakes | 12,091.9 | 16,227.0 | 5.0 | 17,827.5 | 24,508.4 | 7.1 |
| Dessert Mixes | 436.8 | 413.5 | −0.9 | 421.0 | 441.7 | 1.1 |
| Frozen Baked Goods | ||||||
| Pastries | 10,850.9 | 14,904.7 | 5.4 | 16,043.9 | 20,444.4 | 5.4 |
| Dessert Pies and Tarts | ||||||
|
Source: Euromonitor International Limited, 2023, all rights reserved *CAGR: Compound Annual Growth Rate |
||||||
Normally, frozen bakery products would all be included in Frozen baked goods, except for frozen cakes, tarts and pies, which are included in dessert pies and tarts. Neither category is calculated for China in Euromonitor Passport.
Overall, baked goods grew at 5% CAGR in China from 2017 to 2022, with growth being evenly distributed between bread, cakes and pastries. Cakes and pastries are the two leading categories, each representing about 40% of the total baked goods market. Dessert mixes, which represent a small sliver of the baked goods market, fell slightly, from US$436.8 million to US$413.5 million. This market segment is expected to recover through 2027, which means that over the 10 year period from 2017 to 2027, dessert mixes will essentially have stagnated.
Baked goods are forecasted to grow at 6% CAGR through 2027. Growth is forecasted to be distributed between the three market categories, but cakes will be the biggest drivers of growth, with 7.1% forecasted CAGR. As such, the gap between cakes and pastries will grow from less than US$2 million to over US$4 million.
| Category | 2017 | 2022 | CAGR* % 2017-2022 | 2023 | 2027 | CAGR* % 2022-2027 |
|---|---|---|---|---|---|---|
| Baked Goods | 9,313.4 | 10,242.6 | 1.9 | 10,601.6 | 11,705.4 | 2.7 |
| Bread | 2,244.5 | 2,341.1 | 0.8 | 2,416.3 | 2,665.9 | 2.6 |
| Cakes | 1,656.3 | 1,807.1 | 9.1 | 1,901.6 | 2,195.4 | 4.0 |
| Dessert Mixes | 49.9 | 45.1 | −9.6 | 45.2 | 41.8 | −1.5 |
| Frozen Baked Goods | ||||||
| Pastries | 5,362.7 | 6,049.3 | 12.8 | 6,238.5 | 6,802.2 | 2.4 |
| Dessert Pies and Tarts | ||||||
|
Source: Euromonitor International Limited, 2023, all rights reserved *CAGR: Compound Annual Growth Rate |
||||||
Volume sales of baked goods grew more slowly than value sales in China. This indicates that retail sales growth is driven by added value.
The Chinese baked goods market is characterized by low market concentration. In 2022, over 70% of packaged baked goods in China were produced by artisanal companies. A further 4.6% of products were manufactured for private labels. The largest baked goods company, the Fujian Dali Food Co, had a 3.9% market share. The next-largest company is the Shenyang Toly Bread Co, at 3.4%. No other company holds even a 2% market share.
| Company name | 2018 | 2019 | 2020 | 2021 | 2022 | CAGR* % 2018-2022 |
|---|---|---|---|---|---|---|
| Artisanal | 22,899.7 | 25,154.0 | 25,074.7 | 26,465.3 | 26,825.2 | 6.0 |
| Others | 2,758.7 | 2,778.2 | 3,053.9 | 3,484.2 | 3,754.2 | 10.2 |
| Private Label | 1,438.4 | 1,541.9 | 1,591.6 | 1,686.9 | 1,741.3 | 6.0 |
| Fujian Dali Food Co Ltd | 1,265.3 | 1,275.5 | 1,414.9 | 1,467.4 | 1,503.8 | 4.4 |
| Shenyang Toly Bread Co Ltd | 1,000.4 | 1,154.1 | 1,218.7 | 1,273.4 | 1,302.0 | 9.4 |
| Fujian Changting Panpan Foodstuff Co Ltd | 434.3 | 513.9 | 570.8 | 594.3 | 606.7 | 12.5 |
| Orion Group | 420.5 | 432.7 | 452.2 | 470.3 | 454.3 | 2.6 |
| Grupo Bimbo SAB de CV | 260.1 | 285.0 | 303.3 | 325.1 | 342.7 | 32.6 |
| Anhui Three Squirrels Electronic Commerce Co Ltd | 327.4 | 324.5 | 325.9 | 328.6 | ||
| Nestlé SA | 291.9 | 299.7 | 286.8 | 294.0 | 302.3 | 1.7 |
| Jie Yang Kong Weng Food Development Co Ltd | 244.3 | 271.8 | 287.3 | 300.8 | 297.7 | 8.1 |
| Hui Tou Ke Food Group Co Ltd | 151.2 | 162.0 | 164.5 | 170.6 | 172.1 | 3.5 |
| Nanfang Black Sesame Group Co Ltd | 144.7 | 155.9 | 132.5 | 146.0 | 158.6 | −1.1 |
| The Garden Co Ltd | 89.5 | 100.7 | 112.2 | 120.2 | 124.4 | 10.6 |
| Beijing Yi Li Co Ltd | 54.6 | 55.7 | 56.3 | 57.6 | 58.9 | 2.4 |
| Ting Hsin International Group | 37.8 | 39.5 | 38.7 | 40.4 | 41.8 | 3.5 |
| Guilin Zhiqiang Food Development Co Ltd | 39.9 | 41.1 | 38.5 | 39.1 | 39.2 | −0.3 |
| Four Seas Group | 28.4 | 28.9 | 27.3 | 28.2 | 28.8 | 1.1 |
| Lotte Group | 22.1 | 18.1 | 12.5 | 12.9 | 13.2 | −12.9 |
| Total | 31,587.7 | 34,636.2 | 35,161.3 | 37,302.6 | 38,095.8 | 6.5 |
|
Source: Euromonitor International Limited, 2023, all rights reserved *CAGR: Compound Annual Growth Rate |
||||||
The largest foreign company operating in the Chinese baked goods sector is the Korean Orion Group, which has a market share slightly above 1%. Market penetration by foreign companies remains low. Other notable foreign companies include Grupo Bimbo, Nestlé SA, and Lotte.
The leading baked goods brands in China are Daliyuan, a brand of packaged sweet pastry products, and Toly (or Taoli), which sells a variety of products.
| Brand (company) | 2018 | 2019 | 2020 | 2021 | 2022 | CAGR* % 2018-2022 |
|---|---|---|---|---|---|---|
| Artisanal | 22,899.7 | 25,154.0 | 25,074.7 | 26,465.3 | 26,825.2 | 5.5 |
| Others | 2,758.7 | 2,778.2 | 3,053.9 | 3,484.2 | 3,754.2 | 9.7 |
| Private label | 1,438.4 | 1,541.9 | 1,591.6 | 1,686.9 | 1,741.3 | 5.5 |
| Daliyuan (Fujian Dali Food Co Ltd) | 1,265.3 | 1,275.5 | 1,414.9 | 1,467.4 | 1,503.8 | 4.0 |
| Toly (Shenyang Toly Bread Co Ltd) | 1,000.4 | 1,154.1 | 1,218.7 | 1,273.4 | 1,302.0 | 9.0 |
| Panpan (Fujian Changting Panpan Foodstuff Co Ltd) | 434.3 | 513.9 | 570.8 | 594.3 | 606.7 | 12.0 |
| Orion (Orion Group) | 420.5 | 432.7 | 452.2 | 470.3 | 454.3 | 2.2 |
| Three Squirrels (Anhui Three Squirrels Electronic Commerce Co Ltd) | 327.4 | 324.5 | 325.9 | 328.6 | ||
| Hsu-Fu-Chi (Nestlé SA) | 291.9 | 299.7 | 286.8 | 294.0 | 302.3 | 1.3 |
| Kong Weng (Jie Yang Kong Weng Food Development Co Ltd) | 244.3 | 271.8 | 287.3 | 300.8 | 297.7 | 7.6 |
| Mankattan (Grupo Bimbo SAB de CV) | 170.8 | 192.3 | 209.0 | 226.7 | 242.2 | |
| Hui Tou Ke (Hui Tou Ke Food Group Co Ltd) | 151.2 | 162.0 | 164.5 | 170.6 | 172.1 | 3.0 |
| Nanfang (Nanfang Black Sesame Group Co Ltd) | 144.7 | 155.9 | 132.5 | 146.0 | 158.6 | −1.5 |
| Garden (The Garden Co Ltd) | 89.5 | 100.7 | 112.2 | 120.2 | 124.4 | 10.1 |
| Bimbo (Grupo Bimbo SAB de CV) | 89.3 | 92.7 | 94.3 | 98.4 | 100.5 | 3.3 |
| Total all brands | 31,587.7 | 34,636.2 | 35,161.3 | 37,302.6 | 38,095.8 | 6.1 |
|
Source: Euromonitor International Limited, 2023, all rights reserved *CAGR: Compound Annual Growth Rate |
||||||
Per capita expenditure on bakery products remains low. This is likely due to a large denominator, as much of China's population outside of major cities may not be purchasing packaged products with regularity. Sweet bakery products are the most popular category among consumers, followed by cookies and crackers. Packaged bread and bread product expenditures are very low.
| Category | 2018 | 2022 | CAGR* % 2018-2022 | 2023 | 2025 | CAGR* % 2022-2025 |
|---|---|---|---|---|---|---|
| Biscuits (cookies and crackers) | 6.189 | 8.524 | 6.6 | 8.939 | 10.466 | 5.3 |
| Sweet bakery | 9.538 | 11.692 | 4.1 | 12.125 | 13.255 | 3.2 |
| Bread and bread products | 1.271 | 1.611 | 4.9 | 1.679 | 1.813 | 3.0 |
|
Source: Mintel Market Sizes, 2023 *CAGR: Compound Annual Growth Note: forecast data is not available for sweet bakery or bread and bread products beyond 2025. Forecast data is the only kind available for these categories in 2022. Biscuits have available data in 2022. |
||||||
The retail value of bakery product sales in China is increasing across all categories. Growth was fastest for biscuits, and this is forecasted to hold through 2025.
| Category | 2018 | 2022 | CAGR* % 2018-2022 | 2023 | 2025 | CAGR* % 2022-2025 |
|---|---|---|---|---|---|---|
| Biscuits (cookies and crackers) | 8.572 | 11.95 | 6.9 | 12.55 | 14.715 | 4.1 |
| Sweet bakery | 13.21 | 16.392 | 4.4 | 17.023 | 18.637 | 3.3 |
| Bread and bread products | 1.76 | 2.258 | 5.1 | 2.357 | 2.549 | 3.1 |
|
Source: Mintel Market Sizes, 2023 *CAGR: Compound Annual Growth Note: forecast data is not available for sweet bakery or bread and bread products beyond 2025. Forecast data is the only kind available for these categories in 2022. Biscuits have available data in 2022.. |
||||||
Structural barriers and opportunities
Frozen baked goods are primarily sold in China's largest and most important cities. Nationwide, supply chain issues, particularly due to a lack of cold chain infrastructure, have limited the growth of frozen baked good sales. Delivery costs are high, and prices are high as a result. Nonetheless, the market is growing. International companies such as Mondelez have launched products such as ice cream cakes that are gaining popularityFootnote1. Local and international suppliers are investing in their cold chain infrastructure.
China manufactures frozen baked goods for export. Asian grocery stores in North America and Europe will typically feature goods such as frozen mantou buns and frozen scallion pancakes. While some of these originate in Singapore, Taiwan, Hong Kong or locally, others are manufactured in ChinaFootnote2.
China instituted widespread lockdowns due to Omicron. This has had a significant negative impact on retail chains, including traditional Chinese pastry chains that primarily sell fresh productsFootnote1.
New product launch analysis
Between 2018 and 2022, Mintel's Global New Product Database tracked 394 new product launchesFootnote3. 67% of these new products were launched in the last two years. These represented slightly less than 5% of all tracked bakery product launches in China over this period (7,980 total).
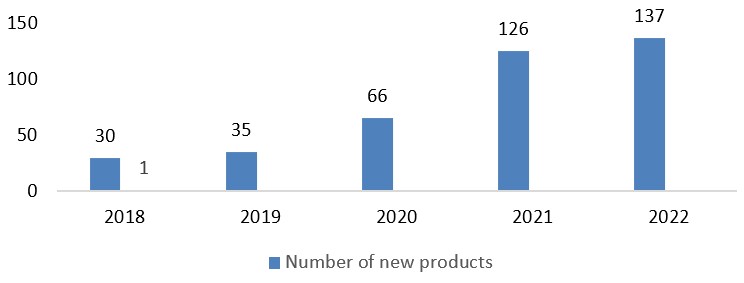
Description of above image
| 2018 | 2019 | 2020 | 2021 | 2022 | Total sample | |
|---|---|---|---|---|---|---|
| Number of new products | 30 | 35 | 66 | 126 | 137 | 394 |
Source: Mintel GNPD, 2023, all rights reserved
The two largest categories for frozen bakery products were cakes, pastries & sweet goods (223 new product launches) and bread & bread products (137 new product launches). Sweet biscuits & cookies and baking ingredients & mixes featured 16 new launches each, and 2 new savoury biscuits & crackers were launched, rounding out new product launches.
Examples of new product launches
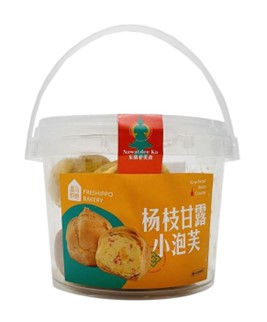
Mango Pomelo Sago Flavoured Puffs
Source: Mintel GNPD, 2023, all rights reserved
| Company | Hema |
|---|---|
| Brand | Freshippo Bakery |
| Category | Bakery |
| Sub-category | Cakes, pastries and sweet goods |
| Market | China |
| Store name | He Ma Xian Sheng |
| Store type | Supermarket |
| Store address | Shenzhen 518000 |
| Date published | June 2023 |
| Product source | Shopper |
| Launch type | New variety / range extension |
| Price in local currency | CNY16.90 |
| Price in US dollars | 2.39 |
| Price in Euros | 2.23 |
Hema / Freshippo Bakery Yang Zhi Gan Lu Xiao Pao Fu (Mango Pomelo Sago Flavoured Puffs) are now available, and retail in an 88 gram pack containing eight units. - Southeast Asian cuisine- Bite size
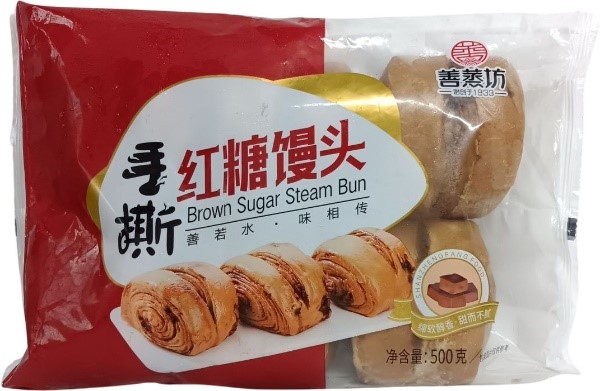
Brown Sugar Steamed Mantou Buns
Source: Mintel GNPD, 2023, all rights reserved
| Company | Shanzhengfang Food |
|---|---|
| Category | Bakery |
| Sub-category | Bread and bread products |
| Market | China |
| Import status | Not imported |
| Store name | JD |
| Store type | Internet / mail order |
| Date published | June 2023 |
| Launch type | New product |
| Price in local currency | CNY12.90 |
| Price in US dollars | 1.83 |
| Price in Euros | 1.70 |
Shanzhengfang Food Shou Si Hong Tang Man Tou (Brown Sugar Steamed Mantou Buns) are now available, and retail in a 500 gram pack. - Soft, mellow and aromatic - Sweet and do not taste too heavy - Microwaveable - Serving instructions - Logos and certifications: QR code
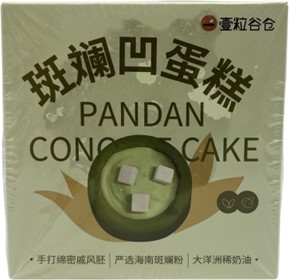
Pandan Concave Cake
Source: Mintel GNPD, 2023, all rights reserved
| Company | Yi Li Gu Cang Food |
|---|---|
| Category | Bakery |
| Sub-category | Cakes, pastries and sweet goods |
| Market | China |
| Import status | Not imported |
| Store name | Yong Hui |
| Store type | Supermarket |
| Store address | Fuzhou 360001 |
| Date published | June 2023 |
| Launch type | New variety / range extension |
| Price in local currency | CNY23.90 |
| Price in US dollars | 3.37 |
| Price in Euros | 3.15 |
Yi Li Gu Cang Ban Lan Ao Dan Gao (Pandan Concave Cake) is now available, and retails in a 120 gram pack. - Handmade smooth chiffon cake base - Selected Hainan pandan powder - Oceania single cream - Made with animal cream - Serving instruction
Cream Mille Crepes

Source: Mintel GNPD, 2023, all rights reserved
| Company | Ajinomoto Frozen Food |
|---|---|
| Category | Bakery |
| Sub-category | Cakes, pastries and sweet goods |
| Market | China |
| Import status | Not imported |
| Store name | JD |
| Store type | Internet / mail order |
| Date published | October 2022 |
| Launch type | New product |
| Price in local currency | CNY44.00 |
| Price in US dollars | 6.13 |
| Price in Euros | 6.31 |
Ajinomoto Nai You Qian Ceng Dan Gao (Cream Mille Crepes) is now available and retails in a 480 gram pack. - Not sliced - Contains no GMO ingredient - Logos and certifications: WeChat QR code, QR code
For more information
The Canadian Trade Commissioner Service:
International Trade Commissioners can provide Canadian industry with on-the-ground expertise regarding market potential, current conditions and local business contacts, and are an excellent point of contact for export advice.
More agri-food market intelligence:
International agri-food market intelligence
Discover global agriculture and food opportunities, the complete library of Global Analysis reports, market trends and forecasts, and information on Canada's free trade agreements.
Agri-food market intelligence service
Canadian agri-food and seafood businesses can take advantage of a customized service of reports and analysis, and join our email subscription service to have the latest reports delivered directly to their inbox.
More on Canada's agriculture and agri-food sectors:
Canada's agriculture sectors
Information on the agriculture industry by sector. Data on international markets. Initiatives to support awareness of the industry in Canada. How the department engages with the industry.
Resources
- Euromonitor International, 2023
- Euromonitor | November 2022. Baked Goods in China
- Mintel Global New Products Database, 2023
- Mintel Market Sizes, 2023
Customized Report Service – Frozen baked goods in China
Global Analysis Report
Prepared by: Alexandre Holm Perrault, Market Analyst
© His Majesty the King in Right of Canada, represented by the Minister of Agriculture and Agri-Food (2023).
Photo credits
All photographs reproduced in this publication are used by permission of the rights holders.
All images, unless otherwise noted, are copyright His Majesty the King in Right of Canada.
To join our distribution list or to suggest additional report topics or markets, please contact:
Agriculture and Agri-Food Canada, Global Analysis1341 Baseline Rd, Tower 5, 3rd floor
Ottawa ON K1A 0C5
Canada
Email: aafc.mas-sam.aac@agr.gc.ca
The Government of Canada has prepared this report based on primary and secondary sources of information. Although every effort has been made to ensure that the information is accurate, Agriculture and Agri-Food Canada (AAFC) assumes no liability for any actions taken based on the information contained herein.
Reproduction or redistribution of this document, in whole or in part, must include acknowledgement of agriculture and agri-food Canada as the owner of the copyright in the document, through a reference citing AAFC, the title of the document and the year. Where the reproduction or redistribution includes data from this document, it must also include an acknowledgement of the specific data source(s), as noted in this document.
Agriculture and Agri-Food Canada provides this document and other report services to agriculture and food industry clients free of charge.