

Note: This report includes forecasting data that is based on baseline historical data.
Market snapshot
In 2021, Mexico imported a total value of Can$3.4 billion in pork and pork products, followed by Can$2.4 billion in milk and dairy products, Can$1.6 billion in beef and veal products, and Can$315 million in egg products with(out) shell. Leading suppliers of these meat, dairy, and egg products were the United States (US) (80.6%), Canada (9.4%), Nicaragua (1.9%), New Zealand (1.5%), and Spain (0.8%).
The Mexican fresh meat sector based on retail sales (including beef and veal, poultry, pork, lamb/mutton/goat, and other remaining meat categories) have grown at a compound annual growth rate (CAGR) of 8.3% from US$15.4 billion (5.9 million tonnes) in 2016 to US$22.9 billion (6.5 million tonnes) in 2021. The highest registered sales within this sector in Mexico were for fresh beef & veal (US$9.6 billion), fresh poultry (US$7.2 billion), and fresh pork (US$5.5 billion) products.
Over the last year (2021), the processed meat industry reached sales of US$2.4 billion (454.9 thousand tonnes) within Mexico at a CAGR of 9.8% (2016-2021). Processed red meat accounted for 70.5% (US$1.7 billion; 264.3 thousand tonnes), while the remaining 41.9% (US$719.8 million; 190.7 thousand tonnes) were for sales of processed poultry.
Per capita consumption (PCC) of meat in Mexico stood higher in the fresh meat category at 51.2kg versus consumption of processed meat at 3.6kg per capita in 2021. This equated to a per capita expenditure (PCE) for both fresh and processed meat in Mexico of US$198.6, which registered a CAGR of 7.5% (2016-2021).
In 2021, the dairy sector in Mexico reached retail sales of US$12.3 billion and fresh eggs totaled a value of US$3.1 billion (2.5 million tonnes). Over the year, top categories in the dairy sector included drinking milk products (US$4.2 billion), cheese (US$3.8 billion; 518.6 thousand tonnes), and yoghurt & sour milk products (US$1.5 billion).
Production
In 2020, Mexican farmers produced 35.6 million cattle and 18.8 million pigs, representing approximately a growth of 1.3% and 3.0%, respectively since 2016. Other top livestock produced in Mexico includes chickens (591.6 million), goats (8.8 million), sheep (8.7 million) and ducks (8.5 million).
In Mexico, the number of hen eggs (in shell) produced were 56.9 billion (3.0 million tonnes) in 2020. The number of cows producing whole fresh milk were 2.6 million heads (12.6 million tonnes), followed by milk producing sheep of 1.5 million heads (56.4 thousand tonnes), and milking goats equivalent to 765.6 thousand heads (163.6 thousand tonnes).
| Selected livestock ('000 head) | 2016 | 2017 | 2018 | 2019 | 2020 | CAGR* % 2016-2020 |
|---|---|---|---|---|---|---|
| Chickens[1] | 549,231.0 | 556,128.0 | 568,372.0 | 580,829.0 | 591,596.0 | 1.9 |
| Cattle[1] | 33,779.3 | 34,277.9 | 34,820.3 | 35,225.0 | 35,639.2 | 1.3 |
| Pigs[1] | 16,688.2 | 17,210.3 | 17,838.9 | 18,365.3 | 18,788.0 | 3.0 |
| Goats[1] | 8,755.2 | 8,725.2 | 8,749.6 | 8,791.9 | 8,830.7 | 0.2 |
| Sheep[1] | 8,792.7 | 8,902.5 | 8,683.8 | 8,708.2 | 8,725.9 | − 0.2 |
| Ducks | 8,358.0 | 8,449.0 | 8,457.0 | 8,480.0 | 8,503.0 | 0.4 |
| Horses | 6,373.6 | 6,379.1 | 6,379.5 | 6,383.1 | 6,386.8 | 0.1 |
| Asses | 3,284.4 | 3,287.3 | 3,288.7 | 3,290.5 | 3,292.3 | 0.1 |
| Mules | 3,287.8 | 3,282.4 | 3,282.1 | 3,282.1 | 3,282.2 | − 0.04 |
| Turkeys[1] | 3,741.0 | 3,679.0 | 3,775.0 | 3,792.0 | 3,757.0 | 0.1 |
| Rabbits and hares | 1,383.0 | 1,391.0 | 1,394.0 | 1,398.0 | 1,403.0 | 0.4 |
|
Source: FAOSTAT Agricultural Production, 2022 1: Official data - Chicken, cattle, pigs, goats, sheep, turkeys |
||||||
| Selected domain | Sub-category | Measurement type (unit) | 2016 | 2020 | CAGR* % 2016-2020 |
|---|---|---|---|---|---|
| Eggs | Hen eggs, in shell | Production - number (billion head)[1] | 51.3 | 56.9 | 2.6 |
| Hen eggs, in shell | Production ('000 tonnes)[2] | 2,720.2 | 3,016.0 | 2.6 | |
| Pork | Producing pigs | Animals/slaughtered ('000 head)[2] | 16,793.9 | 20,287.6 | 4.8 |
| Meat, pigs | Production ('000 tonnes)[2] | 1,376.2 | 1,652.4 | 4.7 | |
| Edible offals, pigs | Production ('000 tonnes)[1] | 128.7 | 154.5 | 4.7 | |
| Fat, pig | Production ('000 tonnes)[1] | 96.5 | 115.9 | 4.7 | |
| Dairy | Cows, whole fresh milk | Milk animals ('000 head)[2] | 2,489.7 | 2,594.9 | 1.0 |
| Cows, whole fresh milk | Milk production ('000 tonnes)[2] | 11,608.4 | 12,563.7 | 2.0 | |
| Sheep, whole fresh milk | Milk animals ('000 head)[1] | 1,489.4 | 1,483.0 | − 0.1 | |
| Sheep, whole fresh milk | Milk production ('000 tonnes)[1] | 56.6 | 56.4 | − 0.1 | |
| Goat, whole fresh milk | Milk animals ('000 head)[1] | 758.9 | 765.6 | 0.2 | |
| Goat, whole fresh milk | Milk production ('000 tonnes)[2] | 160.2 | 163.6 | 0.5 | |
| Beef | Producing cattle | Animals/slaughtered ('000 head)[2] | 7,958.0 | 8,405.1 | 1.4 |
| Meat, cattle | Production ('000 tonnes)[2] | 1,878.7 | 2,081.3 | 2.6 | |
| Edible offals, cattle | Production ('000 tonnes)[1] | 292.2 | 323.8 | 2.6 | |
| Fresh hides, cattle | Production ('000 tonnes)[1] | 233.1 | 258.2 | 2.6 | |
| Fat, cattle | Production ('000 tonnes)[1] | 73.1 | 80.9 | 2.6 | |
|
Source: FAOSTAT Agricultural Production, 2022 1: Official data 2: Unofficial figure (based on imputation methodology) |
|||||
Mexico's trade of livestock (genetics), meat, dairy and egg products
In 2021, Mexican the number of imports of live pure-bred cattle totaled 2,589 (Can$5.3 million) and the number of live pure-bred swine were 4,795 (Can$4.3 million). Over the year, Mexico imported 2,776 kilograms (Can$21.6 million) in bovine semen and 660 (Can$161,991) embryos of cattle, horses, pigs, sheep and goats. Lastly, 37,086 tonnes (Can$235.9 million) of birds' eggs used for incubation were imported by Mexico in 2021.
Top supplier markets for all these livestock or animal genetic types (including eggs imported for incubation) were the United States (Can$213.3 million), Brazil (Can$26.1 million), Canada (Can$7.5 million), Spain (Can$4.2 million), Denmark (Can$905,355), and France (Can$543,344).
| Import description | Volume | Value (Can$ million) | Top export markets and value share % | ||
|---|---|---|---|---|---|
| 1 | 2 | 3 | |||
| Birds' eggs, fertilized for incubation (tonnes) (HS: 040711, 040719) | 37,086 | 235.9 | United States: 79.2 | Brazil: 11.1 | Spain: 1.5 |
| 051110 - Semen bovine (kilograms) | 2,776 | 21.6 | United States: 77.3 | Canada: 16.3 | France: 2.5 |
| 010221 - Live cattle, pure-bred (number) | 2,589 | 5.3 | United States: 85.8 | Canada: 14.2 | |
| 010310 - Live swine, pure-bred (number) | 4,795 | 4.3 | United States: 50.9 | Canada: 30.0 | Denmark: 19.1 |
| 05119905 - Embryos of cattle, horses, pigs, sheep and goats (number) | 660 | 0.162 | Spain: 86.1 | United States: 13.9 | |
Beef and veal meat products
In 2021, Mexico imported a total of Can$1.6 billion in beef and veal meat products, growing at a CAGR of 5.4% (2017 to 2021). Top supplier markets were the US (75.8%), Canada (11.5%), Nicaragua (9.4%), Australia (0.8%), and Costa Rica (0.2%). Other smaller import markets included Japan, Panama, Brazil, Chile and New Zealand.
| Market | 2017 | 2021 | Market share (%) in 2021 | CAGR* % (2017-2021) |
|---|---|---|---|---|
| Total - imports | 1,269.4 | 1,567.5 | 100.0 | 5.4 |
| 1. United States | 1,064.6 | 1,187.3 | 75.8 | 2.8 |
| 2. Canada | 124.2 | 180.8 | 11.5 | 9.8 |
| 3. Nicaragua | 61.1 | 147.0 | 9.4 | 24.5 |
| 4. Australia | 11.2 | 12.2 | 0.8 | 2.2 |
| 5. Costa Rica | 1.3 | 3.6 | 0.2 | 28.9 |
| 6. Japan | 0.4 | 1.8 | 0.1 | 41.5 |
| 7. Panama | 1.3 | 1.1 | 0.1 | −5.4 |
| 8. Brazil | 0.0 | 0.531 | 0.03 | /100.0 |
| 9. Chile | 0.482 | 0.233 | 0.01 | −16.6 |
| 10. New Zealand | 2.904 | 0.076 | 0.005 | −59.8 |
| Subtotal - top 10 | 1,267.2 | 1,534.6 | 97.9 | 4.9 |
|
Source for both tables: Global Trade Tracker (GTT), 2022 *CAGR: Compound Annual Growth Rate |
||||
The top global imports in 2021 of beef and veal commodities into Mexico were fresh/chilled boneless bovine meat at Can$1.1 billion (HS: 020130), frozen edible bovine offal, excluding tongues and livers at Can$266.0 million
(HS: 020629), frozen boneless meat of bovine animals at Can$88.3 million (HS: 020230), fresh/chilled bovine cuts with bone in (excluding carcasses) at Can$86.3 million (HS: 020120), and prepared/preserved meat or offal of bovine animals (excluding sausage products) at Can$16.4 million (HS: 160250).
Over the last year, other top Canadian beef and veal products supplied to Mexico (including top 4 global products) were fresh or chilled edible offal of bovine animals (HS: 020610), frozen edible bovine tongues (HS: 020621), and frozen bovine cuts, with bone in (excluding carcasses) (HS: 020220).
| Import description | Volume (tonnes) | Value (Can$ million) | Top export markets and value share % | ||
|---|---|---|---|---|---|
| 1 | 2 | 3 | |||
| Total - imports | 175,452 | 1,567.5 | United States: 75.8 | Canada: 11.5 | Nicaragua: 9.4 |
| 020130 - Fresh/chilled bovine meat, boneless | 106,565 | 1,073.9 | United States: 73.7 | Canada: 13.5 | Nicaragua: 10.2 |
| 020629 - Frozen edible bovine offal: (excluding tongues and livers) | 43,939 | 266.0 | United States: 88.6 | Canada: 6.9 | Australia: 2.0 |
| 020230 - Frozen meat of bovine animals, boneless | 9,094 | 88.3 | United States: 84.5 | Canada: 9.1 | Australia: 3.7 |
| 020120 - Fresh/chilled bovine cuts, with bone in (excluding carcasses) | 8,226 | 86.3 | United States: 59.0 | Nicaragua: 28.0 | Canada: 7.6 |
| 160250 - Prepared/preserved meat or offal of bovine animals (excluding sausage products) | 2,985 | 16.4 | United States: 46.1 | Costa Rica: 21.9 | Nicaragua: 17.1 |
| 020220 - Frozen bovine cuts, with bone-in (excluding carcasses) | 1,275 | 12.5 | United States: 81.9 | Nicaragua: 17.6 | Canada: 0.5 |
| 020621 - Frozen edible bovine tongues | 1,156 | 12.2 | United States: 60.0 | Nicaragua: 20.6 | Canada: 7.3 |
| 020610 - Fresh/chilled edible offal of bovine animals | 433 | 9.2 | United States: 78.4 | Canada: 15.0 | Unspecified: 6.6 |
| 020622 - Frozen edible bovine livers | 1,779 | 2.5 | United States: 95.0 | Nicaragua: 5.0 | |
| Source: Global Trade Tracker (GTT), 2022 | |||||
Pork meat and pork products
In 2021, Mexico imported a total of Can$3.4 billion in pork and pork meat products, growing at a CAGR of 7.1% (2017-2021). Top supplier markets were the US (82.0%), Canada (15.8%), Spain (1.5%), Chile (0.2%), and Denmark (0.1%). Other smaller import markets in 2021, included Italy and France. Germany did not supply any pork to Mexico in 2021, while China and Brazil only supplied small amounts back in 2018.
The top global imports of pork commodities into Mexico were fresh/chilled hams, shoulders and cuts thereof of swine, bone in at Can$2.0 billion (HS: 020312), frozen meat of swine (excluding carcasses or with bone in) at Can$279.3 million (HS: 020329), sausages of meat, offal or blood, and similar food preparations/products at Can$269.1 million (HS: 1601), fresh/chilled meat of swine (excluding carcasses or with bone in) at Can$233.3 million (HS: 020319), and fresh/chilled edible offal of swine at Can$187.5 million (HS: 020630) in 2021.
Over the last year, other top Canadian pork products supplied to Mexico (including top 4 global products o/t HS: 1601) were frozen edible offal of swine, excluding livers (HS: 020649), fresh/chilled, frozen or salted pig fat, free of lean meat, not rendered or extracted, in brine, dried or smoked (HS: 020910), and hams, shoulders and cuts thereof of swine, salted, in brine, dried or smoked, with bone in (HS: 021011).
| Market | 2017 | 2021 | Market share (%) in 2021 | CAGR* % (2017-2021) |
|---|---|---|---|---|
| Total - imports | 2,598.0 | 3,413.0 | 100.0 | 7.1 |
| 1. United States | 2,245.6 | 2,797.7 | 82.0 | 5.6 |
| 2. Canada | 302.0 | 538.9 | 15.8 | 15.6 |
| 3. Spain | 35.6 | 51.8 | 1.5 | 9.8 |
| 4. Chile | 11.1 | 7.7 | 0.2 | −8.6 |
| 5. Denmark | 2.7 | 3.7 | 0.1 | 8.6 |
| 6. Italy | 1.0 | 1.8 | 0.1 | 15.7 |
| 7. France | 0.024 | 0.011 | 0.0 | −18.5 |
| 8. Germany | 0.034 | 0.0 | 0.0 | −34.3 |
| 9. China[1] | 0.0 | 0.0 | 0.0 | |
| 10. Brazil[1] | 0.0 | 0.0 | 0.0 | |
| Subtotal - top 10 | 2,598.0 | 3,401.7 | 99.7 | 7.0 |
| Unspecified countries and territories in 2021 | 11.3 | 0.3 | ||
|
Source: Global Trade Tracker (GTT), 2022 *CAGR: Compound Annual Growth Rate 1: Small values in 2018 |
||||
| Import description | Volume: (tonnes) | Value: (Can$ million) | Top export markets and value share % | ||
|---|---|---|---|---|---|
| 1 | 2 | 3 | |||
| Total - imports | 1,409,936 | 3,413.0 | United States: 82.0 | Canada: 15.8 | Spain: 1.5 |
| 020312 - Fresh/chilled hams, shoulders and cuts thereof of swine, bone in | 908,358 | 2,013.2 | United States: 86.3 | Canada: 13.7 | |
| 020329 - Frozen meat of swine: (excluding carcasses or with bone in) | 79,426 | 279.3 | United States: 75.8 | Canada: 19.9 | Spain: 2.5 |
| 1601 - Sausages of meat, offal or blood, and similar food preparations/products | 43,381 | 269.1 | United States: 96.2 | Spain: 2.7 | Denmark: 0.8 |
| 020319 - Fresh/chilled meat of swine: (excluding carcasses or with bone in) | 82,941 | 233.3 | United States: 63.7 | Canada: 36.3 | |
| 020630 - Fresh/chilled edible offal of swine | 143,518 | 187.5 | United States: 77.7 | Canada: 22.3 | |
| 020649 - Frozen edible offal of swine: (excluding livers) | 52,917 | 118.9 | United States: 58.3 | Canada: 29.7 | Spain: 3.4 |
| 021012 - Bellies "streaky" and cuts of swine, salted, in brine, dried or smoked | 12,101 | 78.7 | United States: 88.8 | Canada: 10.0 | Unspecified: 1.2 |
| 020910 - Fresh/frozen pig fat, free of lean meat, not rendered or extracted, salted, in brine, dried or smoked | 52,960 | 69.5 | Canada: 49.7 | United States: 44.6 | Chile: 5.7 |
| 160249 - Prepared/preserved meat and offal of swine, including mixtures (excluding hams, shoulders cuts, sausage, and finely homogenized preps.) | 5,986 | 59.3 | United States: 96.8 | Spain: 2.9 | Canada: 0.07 |
| 150110 - Lard, rendered or otherwise extracted (excluding lard stearin or lard oil) | 16,432 | 30.7 | United States: 93.0 | Canada: 7.0 | |
| Source: Global Trade Tracker (GTT), 2022 | |||||
Milk, dairy and egg products
In 2021, Mexico imported a total of Can$2.4 billion in milk and dairy products, growing at a CAGR of 3.2% (2017-2021). Top supplier markets were the US (81.4%), New Zealand (4.6%), the Netherlands (2.0%), Uruguay (1.2%), and Chile (1.1%). Other smaller import markets in 2021, included Germany, Italy, Denmark, France, and Spain. Canada was the 11th largest dairy supplier to Mexico for pork related products at a value of Can$5.2 million in 2021.
Over the last year, Mexico imported a total of Can$315 million in egg products (with/without shell), growing at a CAGR of 7.4% (2017-2021). Top supplier markets were the US (84.3%), Brazil (8.3%), Spain (1.2%), Canada (0.6%), and Argentina (0.1%). Other smaller import markets in 2021, included France, while Denmark (2018-2019) and Germany (2019-2020) supplied smaller amounts of egg products in previous years.
| Market | 2017 | 2021 | CAGR* % (2017-2021) | Market share (%) in 2021 |
|---|---|---|---|---|
| Total - imports | 2,152.0 | 2,444.4 | 3.2 | 100.0 |
| 1. United States | 1,531.3 | 1,989.8 | 6.8 | 81.4 |
| 2. New Zealand | 265.4 | 111.8 | −19.4 | 4.6 |
| 3. Netherlands | 69.8 | 49.6 | −8.2 | 2.0 |
| 4. Uruguay | 46.6 | 28.2 | −11.8 | 1.2 |
| 5. Chile | 32.7 | 26.3 | −5.3 | 1.1 |
| 6. Germany | 27.9 | 21.8 | −5.9 | 0.9 |
| 7. Italy | 5.9 | 8.5 | 9.6 | 0.3 |
| 8. Denmark | 10.4 | 6.8 | −10.0 | 0.3 |
| 9. France | 6.2 | 6.8 | 2.3 | 0.3 |
| 10. Spain | 97.5 | 5.7 | −50.8 | 0.2 |
| Subtotal - top 10 | 2,093.5 | 2,255.3 | 1.9 | 92.3 |
| 11. Canada | 22.3 | 5.2 | −30.5 | 0.2 |
| Unspecified countries and territories in 2021 | 165.0 | 6.7 | ||
|
Source: Global Trade Tracker (GTT), 2022 *CAGR: Compound Annual Growth Rate |
||||
| Market | 2017 | 2021 | CAGR* % (2017-2021) | Market share (%) in 2021 |
|---|---|---|---|---|
| Total - imports | 236.9 | 315.0 | 7.4 | 100.0 |
| 1. United States | 222.1 | 265.4 | 4.6 | 84.3 |
| 2. Brazil | 12.7 | 26.1 | 19.6 | 8.3 |
| 3. Spain | 0.149 | 3.6 | 122.2 | 1.2 |
| 4. Canada | 1.2 | 1.8 | 10.9 | 0.6 |
| 5. Argentina | 0.563 | 0.379 | −9.4 | 0.1 |
| 6. France | 0.197 | 0.0 | −100.0 | 0.0 |
| 7. Denmark | 0.0 | 0.0 | −100.0 | 0.0 |
| 8. Germany | 0.0 | 0.0 | −100.0 | 0.0 |
| Subtotal - top 10 | 236.9 | 297.3 | 5.8 | 94.4 |
| Unspecified countries and territories in 2021 | 17.6 | 5.6 | ||
|
Source: Global Trade Tracker (GTT), 2022 *CAGR: Compound Annual Growth Rate |
||||
The top global imports of dairy or egg commodities into Mexico were milk and cream in solid forms, fat content by weight (≤ 1.5%) at Can$1.3 billion (HS: 040210), cheese and curd (excluding fresh cheese; including grated/powdered cheese, whey, processed and veined cheese) at Can$409.7 million (HS: 040690), grated or powdered cheese of all kinds at Can$298.9 million (HS: 040620), fertilised eggs for incubation, of domestic fowls at Can$234.2 million (HS: 040711), and whey and modified whey, whether concentrated or containing added sugar/sweetener at Can$106.8 million (HS: 040410) in 2021.
| Import description | Volume: (tonnes) | Value: (Can$ million) | Top export markets and value share % | ||
|---|---|---|---|---|---|
| 1 | 2 | 3 | |||
| Total - imports | 667,760 | 2,759.4 | United States: 81.7 | New Zealand: 4.1 | Netherlands: 1.8 |
| Subtotal - Milk and cream, concentrated with added sugar or other sweetening matter (0402) | 346,805 | 1,290.8 | United States: 89.8 | Chile: 0.4 | New Zealand: 0.2 |
| 040210 - Milk and cream in solid forms, fat content by weight (≤ 1.5%) | 337,746 | 1,254.2 | United States: 90.5 | Canada: 0.1 | United Kingdom: 0.01 |
| 040221 - Milk and cream in solid forms, unsweetened, fat content by weight (>1.5%) | 6,877 | 28.7 | United States: 76.2 | New Zealand: 9.7 | Uruguay: 9.0 |
| Subtotal - Cheese and curd (0406) | 131,843 | 754.8 | United States: 77.9 | Netherlands: 6.3 | Uruguay: 3.4 |
| 040690 - Cheese (excluding fresh cheese, including curd, grated/powdered, whey, processed and veined cheese) | 70,943 | 409.7 | United States: 61.2 | Netherlands: 11.0 | Uruguay: 6.2 |
| 040620 - Grated or powdered cheese, of all kinds | 53,240 | 298.9 | United States: 99.8 | Spain: 0.07 | Italy: 0.06 |
| 040610 - Fresh cheese "unripened or uncured" (including whey cheese, and curd) | 6,137 | 34.8 | United States: 99.6 | Italy: 0.2 | New Zealand: 0.1 |
| Subtotal - Birds' eggs, in shell (0407) | 82,355 | 301.8 | United States: 83.7 | Brazil: 8.7 | Spain: 1.2 |
| 040711 - Fertilised eggs for incubation, of domestic fowls | 37,005 | 234.2 | United States: 79.7 | Brazil: 11.2 | Spain: 1.6 |
| 040721 - Fresh eggs of domestic fowls, in shell | 44,627 | 64.9 | United States: 100.0 | ||
| Subtotal - Whey (modified) products consisting of natural milk constituents, with(out) sugar (0404) | 69,083 | 199.7 | United States: 80.9 | Canada: 2.1 | Denmark: 1.4 |
| 040410 - Whey and modified whey, whether concentrated or containing added sugar/sweetener | 53,414 | 106.8 | United States: 80.7 | Germany: 2.6 | Denmark: 2.5 |
| 040490- Products consisting of natural milk constituents, whether/not sweetened, nowhere else specified | 15,670 | 92.9 | United States: 81.1 | Canada: 4.0 | New Zealand: 0.7 |
| Subtotal - Butter and dairy spreads (including dehydrated butter, ghee, other derived from milk) (0405) | 19,767 | 126.9 | New Zealand: 68.1 | United States: 15.8 | Australia: 3.1 |
| 040590 - Fats and oils derived from milk, dehydrated butter and ghee (excluding natural butter) | 14,746 | 95.2 | New Zealand: 82.1 | United States: 4.6 | Australia: 4.2 |
| 040510 - Butter (excluding dehydrated butter and ghee) | 5,019 | 31.6 | United States: 49.6 | New Zealand: 25.9 | France: 11.4 |
| Subtotal - Buttermilk, curdled milk and cream, yogurt, kephir and other fermented products (0403) | 13,167 | 47.2 | United States: 76.0 | New Zealand: 14.1 | Switzerland: 0.1 |
| 040390- Buttermilk, curdled milk and cream, kephir and other fermented or acidified milk and cream, may including sweetener, fruits, nuts or cocoa (excluding yogurt) | 9,257 | 32.0 | United States: 64.8 | New Zealand: 20.7 | Spain: 0.02 |
| Subtotal - Milk and cream, not concentrated, no added sugar or sweetening matter (0401) | 25.1 | United States: 98.4 | New Zealand: 1.0 | France: 0.3 | |
| 040120 - Milk and cream of a fat content by weight between (1% ≤ 6%), not concentrated, no sugar | 23.5 | United States: 99.99 | New Zealand: 0.01 | ||
| Subtotal - Birds' eggs and egg yolks, not in shell, with(out) added sugar/sweetener (0408) | 4,740 | 13.2 | United States: 97.1 | Argentina: 2.9 | |
| 040819 - Fresh/frozen or preserved, not sweetened (excluding dried) | 3,860 | 10.5 | United States: 100.0 | ||
| Source: Global Trade Tracker (GTT), 2022 | |||||
In 2021, top Canadian milk, dairy and egg products supplied to Mexico were fertilised birds' eggs for incubation (excluding of domestic fowls) at Can$1.6 million (HS: 040719), milk and cream in solid forms, of a fat content by weight of ≤1.5% at Can$734.6 million (HS: 040210), and whey and modified whey, whether/not concentrated or containing added sugar/other sweetening matter at Can$204.5 million (HS: 040410). Canadian products such as unsweetened milk and cream in solid forms, of a fat content by weight of >1.5% (HS: 040221) (2017), and fertilised eggs for incubation of domestic fowls (HS: 040711) (2017-2019) were imported from Mexico in previous years (as indicated).
| Market | 2017 | 2021 | CAGR* % (2017-2021) | Market share % in 2021 |
|---|---|---|---|---|
| Total - imports | 19,541.3 | 2,648.2 | −39.3 | 100.0 |
| 040719 - Fertilised birds' eggs for incubation (excluding of domestic fowls) | 530.8 | 1,642.7 | 32.6 | 62.0 |
| 040210 - Milk and cream in solid forms, of a fat content by weight of ≤1.5% | 18,243.5 | 734.6 | −55.2 | 27.7 |
| 040410 - Whey and modified whey, whether/not concentrated or containing added sugar/other sweetening matter | 64.1 | 204.5 | 33.6 | 7.7 |
| 040490 - Products consisting of natural milk constituents, whether or not sweetened, nowhere else specified
|
0.0 | 66.4 | 42.7 | 2.5 |
| 040221 - Milk and cream in solid forms, of a fat content by weight of (›1.5%), unsweetened | 431.5 | 0.0 | −100.0 | 0.0 |
| 040711 - Fertilised eggs for incubation, of domestic fowls | 271.4 | 0.0 | −100.0 | 0.0 |
|
Source: Global Trade Tracker (GTT), 2022 *CAGR: Compound Annual Growth Rate |
||||
Retail sales – meat, dairy and fresh eggs in Mexico
Meat
The Mexican fresh meat sector based on retail sales (including beef and veal, poultry, pork, lamb/mutton/goat, and other remaining meat categories) have grown at a CAGR of 8.3% from US$15.4 billion in 2016 to US$22.9 billion in 2021. Over this period, the highest growing categories in value terms included poultry, pork, and other combined fresh meat categories (horse, venison, camel, buffalo, game meat, rabbit) with registered historical CAGRs of 10.1%, 9.1%, 7.2%, respectively.
In volume terms, the fresh meat sector grew from 5.9 million tonnes in 2016 to 6.5 million tonnes in 2021, registering a CAGR of 2.1% in Mexico. Between 2021 and 2026, fresh meat is expected to grow by 1.9% to reach 7.2 million tonnes by 2026.
Per capita consumption (PCC) of meat in Mexico stood higher in the fresh meat category at 51.2kg versus processed meat at 3.6kg in 2021, compared to Canada at a fresh meat PCC level of 73.5kg versus 23.0kg in processed meat. In 2021, per capita expenditure (PCE) on both fresh and processed meat in Mexico amounted to a total value of US$198.6, representing a CAGR of 7.5% (2016-2021). Meanwhile, Canada's PCE on both fresh and processed meat totaled US$420.9 in 2021, at a CAGR of 1.1% over the same period.
In 2021, the processed meat industry reached sales of US$2.4 billion with volume sales of 454.9 thousand tonnes within Mexico. Processed red meat accounted for 70.5% (US$1.7 billion), while the remaining 41.9% (US$719.8 million) were for sales of processed poultry. Chilled red meat represented the bulk of its red meat sales at 87.3%, followed by frozen (12.4%) and shelf stable (0.3%) red meat types in 2021.
| Category | 2016 | 2021 | CAGR* (%) 2016-2021 | 2022 | 2026 | CAGR* (%) 2021-2026 |
|---|---|---|---|---|---|---|
| Total - fresh meat | 15,356.3 | 22,923.8 | 8.3 | 24,334.7 | 30,848.1 | 6.1 |
| Beef and veal | 6,924.9 | 9,642.0 | 6.8 | 10,208.9 | 13,051.5 | 6.2 |
| Poultry | 4,468.4 | 7,243.2 | 10.1 | 7,646.4 | 9,601.7 | 5.8 |
| Pork | 3,530.6 | 5,453.9 | 9.1 | 5,865.3 | 7,423.0 | 6.4 |
| Lamb, mutton and goat | 296.7 | 392.4 | 5.8 | 411.3 | 514.2 | 5.6 |
| Other fresh meat | 135.6 | 192.3 | 7.2 | 202.7 | 257.8 | 6.0 |
|
Source: Euromonitor International, 2022 *CAGR: Compound Annual Growth Rate |
||||||
| Category | 2016 | 2021 | CAGR* (%) 2016-2021 | 2022 | 2026 | CAGR* (%) 2021-2026 |
|---|---|---|---|---|---|---|
| Total - fresh meat | 5,900.6 | 6,542.7 | 2.1 | 6,657.0 | 7,174.4 | 1.9 |
| Poultry | 2,702.7 | 3,109.4 | 2.8 | 3,151.3 | 3,384.7 | 1.7 |
| Beef and veal | 1,637.8 | 1,725.6 | 1.0 | 1,753.1 | 1,899.3 | 1.9 |
| Pork | 1,342.5 | 1,478.9 | 2.0 | 1,519.9 | 1,639.7 | 2.1 |
| Lamb, mutton and goat | 128.1 | 133.8 | 0.9 | 135.9 | 145.2 | 1.6 |
| Other fresh meat | 89.5 | 95.0 | 1.2 | 96.9 | 105.4 | 2.1 |
|
Source: Euromonitor International, 2022 *CAGR: Compound Annual Growth Rate |
||||||
| Category | 2016 | 2021 | CAGR* (%) 2016-2021 | 2022 | 2026 | CAGR* (%) 2021-2026 |
|---|---|---|---|---|---|---|
| Total - processed meat | 1,529.4 | 2,439.2 | 9.8 | 2,699.7 | 3,807.6 | 9.3 |
| Subtotal - processed red meat | 1,086.2 | 1,719.4 | 9.6 | 1,905.4 | 2,692.0 | 9.4 |
| Chilled red meat | 948.4 | 1,501.2 | 9.6 | 1,671.0 | 2,371.9 | 9.6 |
| Frozen red meat | 133.1 | 213.5 | 9.9 | 229.5 | 314.0 | 8.0 |
| Shelf stable red meat | 4.7 | 4.7 | 0.0 | 4.9 | 6.1 | 5.4 |
| Subtotal - processed poultry | 443.2 | 719.8 | 10.2 | 794.4 | 1,115.6 | 9.2 |
|
Source: Euromonitor International, 2022 *CAGR: Compound Annual Growth Rate |
||||||
| Category | 2016 | 2021 | CAGR* (%) 2016-2021 | 2022 | 2026 | CAGR* (%) 2021-2026 |
|---|---|---|---|---|---|---|
| Total - processed meat | 379.0 | 454.9 | 3.7 | 481.7 | 570.4 | 4.6 |
| Subtotal - processed red meat | 225.5 | 264.3 | 3.2 | 279.1 | 328.2 | 4.4 |
| Chilled red meat | 169.4 | 203.0 | 3.7 | 215.4 | 255.1 | 4.7 |
| Frozen red meat | 55.5 | 60.9 | 1.9 | 63.3 | 72.7 | 3.6 |
| Shelf stable red meat | 0.6 | 0.4 | −7.8 | 0.4 | 0.4 | 0.0 |
| Subtotal - processed poultry | 153.6 | 190.7 | 4.4 | 202.6 | 242.2 | 4.9 |
|
Source: Euromonitor International, 2022 *CAGR: Compound Annual Growth Rate |
||||||
Dairy and fresh eggs
In 2021, the dairy sector in Mexico reached retail sales of US$12.3 billion and eggs totaled a value of US$3.3 billion (2.5 million tonnes). Top categories in the dairy sector included drinking milk products (US$4.2 billion), cheese (US$3.8 billion; 518.6 thousand tonnes), and yoghurt and sour milk products (US$1.5 billion).
Notably, purchases for dairy products and alternatives are more popular over real dairy products registering a total sales value of US$13.5 billion in 2021.
| Category | 2016 | 2021 | CAGR* (%) 2016-2021 | 2022 | 2026 | CAGR* (%) 2021-2026 |
|---|---|---|---|---|---|---|
| Total - dairy | 8,782.8 | 12,256.3 | 6.9 | 12,584.6 | 15,064.1 | 4.2 |
| Drinking milk products | 3,260.9 | 4,194.9 | 5.2 | 4,289.8 | 4,943.6 | 3.3 |
| Cheese | 2,407.1 | 3,845.5 | 9.8 | 3,951.8 | 4,923.2 | 5.1 |
| Yoghurt and sour milk products | 1,299.8 | 1,548.7 | 3.6 | 1,624.3 | 2,051.7 | 5.8 |
| Other dairy | 975.5 | 1,395.0 | 7.4 | 1,442.0 | 1,722.1 | 4.3 |
| Butter and spreads | 839.5 | 1,272.1 | 8.7 | 1,276.7 | 1,423.5 | 2.3 |
| Dairy products and alternatives | 9,682.5 | 13,517.9 | 6.9 | 13,928.7 | 16,802.3 | 4.4 |
| Total - eggs | 2,263.5 | 3,131.5 | 6.7 | 3,327.3 | 4,227.0 | 6.2 |
|
Source: Euromonitor International, 2022 *CAGR: Compound Annual Growth Rate |
||||||
| Category | 2016 | 2021 | CAGR* (%) 2016-2021 | 2022 | 2026 | CAGR* (%) 2021-2026 |
|---|---|---|---|---|---|---|
| Eggs | 2,183.6 | 2,510.0 | 2.8 | 2,550.0 | 2,755.5 | 1.9 |
| Butter and spreads | 557.3 | 617.6 | 2.1 | 626.1 | 655.8 | 1.2 |
| Cheese | 446.5 | 518.6 | 3.0 | 521.2 | 558.3 | 1.5 |
|
Source: Euromonitor International, 2022 *CAGR: Compound Annual Growth Rate |
||||||
Retail distribution of meat, seafood and alternatives to meat
The distribution channels in which consumers chose to purchase their meat, fish and seafood products did not alter much between 2020 and 2021. Mexicans continued to avoid frequent outings by most often shopping from within modern grocery retailers (45.8%) such as hyper/supermarkets and discounters, along with traditional independent smaller grocers (38.4%), which offers a larger variety of products under one location in a quick and safer fashion and may be able to support online orders. Mixed retailers held a 9.6% market share with 1.3% of Mexican consumers shopping from non-store (e-commerce) retailers in 2021.
| Distribution outlet type | % breakdown 2021 |
|---|---|
| Store-based retailing - grand total: | 98.7 |
| Total - grocery retailers | 89.1 |
| Subtotal - modern grocery retailers | 45.8 |
| Hypermarkets | 15.2 |
| Discounters | 14.6 |
| Supermarkets | 13.2 |
| Convenience Stores | 2.8 |
| Subtotal - traditional grocery retailers | 43.3 |
| Independent small grocers | 38.4 |
| Food/drink/tobacco specialists | 4.9 |
| Total - mixed retailers | 9.6 |
| Non-store retailing (e-commerce) - grand total: | 1.3 |
| Total - retail distribution channels | 100.0 |
| Source: Euromonitor International, 2022 | |
Competitive landscape in the meat and dairy sectors
In 2021, leading brands in the meat sector included Sigma Alimentos SA de CV (brands : Fud, San Rafael, Tangamanga) at a 41.4% value share, Grupo Bafar SAB de CV (Sabori, Bafar, Parma) at 13.8%, and Xignux SA De CV (Zwan, Kir, Duby) at 13.1%. Private labels held a 1.0% market value share at US$25.6 million in 2021 within the overall meat sector.
| Company | Brand(s) | Retail sales value (US$ million) | Company share (%) |
|---|---|---|---|
| Sigma Alimentos SA de CV | Fud, San Rafael, Tangamanga, Iberomex, Bernina, Peñaranda, Chimex, Viva, Sugerencias del Chef, San Antonio | 1,010.9 | 41.4 |
| Grupo Bafar SAB de CV | Sabori, Bafar, Parma, Campestre, Pery, Burr | 335.9 | 13.8 |
| Xignux SA De CV | Zwan, Kir, Duby, Alpino | 319.3 | 13.1 |
| American Beef SA de CV | American Beef | 125.1 | 5.1 |
| Saljamex SA de CV | All Saljamex | 114.0 | 4.7 |
| Grupo Capistrano SA de CV | All Capistrano | 101.7 | 4.2 |
| Giuseppe Citterio Salumificio SpA | Citterio | 22.2 | 0.9 |
| Pilgrim's Pride Corporation | Tyson | 21.0 | 0.9 |
| Kraft Heinz Company | Oscar Mayer | 17.1 | 0.7 |
| Grupo Viz SA de CV | Sukarne | 13.8 | 0.6 |
| Private label | Private label | 25.6 | 1.0 |
| Others | Others | 294.7 | 12.1 |
| Total - processed meat | 2,439.2 | 100.0 | |
| Source: Euromonitor International, 2022 | |||
In 2021, leading brands in the dairy sector included Grupo Lala SAB de CV (brands : Lala, Los Volcanes, Nutri Leche) at a 20.1% value share, Ganaderos Productores de Leche Pura SA de CV (Alpura, Forti Leche, Carranco) at 11.7%, and Nestlé SA (Carnation, Nido, Sveltesse) at 8.3%. Private labels held a 1.3% market value share at US$163.0 million in 2021 within the overall dairy sector.
| Company | Brand(s) | Retail sales value (US$ million) | Company share (%) |
|---|---|---|---|
| Grupo Lala SAB de CV | Lala, Los Volcanes, Nutri Leche, Borden, Mi Leche, Nutri Yoghurt | 2,469.6 | 20.1 |
| Ganaderos Productores de Leche Pura SA de CV | Alpura, Forti Leche, Carranco | 1,428.7 | 11.7 |
| Nestlé SA | Carnation, Nido, Sveltesse, Nestlé, Milkmaid/La Lechera/La Laitière/Moça, Chamyto, Coffee-mate, Media Crema, Fiorello, Chiquitin, Nature's Heart, Nesquick, Club | 1,023.2 | 8.3 |
| Sigma Alimentos SA de CV | Noche Buena, Fud, Eugenia, Franja, Norteñita, La Villita, Chalet | 719.4 | 5.9 |
| Danone, Groupe | Danone, Dan'Up, Activia, Silk, Danino, Flora, Vitalinea/Vitasnella/Taillefine | 526.4 | 4.3 |
| Lactalis, Groupe | Esmeralda, Parmalat | 372.2 | 3.0 |
| Yakult Honsha Co. Ltd. | Yakult, Soful | 319.1 | 2.6 |
| The Coca-Cola Company | Santa Clara, Ades, Del Valle | 289.2 | 2.4 |
| Cremería Americana SA de CV | Gloria, La Abuelita | 279.3 | 2.3 |
| Associated British Foods Plc | Inca | 272.6 | 2.2 |
| Private label | Private label | 163.0 | 1.3 |
| Others | Others | 2,731.3 | 22.3 |
| Total - dairy products | 12,256.3 | 100.0 | |
| Source: Euromonitor International, 2022 | |||
Product launch analysis of beef, pork and dairy
Meat food products - beef and pork
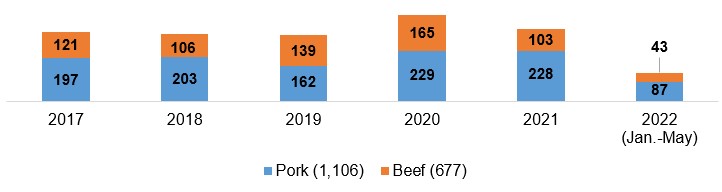
Mintel indicates that there were 1,106 new pork and 677 beef meat food products launched (including new variety/range extension, packaging, formulation or relaunched) within Mexico retail stores between the period of January 2017 and May, 2022.
Description of above image
| 2017 | 2018 | 2019 | 2020 | 2021 | 2022 (January to May) | Total | |
|---|---|---|---|---|---|---|---|
| Pork (1,106) | 197 | 203 | 162 | 229 | 228 | 87 | 1,106 |
| Beef (677) | 121 | 106 | 139 | 165 | 103 | 43 | 677 |
Source: Mintel, 2022
According to Mintel, the top parent companies launching pork products in Mexico over the five year period were Walmart (28), Productos Chata (20), Qualtia Alimentos Operaciones (15), Sigma Alimentos (14), and Intercarnes (13). Top pork brands over this period were Chata (49), Great Value (25), Peñaranda (19), Kirkland Signature (16), and Fud (16). New pork product brands launched recently include El Pozo (Iberian Chorizo pork slices), CJ Foods Bibigo (Korean style pork and vegetables mini Wontons), and Proan (Pork Picaña).
The top parent companies launching beef products in Mexico over the five year period were Unilever (15), Walmart (9), RYC Alimentos (7), Sigma Alimentos (6), Qualtia Alimentos Operaciones (5), and American Beef (4). Top beef brands over this period were Knorr (41), Marketside (26), SuKarne (21), Great Value (17), and Practi Rico (16). New beef product brands launched recently in Mexico include 7-Eleven (beans and barbecue burrito), Salud y Sabor (beef fajitas), CJ Foods Bibigo (beef Bogogi Mandu dumplings), and Jack Daniel's Old No. 7 (browned, seasoned and cooked beef brisket tips).
In Mexico, the fastest growing flavors paired with pork products were refried/Bayo beans, Chorizo, marinade, potato and honey, while growing beef product flavors were lime, vegetable, past/vermicelli, and barbecue [Q2-2020-2022]. New or popular ingredients paired with pork products were artificial orange flavor/nectar, blueberry, imitation cheddar cheese, liquid smoke flavor, cauliflower, and carrot. Popular ingredients paired with beef products were pepper jack cheese, red jalapeno pepper, grapeseed oil, white corn flour, natural grill flavor, instant coffee, whisky, and orange nectar.
| Top 10 categories | Top 50 brands launched (product item count) | Number of products in category |
|---|---|---|
| Processed fish, meat and egg products | Chata (38), Marketside (28), Kirkland Signature (24), SuKarne (21), Practi Rico (20), Peñaranda (18), Great Value (16), Extra Special (15), Fud (15), Carnes Ramos (14), Kir (14), Parma (13), Kowi (13), Corona (12), Daniele (11), Johnsonville (11) | 1,004 |
| Meals and meal centers | El Cazo Mexicano (12), Sigma Alimentos Fud (11), Great Value (10), Bimbo LonchiBon (10), Di Pranzo (8), Chata Burritos (7), ProGourmet (6), Kirkland Signature (6), Marketside (1), Extra Special (1), Carnes Ramos (1), Valley Foods (1) | 233 |
| Snacks | CarniSnack (8), Leyva (8), Chata (2), El Cazo Mexicano (2), Great Value (1), Daniele (1), Johnsonville (1), Noel (1), Carnes Gusi (1) | 166 |
| Sauces and seasonings | Knorr (13), Great Value (6), H-E-B (4), La Costeña (3), Fud (1) | 117 |
| Soup | Knorr (28), Chata (2), La Costeña (1) | 46 |
| Side dishes | Chata (11), La Costeña (3) | 32 |
| Savory spreads | Bernina (4), Tangamanga (3), Peñaranda (1) | 17 |
| Bakery | Great Value (1) | 11 |
| Fruit and vegetables | La Costeña (2) | 9 |
| Baby food | Nil | 4 |
| Total sample size | 1,642 | |
| Source: Mintel, 2022 | ||
Dairy products
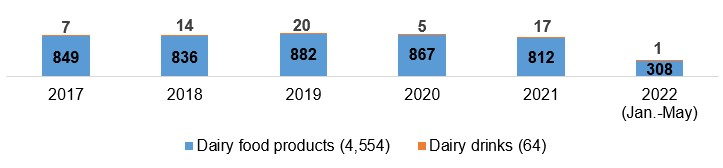
According to Mintel, there were 4,554 new dairy food and 64 (free from) dairy drink products launched (including new variety/range extension, packaging, formulation or relaunched) in Mexico's retail stores between the period of January 2017 and May, 2022.
Note: Several dairy food products and appears to be all of the dairy drink products are claiming to be vegan products that are free from dairy (milk) ingredients. Companies are offering increasingly more dairy-free choices to meet the increasing vegan or food-intolerance trends amongst Mexican consumers.
Description of above image
| 2017 | 2018 | 2019 | 2020 | 2021 | 2022 (January to May) | Total | |
|---|---|---|---|---|---|---|---|
| Dairy food products (4,554) | 849 | 836 | 882 | 867 | 812 | 308 | 4554 |
| Dairy drinks (64) | 7 | 14 | 20 | 5 | 17 | 1 | 64 |
Source: Mintel, 2022
Over the 5-year period, the top parent companies launching dairy food or (free from dairy) drink products in Mexico were Grupo Lala (135), Sigma Alimentos (60), Ganaderos Productores de Leche Pura (54), Nestlé (54), Groupe Danone (47) and Walmart (34). Top dairy brands over this period were Lala (213), Alpura (126), Santa Clara (95), Great Value (95), and Danone (64). New brands containing dairy or free-from ingredients launched recently include two products by Yo Mama's Yom Foods (Asian Sesame dressing and marinade and a radiant Rosé wine tomato sauce), Holanda Deliciosamente Vegano (chocolate with caramelized hazelnuts flavored ice cream), and Hershey's Almonds (mini chocolate and almonds coated vanilla ice cream pops).
In Mexico, the fastest growing flavors found in dairy products were mango, apple, peach, banana, and pineapple [Q2-2020-2022]. New or popular ingredients found in these dairy products were pepper jack cheese, methylcobalamin, monk fruit juice, sodium reduced salts, shrimp, hydroxypropyl cellulose, rose wine, and zucchini. Trending claims found on packaging included probiotic, diet/light, on-the-go, and vitamin/mineral fortified.
| Top 10 categories | Top 50 brands launched (product item count) | Number of products in category |
|---|---|---|
| Dairy | Other (1,950), Lala (214), Alpura (126), Santa Clara (95), Great Value (84), Danone (64), Sello Rojo (56), Yoplait (53), Valley Foods (45), Lyncott (44), Silk (43) | 3,618 |
| Desserts and ice cream | Other (330), Häagen-Dazs (37), H-E-B Select Ingredients Creamy Creations (28), Nutrisa (20), Valley Foods (11), Nestlé La Lechera (9), Great Value (7), Aurrera (4) | 457 |
| Bakery | Other (127), Sweetwell (18), H-E-B Organics (3) | 148 |
| Snacks | Other (135), Sweetwell (3), Great Value (1) | 139 |
| Baby food | Other (40) | 40 |
| Nutritional drinks and other beverages | Other (30), Great Value (1), Nutrisa (1) | 32 |
| Sauces and seasonings | Other (29), H-E-B (1) | 30 |
| Chocolate confectionery | Other (22), Sweetwell (2) | 24 |
| Meals and meal centers | Other (17), Great Value (2), Kirkland Signature (2) | 21 |
| Sweet spreads | Other (21) | 21 |
| Total sample size | 4,618 | |
| Source: Mintel, 2022 | ||
Product examples
Pork Crackling and Beans Wraps

Source: Mintel, 2022
| Company | Empacadora Ramos |
|---|---|
| Brand | Carnes Ramos, private label |
| Sub-category | Meals and meal centers, sandwiches / wraps |
| Country | Manufactured in Mexico, not imported |
| Related claims | Convenient packaging |
| Store name / type | Carnes Ramos, specialist retailer |
| Launch type | New product |
| Date published | March 2022 |
| Price in Canadian dollars | 2.36 |
This product contains excess of calories and saturated fats according to the Secretary of Health in Mexico, and retails in a 480 gram easy-open pack containing four units, featuring preparation instructions.
Browned, Seasoned and Cooked Beef Brisket Tips

Source: Mintel, 2022
| Company | Importadora Primex |
|---|---|
| Brand | Jack Daniel’s Old No. 7 |
| Sub-category | Processed fish, meat and egg products |
| Country | Manufactured in the United States, market – Mexico |
| Related claims | Microwaveable, environmentally friendly packaging |
| Store name / type | Costco, club store |
| Store address | Cuernavaca 62270 |
| Launch type | New product |
| Date published | April 2022 |
| Price in Canadian dollars | 17.98 |
This brisket has been glazed with Jack Daniel's Tennessee Whiskey Sauce, is seasoned with BBQ-style spices using high-quality fresh spices, and a sauce prepared in a saucepan made in small batches. The product has been inspected and passed by the U.S. Department of Agriculture, contains 0.02% of alcohol not recommended for children and excess amounts of sugars, saturated fats, and sodium according to the Secretariat of Health of Mexico. It can be heated in a microwave or oven, and retails in a 794 gram recyclable pack featuring preparation instructions.
Special Asadero Cheese

Source: Mintel, 2022
| Company | Lácteos Mojica |
|---|---|
| Brand | Santa Maru |
| Sub-category | Dairy, hard and semi-hard cheese |
| Country | Manufactured in Mexico, not imported |
| Related ingredients | Whole cow's milk, Rennet |
| Store name / type | Soriana, mass merchandise / hypermarket |
| Store address | Guadalajara, Jalisco 44860 |
| Launch type | New product |
| Date published | April 2022 |
| Price in Canadian dollars | 1.76 |
This product retails in a 250 gram pack. According to the Secretariat of Health for Mexico, is high in calories, saturated fats, trans fats and sodium.
Vanilla Flavored Coffee Creamer

Source: Mintel, 2022
| Company | Chobani |
|---|---|
| Brand | Chobani |
| Sub-category | Dairy, creamers |
| Country | Manufactured in the United States, market – Mexico |
| Related ingredients | Pasteurized milk, cream |
| Store name / type | Chedraui Selecto, supermarket |
| Store address | Mexico City 03310 |
| Launch type | New product |
| Date published | April 2022 |
| Price in Canadian dollars | 6.33 |
This product has been made with real grade A dairy, including real milk and real cream, contains no added oil and is described having been made using only farm fresh cream, milk and cane sugar. According to the Secretariat of Health for Mexico, it is high in calories, sugars and saturated fats. This creamer has been kosher certified, and contains no artificial flavors, sweeteners, preservatives, emulsifiers, carrageenan and rBST. It retails in a recyclable and FSC certified 710 millilitre pack.
For more information
The Canadian Trade Commissioner Service:
International Trade Commissioners can provide Canadian industry with on-the-ground expertise regarding market potential, current conditions and local business contacts, and are an excellent point of contact for export advice.
More agri-food market intelligence:
International agri-food market intelligence
Discover global agriculture and food opportunities, the complete library of Global Analysis reports, market trends and forecasts, and information on Canada's free trade agreements.
Agri-food market intelligence service
Canadian agri-food and seafood businesses can take advantage of a customized service of reports and analysis, and join our email subscription service to have the latest reports delivered directly to their inbox.
More on Canada's agriculture and agri-food sectors:
Canada's agriculture sectors
Information on the agriculture industry by sector. Data on international markets. Initiatives to support awareness of the industry in Canada. How the department engages with the industry.
Resources
- Euromonitor International, 2022
- Global Trade Tracker (GTT), 2022
- Mintel Global Data New Product (GDNP) database, 2022
Customized Report Services – Market Overview – Livestock, meat, dairy and genetics (beef, pork, eggs) in Mexico
Global Analysis Report
Prepared by: Erin-Ann Chauvin, Senior Market Analyst
© Her Majesty the Queen in Right of Canada, represented by the Minister of Agriculture and Agri-Food (2022).
Photo credits
All photographs reproduced in this publication are used by permission of the rights holders.
All images, unless otherwise noted, are copyright Her Majesty the Queen in Right of Canada.
To join our distribution list or to suggest additional report topics or markets, please contact:
Agriculture and Agri-Food Canada, Global Analysis1341 Baseline Rd, Tower 5, 3rd floor
Ottawa ON K1A 0C5
Canada
Email: aafc.mas-sam.aac@agr.gc.ca
The Government of Canada has prepared this report based on primary and secondary sources of information. Although every effort has been made to ensure that the information is accurate, Agriculture and Agri-Food Canada (AAFC) assumes no liability for any actions taken based on the information contained herein.
Reproduction or redistribution of this document, in whole or in part, must include acknowledgement of agriculture and agri-food Canada as the owner of the copyright in the document, through a reference citing AAFC, the title of the document and the year. Where the reproduction or redistribution includes data from this document, it must also include an acknowledgement of the specific data source(s), as noted in this document.
Agriculture and Agri-Food Canada provides this document and other report services to agriculture and food industry clients free of charge.