

Note: This report includes forecasting data that is based on baseline historical data.
Executive summary
The French economy is recovering post pandemic due to extensive fiscal support, effective virus containment, rising investment and strong consumer spending. In September 2020, the government introduced a Eur$100 billion long-term recovery plan, 'France Relance', partially financed by the European Union (EU), to help mitigate the impacts of the pandemic on the economy and facilitate recovery. As a result, gross domestic product (GDP) per capita reached US$44,884 in France in 2021, and the recovery in private consumption is expected to persist in 2022.
In 2020, France remained one of the top performing countries in the global Food and Agriculture industry and was the largest agriculture producer in the EU. Over half of France's total land area is dedicated to agriculture with 8% of agricultural land used for organic farming.
France was the fourth largest global organic packaged food market and the second largest organic packaged food market in the European Union (EU), after Germany, based on retail sales of US$4.7 billion in 2021. The organic category is anticipated to experience moderate growth by a compound annual growth rate (CAGR) of 8.3% as retail sales of packaged food increase to US$7.0 billion by 2026.
The top three organic packaged food categories in France, in terms of retail value sales in 2021, were organic dairy with values of US$1.2 billion (26.0% market share) increasing at a CAGR of 10.3% from US$749.6 million in 2016 , followed by organic bread valued at US$760.6 million (16.2% market share), representing an increase in CAGR of 8.4% from US$507.5 million in 2016 and organic chilled processed meat and seafood with values of US$491.5 million (10.4% market share) and increasing in CAGR by 14.0% from US$255.2 million in 2016.
Under the Canada-European Union Comprehensive Economic and Trade Agreement (CETA), Canadian producers of organic packaged food have preferential access and growth opportunities in the European Union (EU) market. In addition, the European Union - Canada Organic Equivalency Arrangement (EUCOEA) allows for Canadian products to be exported to the European Union (EU) countries as organic products, provided that the products meet organic food requirements and certified as organic in Canada.
Market overview
The French economy is recovering post pandemic due to extensive fiscal support, effective virus containment, rising investment and strong consumer spending. In September 2020, the government introduced a EUR$100 billion long-term recovery plan, 'France Relance', partially financed by the EU, to help mitigate the impacts of the pandemic on the economy and facilitate recovery. As a result, GDP per capita reached USD44,884 in France in 2021, and the recovery in private consumption is expected to persist in 2022. Inflation however, will continue, forecast to increase to 2.2% in 2022, largely due to rising prices of energy and raw materials. In terms of trade, France remains a net importer as exports increased by 19.4%, and imports of goods rose by 21.2% in 2021. (Euromonitor International, 2022)
In 2020, France remained one of the top performing countries in the global Food and Agriculture industry and was the largest agriculture producer in the EU. Over half of France's total land area is dedicated to agriculture with 8% of agricultural land used for organic farming. The main regions for organic farming are the Provence-Alpes-Côte-d'Azur (25% of region), Occitanie and Corsica (15% of the territory). (Business France Nordics 2020) The country receives government incentives and subsidies insured by the EU's Common Agricultural Policy (CAP) and intends to increase organic farming to 15% of total agriculture by 2022 and cut pesticide use by 50% by 2025. Plans to reduce EU CAP maintenance however, in favour of newly-converted organic farms, and the government's decision to support High Environmental Value farms that implement environmentally-friendly agricultural practices, threaten existing organic farmer retention and incentive. (Euromonitor International, 2022)
The French organic consumer tends to be those under thirty-five years of age however, all generations are interested in organic food. As noted in CIC AIDEXPORT, 47% of French consumers are eating organic food at least once a week, while 90% are occasional buyers. Consumers are choosing to purchase and eat organic food for health, quality, taste and environmental concerns. As such, their purchasing behaviour has been modified to incorporate the comparison of products and prices, the origin and quality of products and the promotion of short (local) supply channels. (CIC AIDEXPORT 2021).
The global market for organic packaged food has experienced positive growth with a moderate compound annual growth rate (CAGR) of 7.8% as retail value sales have increased from US$34.9 billion in 2016 to US$50.8 billion in 2021. The United States (U.S) was the largest global market for organic packaged food in 2021 with retail sales of US$21.3 billion (41.8% market share) representing a CAGR of 6.8% from US$15.3 billion in 2016, followed by Germany with retail sales valued at US$5.2 billion (10.2% market share) and a CAGR of 6.2% from US$3.8 billion in 2016, followed by China, with retail sales of US$4.7 billion (9.3% market share) in 2021, experiencing the largest CAGR of 13.2% (amongst top markets) as retail sales grew from US$2.6 billion in 2016.
Under the Canada-European Union Comprehensive Economic and Trade Agreement (CETA), Canadian producers of organic packaged food have preferential access and growth opportunities in the European Union (EU) market. In addition, the European Union - Canada Organic Equivalency Arrangement (EUCOEA) allows for Canadian products to be exported as organic products to the EU provided the product is certified under the Canadian Food Inspection Agency (CFIA) Canada Organic Regime. For more information, please, visit: export requirements and documentation under the EUCOEA and list of the CFIA accredited certification body in Canada.
| Country | 2016 | 2021 | CAGR % 2016-2021 | 2022 | 2026 | CAGR % 2021-2026 |
|---|---|---|---|---|---|---|
| Global total | 34,933.6 | 50,815.4 | 7.8 | 54,475.1 | 70,304.2 | 6.7 |
| United States | 15,285.4 | 21,260.5 | 6.8 | 22,850.2 | 29,021.4 | 6.4 |
| Germany | 3,838.7 | 5,176.7 | 6.2 | 5,412.3 | 6,322.0 | 4.1 |
| China | 2,550.0 | 4,732.5 | 13.2 | 5,234.5 | 7,525.1 | 9.7 |
| France (4) | 2,652.3 | 4,707.6 | 12.2 | 5,136.3 | 7,015.9 | 8.3 |
| Italy | 1,222.0 | 1,761.1 | 7.6 | 1,880.5 | 2,414.0 | 6.5 |
| United Kingdom | 1,392.1 | 1,749.2 | 4.7 | 1,810.7 | 2,124.1 | 4.0 |
| Canada (7) | 867.5 | 1,237.7 | 7.4 | 1,360.7 | 1,857.9 | 8.5 |
| Netherlands | 760.4 | 1,100.3 | 7.7 | 1,159.7 | 1,501.7 | 6.4 |
| Denmark | 699.7 | 1,063.7 | 8.7 | 1,106.4 | 1,320.5 | 4.4 |
| Sweden | 673.3 | 905.0 | 6.1 | 943.8 | 1,168.0 | 5.2 |
|
Source: Euromonitor International, 2022 *CAGR: Compound Annual Growth Rate Historic data: 2016 to 2021 Forecast data: 2022 to 2026 |
||||||
Health and wellness packaged food
The presence and experiences of the recent pandemic have increased the levels of health-consciousness and reinforced the commitment to adopt healthier lifestyles amongst the French consumer. Relatedly, the pandemic has also strengthened the consumers' desire to consume local and 'Made in France' products, which to some extent, is also favouring organic beverages and food products with a local origin (Euromonitor International, 2022).
Retail sales of health and wellness packaged food in France experienced a CAGR of 3.6% from US$13.0 billion in 2016 to US$15.6 billion in 2021. The market is expected to develop by a CAGR of 4.3% to attain retail sales of US$19.3 billion by 2026 as more French consumers pay greater attention to the role of nutrition and daily diets in the maintenance of their physical and mental wellbeing (Euromonitor International, 2022).
Organic packaged food was the largest health and wellness product category in absolute value terms, with retail sales of US$4.7 billion (30.2% market share) in 2021, increasing significantly in CAGR by 12.2% from retail sales of US$2.7 billion in 2016.
The organic category has held a strong presence within the French market and is supported by growing eco-consciousness as consumers evaluate ways to be more environmentally friendly while reducing their impact on the environment. The category or 'organic trend' is focused on personal health, as most organic products contain no, or a limited amount of pesticides (Euromonitor International, 2022).
Euromonitor International notes also that the continual shift towards more holistic and preventive approaches to health and wellness are expected to encourage growing interest and expansion of the organic segment. The organic category is anticipated to experience moderate growth by a CAGR of 8.3% as retail sales of packaged food increase to US$7.0 billion by 2026. In comparison, Naturally Healthy (NH) packaged food was the second largest product category in France achieving retail sales of US$4.2 billion (27.0% market share) in 2021, while Free From packaged food experienced the second largest CAGR of 10.7% from 2016 to 2021 of the health and wellness categories, and is expected to increase in CAGR by 7.6% in the forecast period. Further, Better for You and Fortified/Functional contracted in CAGR during the historic period and are anticipated to recover in the forecast period.
| Category | 2016 | 2021 | CAGR % 2016-2021 | 2022 | 2026 | CAGR % 2021-2026 |
|---|---|---|---|---|---|---|
| Health and wellness Packaged Food (Total) | 13,048.2 | 15,582.2 | 3.6 | 16,193.7 | 19,272.9 | 4.3 |
| Better For You | 2,443.3 | 2,056.6 | −3.4 | 2,043.0 | 2,074.6 | 0.2 |
| Fortified/ Functional | 3,539.4 | 3,363.0 | −1.0 | 3,386.7 | 3,514.5 | 0.9 |
| Free From | 747.8 | 1,245.4 | 10.7 | 1,343.4 | 1,797.9 | 7.6 |
| Naturally Healthy | 3,665.5 | 4,209.5 | 2.8 | 4,284.2 | 4,870.0 | 3.0 |
| Organic | 2,652.3 | 4,707.6 | 12.2 | 5,136.3 | 7,015.9 | 8.3 |
|
Source: Euromonitor International, 2022 *CAGR: Compound Annual Growth Rate Historical data: 2016 to 2021 Forecast data: 2022 to 2026 |
||||||
Market size
The organic packaged food market in France was valued at US$4.7 billion in 2021. During the 2016-2021 period, this market grew at a substantial CAGR of 12.2% from US$2.7 billion in 2016, with slightly higher growth between 2019-2020 at 12.4% with the onset of the pandemic. The French organic packaged food market strengthened 8.3% between 2020 and 2021 as retail sales increased from US$4.3 billion in 2020. The organic packaged food market is forecast to expand by 9.1%, attaining US$5.1 billion by 2022. Of note, franceinfo (in French only) reports that the French organic market has recently experienced an unprecedented decline in the demand for organic products due to a reduction in the French consumer's overall food budget and a loss in confidence, for some consumers, in the organic label (according to the analysis of the NGO Future Generations, 45.9% of all samples, organic and non-organic, reveal pesticide residues above the limit of quantification). 20minutes Publicité (in French only) proposes that the contraction in the market is expected to continue this year due to inflation.
The top three organic packaged food categories in France, in terms of retail value sales in 2021, were organic dairy with values of US$1.2 billion (26.0% market share) increasing at a CAGR of 10.3% from US$749.6 million in 2016 , followed by organic bread valued at US$760.6 million (16.2% market share), representing an increase in CAGR of 8.4% from US$507.5 million in 2016 and organic chilled processed meat and seafood with values of US$491.5 million (10.4% market share) and increasing in CAGR by 14.0% from US$255.2 million in 2016. Of interest, organic ice cream performed well within the historic period as retail sales of the product experienced the largest increase in CAGR (31.5%) from US$3.1 million in 2016 to US$12.2 million in 2021.
In terms of the organic packaged food market share representation within its corresponding packaged food category, the organic packaged baby food product category accounted for a higher market share representation within its corresponding packaged baby food category when compared to other organic and corresponding packaged food categories. For example, organic baby food represented 22.6% of the total baby food retail sales in France in 2021, whereas other organic categories accounted for less than 8.0% of their corresponding packaged food categories, with the exception of organic edible oil (19.8% of the total edible oil sales), organic breakfast cereals (18.5% of the total packaged breakfast cereal sales), organic spreads (17.0% of the total spread sales) and organic soup (16.1% of the total soup sales) in France, in 2021. Similar trends are expected to continue during the forecast period, while some of the organic categories, such as organic baby food, organic breakfast cereals, organic edible oils and organic soups could represent higher market share representation.
During the forecast period, growth in the organic packaged food category is expected to be strongly positive with a CAGR of 8.3% as retail sales reach US$7.0 billion by 2026. Relatedly, all organic packaged food product categories are expected to experience positive increases in CAGR's, albeit at lower rates, in the forecast period. Organic ice cream and organic soup in particular, are expected to increase in CAGR by 10.3% achieving US$19.9 million and US$171.5 million respectively by 2026, while organic baby food is also expected to perform well attaining an increase in CAGR of 10.0% with values of US$505.5 million by 2026.
| Category | 2016 | 2017 | 2018 | 2019 | 2020 | 2021 |
|---|---|---|---|---|---|---|
| Organic Packaged Food Total | 2,652.3 | 2,996.3 | 3,387.4 | 3,869.4 | 4,347.7 | 4,707.6 |
| Baby Food | 117.7 | 162.2 | 201.3 | 242.9 | 277.7 | 314.3 |
| Bread | 507.5 | 542.5 | 586.4 | 656.8 | 709.3 | 760.6 |
| Breakfast Cereals | 82.6 | 110.2 | 122.5 | 135.5 | 151.8 | 162.9 |
| Chilled Processed Meat and Seafood | 255.2 | 302.5 | 350.2 | 397.2 | 447.7 | 491.5 |
| Confectionery | 67.1 | 88.1 | 109.4 | 134.2 | 155.8 | 168.2 |
| Dairy | 749.6 | 792.8 | 884.0 | 1,016.9 | 1,128.5 | 1,225.8 |
| Edible Oil | 131.5 | 147.4 | 166.4 | 186.7 | 228.1 | 253.8 |
| Frozen Meat, Seafood, Fruit and Vegetables | 50.3 | 58.9 | 66.7 | 74.4 | 83.1 | 91.8 |
| Ice Cream | 3.1 | 6.5 | 7.8 | 9.0 | 10.9 | 12.2 |
| Ready Meals | 55.7 | 62.4 | 68.9 | 75.1 | 84.6 | 90.4 |
| Rice, Pasta and Noodles | 73.6 | 85.6 | 99.3 | 114.0 | 131.2 | 129.0 |
| Sauces, Dressings and Condiments | 29.7 | 33.5 | 41.4 | 49.3 | 60.4 | 63.8 |
| Savoury Snacks | 54.7 | 63.3 | 71.7 | 79.6 | 90.4 | 97.3 |
| Shelf Stable Meat, Seafood, Fruit and Vegetables | 78.4 | 88.1 | 98.5 | 109.0 | 121.1 | 133.5 |
| Soup | 49.1 | 55.9 | 67.2 | 80.2 | 91.6 | 105.2 |
| Spreads | 192.0 | 222.7 | 253.1 | 278.1 | 312.6 | 327.2 |
| Sweet Biscuits, Snack Bars and Fruit Snacks | 154.6 | 173.9 | 192.6 | 230.5 | 262.7 | 280.1 |
| Source: Euromonitor International, 2022 | ||||||
| Category | Annual growth % 2020-2021 | CAGR* % 2016-2021 | Total growth % 2016-2021 |
|---|---|---|---|
| Organic Packaged Food Total | 8.3 | 12.2 | 77.5 |
| Baby Food | 13.2 | 21.7 | 167.0 |
| Bread | 7.2 | 8.4 | 49.9 |
| Breakfast Cereals | 7.3 | 14.5 | 97.2 |
| Chilled Processed Meat and Seafood | 9.8 | 14.0 | 92.6 |
| Confectionery | 8.0 | 20.2 | 150.7 |
| Dairy | 8.6 | 10.3 | 63.5 |
| Edible Oil | 11.3 | 14.1 | 93.0 |
| Frozen Meat, Seafood, Fruit and Vegetables | 10.5 | 12.8 | 82.5 |
| Ice Cream | 11.9 | 31.5 | 293.5 |
| Ready Meals | 6.9 | 10.2 | 62.3 |
| Rice, Pasta and Noodles | −1.7 | 11.9 | 75.3 |
| Sauces, Dressings and Condiments | 5.6 | 16.5 | 114.8 |
| Savoury Snacks | 7.6 | 12.2 | 77.9 |
| Shelf Stable Meat, Seafood, Fruit and Vegetables | 10.2 | 11.2 | 70.3 |
| Soup | 14.8 | 16.5 | 114.3 |
| Spreads | 4.7 | 11.3 | 70.4 |
| Sweet Biscuits, Snack Bars and Fruit Snacks | 6.6 | 12.6 | 81.2 |
|
Source: Euromonitor International, 2022 *CAGR: Compound Annual Growth Rate |
|||
| Category | Packaged food | Organic packaged food | Share of organic packaged food (%) |
|---|---|---|---|
| Baby Food | 1,388.3 | 314.3 | 22.6 |
| Bread | 9,873.2 | 760.6 | 7.7 |
| Breakfast Cereals | 879.4 | 162.9 | 18.5 |
| Chilled Processed Meat and Seafood | 13,031.0 | 491.5 | 3.8 |
| Confectionery | 7,882.2 | 168.2 | 2.1 |
| Dairy | 21,948.70 | 1,225.8 | 5.6 |
| Edible Oil | 1,284.1 | 253.8 | 19.8 |
| Frozen Meat, Seafood, Fruit and Vegetables | 2,838.9 | 91.8 | 3.2 |
| Ice Cream | 2,270.9 | 12.2 | 0.5 |
| Ready Meals | 5,876.6 | 90.4 | 1.5 |
| Rice, Pasta and Noodles | 2,364.2 | 129.0 | 5.5 |
| Sauces, Dressings and Condiments | 3,489.6 | 63.8 | 1.8 |
| Savoury Snacks | 3,684.9 | 97.3 | 2.6 |
| Shelf Stable Meat, Seafood, Fruit and Vegetables | 4,320.7 | 133.5 | 3.1 |
| Soup | 655.0 | 105.2 | 16.1 |
| Spreads | 1,922.6 | 327.2 | 17.0 |
| Sweet Biscuits, Snack Bars and Fruit Snacks | 3,565.4 | 280.1 | 7.9 |
| Source: Euromonitor International, 2022 | |||
| Category | 2022 | 2023 | 2024 | 2025 | 2026 |
|---|---|---|---|---|---|
| Organic Packaged Food Total | 5,136.3 | 5,580.7 | 6,036.4 | 6,517.8 | 7,015.9 |
| Baby Food | 353.2 | 391.8 | 429.4 | 466.2 | 505.5 |
| Bread | 823.1 | 889.5 | 959.4 | 1,031.4 | 1,102.7 |
| Breakfast Cereals | 171.5 | 181.4 | 191.9 | 202.8 | 214.1 |
| Chilled Processed Meat and Seafood | 538.0 | 586.2 | 632.9 | 687.1 | 744.7 |
| Confectionery | 182.4 | 197.2 | 210.9 | 225.2 | 239.7 |
| Dairy | 1,345.0 | 1,465.9 | 1,590.6 | 1,724.5 | 1,865.8 |
| Edible Oil | 278.1 | 302.2 | 328.6 | 356.4 | 385.1 |
| Frozen Meat, Seafood, Fruit and Vegetables | 101.2 | 111.1 | 121.5 | 133.3 | 144.9 |
| Ice Cream | 13.6 | 15.1 | 16.6 | 18.2 | 19.9 |
| Ready Meals | 96.4 | 102.0 | 107.8 | 113.8 | 120.0 |
| Rice, Pasta and Noodles | 139.9 | 154.8 | 170.7 | 187.5 | 204.8 |
| Sauces, Dressings and Condiments | 67.5 | 71.4 | 75.4 | 79.3 | 83.3 |
| Savoury Snacks | 105.4 | 114.5 | 124.4 | 135.2 | 147.1 |
| Shelf Stable Meat, Seafood, Fruit and Vegetables | 146.5 | 160.4 | 175.0 | 191.4 | 208.0 |
| Soup | 119.9 | 134.6 | 148.3 | 160.3 | 171.5 |
| Spreads | 350.7 | 375.0 | 399.4 | 424.3 | 450.0 |
| Sweet Biscuits, Snack Bars and Fruit Snacks | 303.7 | 327.7 | 353.4 | 380.8 | 408.8 |
| Source: Euromonitor International, 2022 | |||||
| Category | Annual growth % 2021-2022 | CAGR* % 2021-2026 | Total growth % 2021-2026 |
|---|---|---|---|
| Organic Packaged Food Total | 9.1 | 8.3 | 49.0 |
| Baby Food | 12.4 | 10.0 | 60.8 |
| Bread | 8.2 | 7.7 | 45.0 |
| Breakfast Cereals | 5.3 | 5.6 | 31.4 |
| Chilled Processed Meat and Seafood | 9.5 | 8.7 | 51.5 |
| Confectionery | 8.4 | 7.3 | 42.5 |
| Dairy | 9.7 | 8.8 | 52.2 |
| Edible Oil | 9.6 | 8.7 | 51.7 |
| Frozen Meat, Seafood, Fruit and Vegetables | 10.2 | 9.6 | 57.8 |
| Ice Cream | 11.5 | 10.3 | 63.1 |
| Ready Meals | 6.6 | 5.8 | 32.7 |
| Rice, Pasta and Noodles | 8.4 | 9.7 | 58.8 |
| Sauces, Dressings and Condiments | 5.8 | 5.5 | 30.6 |
| Savoury Snacks | 8.3 | 8.6 | 51.2 |
| Shelf Stable Meat, Seafood, Fruit and Vegetables | 9.7 | 9.3 | 55.8 |
| Soup | 14.0 | 10.3 | 63.0 |
| Spreads | 7.2 | 6.6 | 37.5 |
| Sweet Biscuits, Snack Bars and Fruit Snacks | 8.4 | 7.9 | 45.9 |
|
Source: Euromonitor International, 2022 *CAGR: Compound Annual Growth Rate |
|||
Competitive landscape
The French organic packaged food market remained a highly fragmented industry throughout 2016 to 2021, with no individual company recording a double-digit market share. Ecotone (Brand name; Bjorg, Danival, Bonneterre and Alter Ego) was the largest organic packaged food company in France with retail sales of US$273.5 million (5.8% market share), while Lactalis, Groupe (Brand name; Lactel, Président, Evelin and Primevère), the second largest organic packaged food company, attained US$168.9 million (3.6% market share) in 2021.
Within the organic packaged food market, both private label and branded products have seen a growing number of new launches making it easier for consumers to choose between organic and non-organic versions of their favourite packaged foodstuffs. French made or produced organic foods however, are the most popular amongst consumers who trust the French organic certification process. Of note, it is private label organic products that are growing in prevalence, expanding their availability across a range of consumer income brackets enhancing competition with branded products (Euromonitor International, 2022).
Private label companies continue to show a strong presence in the organic packaged food market with retail sales of US$1.1 billion (24.1% market share) in 2021, increasing their total market share slightly since 2016.
According to Euromonitor International (2022), the private label segment's growth will be further supported by the decline in consumer spending power resulting from the financial impacts of the pandemic. As such, higher-priced and imported organic products will likely struggle to compete within this changing landscape, although there may be some degree of polarisation seen within certain categories. Of note, artisanal companies represented a measureable 12.9% of France's organic packaged food market with retail sales of US$607.7 million in 2021.
| Company | Retail sales (US$ millions) | Market share (%) |
|---|---|---|
| Total | 4,707.6 | 100.0 |
| Ecotone | 273.5 | 5.8 |
| Lactalis, Groupe | 168.9 | 3.6 |
| Triballat-Noyal SAS | 128.2 | 2.7 |
| Danone, Groupe | 103.3 | 2.2 |
| Fleury Michon, Groupe | 90.7 | 1.9 |
| Groupe Léa Nature | 90.4 | 1.9 |
| Vitagermine SAS | 80.0 | 1.7 |
| Hipp GmbH & Co Vertrieb KG | 65.5 | 1.4 |
| Sodiaal SA (Société de Diffusion Internationale Agro-alimentaire) | 65.2 | 1.4 |
| Groupe Norac SA | 63.0 | 1.3 |
| Private Label | 1,134.5 | 24.1 |
| Artisanal | 607.7 | 12.9 |
| Others | 899.0 | 19.1 |
| Source: Euromonitor International, 2022 | ||
Distribution channels
The majority of France's organic packaged food market is distributed through store-based retailing versus non-store retailing. Store-based retailing for organic packaged food accounted for a 93.2% market share in 2021, declining slightly from 93.7% held in 2016, while non-store retailing, e-commerce in particular, increased its market share representation to 6.2% in 2021, growing from 5.6% held in 2016. Further, within store-based retailing, hypermarkets and supermarkets were the predominant distribution channels for organic packaged food representing market shares of 35.6% and 23.6% respectively, in 2021. Of note, franceinfo reports that supermarkets are experiencing the most declines in organic sales in comparison to short supply chains that are performing well, while direct sales from producers and craftsmen are growing by 8%. Further, Trade Commissioners from Global Affairs Canada, note that various organic processors have acknowledged a 15% decline in product sales offered through specialized stores.
| Outlet Type | 2016 | 2021 | ||
|---|---|---|---|---|
| Actual | Share (%) | Actual | Share (%) | |
| Total | 2,652.3 | 100.0 | 4,707.6 | 100.0 |
| Store-Based Retailing | 2,485.5 | 93.7 | 4,388.5 | 93.2 |
| Grocery Retailers | 2,482.9 | 93.6 | 4,383.8 | 93.1 |
| Modern Grocery Retailers | 1,493.5 | 56.3 | 3,025.6 | 64.3 |
| Convenience Stores | 82.8 | 3.1 | 154.9 | 3.3 |
| Discounters | 31.8 | 1.2 | 50.4 | 1.1 |
| Forecourt Retailers | 20.2 | 0.8 | 32.0 | 0.7 |
| Hypermarkets | 802.8 | 30.3 | 1,678.2 | 35.6 |
| Supermarkets | 555.9 | 21.0 | 1,110.2 | 23.6 |
| Traditional Grocery Retailers | 989.3 | 37.3 | 1,358.2 | 28.9 |
| Independent Small Grocers | 50.4 | 1.9 | 73.0 | 1.6 |
| Other Grocery Retailers | 938.9 | 35.4 | 1,285.2 | 27.3 |
| Non-Store Retailing | 166.8 | 6.3 | 319.2 | 6.8 |
| Vending | 18.0 | 0.7 | 27.3 | 0.6 |
| E-Commerce | 148.8 | 5.6 | 291.9 | 6.2 |
| Source: Euromonitor International, 2022 | ||||
Subsector Analysis
Organic Baby Food
The organic baby food market in France expanded by a substantial CAGR of 21.7% during the 2016-2021 period, recording total retail sales of CA$314.3 million in 2021 as many parents now demand organic products as standard, resulting in the continual decline in non-organic products in the market (Euromonitor International, 2022). In addition, there has been a shift to home cooking for babies as a result of more parents being at home with their young children during the pandemic causing parents to become more conscious of what goes into their babies' food. Consequently, many of these parents will only use organic foods for their babies if they are buying ready made products (Euromonitor International, 2022).
The French organic baby food market expanded by 13.2% between 2020 and 2021 as retail sales increased from US$277.7 million in 2020 and is expected to increase by a further 12.4%, attaining US$353.2 million by 2022. In absolute value terms, prepared baby food was the largest sub-category, accounting for retail sales of US$204.1 million (64.9% market share of organic baby food) in 2021. Organic milk formula saw the largest growth in CAGR by 25.3% between 2016 and 2021. Organic baby food is set to experience moderate growth at a CAGR of 10.0% during the forecast period, with total retail sales of US$505.5 million by 2026.
With respect to competition, Vitagermine SAS (Brand name: Babybio) maintained its leadership in organic baby food throughout 2016 and 2021. In 2021, Vitagermine SAS accounted for 22.7% of the total organic baby food market in France. Other major players were Hipp GmbH & Co Vertrieb KG (Brand name: Hipp ) with a market share of 20.8% in 2021. Private label organic baby food companies had retail sales of US$14.5 million in 2021, representing a 4.6% market share representation.
| Category | 2016 | 2017 | 2018 | 2019 | 2020 | 2021 |
|---|---|---|---|---|---|---|
| Organic Baby Food Total | 117.7 | 162.2 | 201.3 | 242.9 | 277.7 | 314.3 |
| Milk Formula | 26.4 | 46.4 | 58.1 | 68.8 | 75.4 | 81.6 |
| Dried Baby Food | 10.0 | 11.5 | 13.2 | 15.6 | 16.5 | 17.7 |
| Prepared Baby Food | 77.0 | 98.8 | 123.3 | 150.5 | 176.2 | 204.1 |
| Other Baby Food | 4.4 | 5.5 | 6.8 | 8.1 | 9.5 | 10.9 |
| Source: Euromonitor International, 2022 | ||||||
| Category | Annual growth % 2020-2021 | CAGR* % 2016-2021 | Total growth % 2016-2021 |
|---|---|---|---|
| Organic Baby Food Total | 13.2 | 21.7 | 167.0 |
| Milk Formula | 8.2 | 25.3 | 209.1 |
| Dried Baby Food | 7.3 | 12.1 | 77.0 |
| Prepared Baby Food | 15.8 | 21.5 | 165.1 |
| Other Baby Food | 14.7 | 19.9 | 147.7 |
|
Source: Euromonitor International, 2022 *CAGR: Compound Annual Growth Rate |
|||
| Company | Retail sales (US$ millions) | Market share (%) |
|---|---|---|
| Total | 314.3 | 100.0 |
| Vitagermine SAS | 71.3 | 22.7 |
| Hipp GmbH & Co Vertrieb KG | 65.5 | 20.8 |
| H&H Group | 50.9 | 16.2 |
| Danone, Groupe | 16.5 | 5.2 |
| Yooji SA | 13.9 | 4.4 |
| Private Label | 14.5 | 4.6 |
| Others | 57.9 | 18.4 |
| Source: Euromonitor International, 2022 | ||
| Category | 2022 | 2023 | 2024 | 2025 | 2026 |
|---|---|---|---|---|---|
| Organic Baby Food Total | 353.2 | 391.8 | 429.4 | 466.2 | 505.5 |
| Milk Formula | 88.9 | 95.1 | 99.5 | 102.7 | 107.0 |
| Dried Baby Food | 19.6 | 21.7 | 23.8 | 26.2 | 28.8 |
| Prepared Baby Food | 232.2 | 261.0 | 290.4 | 320.0 | 350.8 |
| Other Baby Food | 12.5 | 14.0 | 15.7 | 17.3 | 18.9 |
| Source: Euromonitor International, 2022 | |||||
| Category | Annual growth % 2021-2022 | CAGR* 2021-2026 | Total Growth 2021-2026 |
|---|---|---|---|
| Organic Baby Food Total | 12.4 | 10.0 | 60.8 |
| Milk Formula | 8.9 | 5.6 | 31.1 |
| Dried Baby Food | 10.7 | 10.2 | 62.7 |
| Prepared Baby Food | 13.8 | 11.4 | 71.9 |
| Other Baby Food | 14.7 | 11.6 | 73.4 |
|
Source: Euromonitor International, 2022 *CAGR: Compound Annual Growth Rate |
|||
Organic bread and breakfast cereals
The French organic bread market was valued at US$760.6 million in 2021, with sales led predominantly by the artisanal segment (US$517.9 million), which accounted for 68.1% of the organic bread market. Groupe Norac SA (Brand name: La Boulangère), Ecotone (Brand name: Bonneterre and Bjorg)) and Biofournil SA (Brand name: Biofournil) were the three leading companies, accounting for 8.3%, 6.7% and 4.5% of retail sales respectively, in 2021. During the 2016-2021 period, organic bread grew at moderate CAGR of 8.4% from US$507.5 million in 2016, increasing in growth by 7.2% between 2020 and 2021. The market is forecast to remain positive with a CAGR of 7.7% as retail sales reach US$1.1 billion by 2026.
The organic breakfast cereal market experienced a large CAGR of 14.5% during the historic period, with retail sales of US$162.9 million in 2021. Private label retail sales attained US$34.4 million, representing a 21.1% market share in 2021. Organic Stories SAS (Brand names: Crosti, Favrichon and Charles Vignon) and Cereal Partners Worldwide SA (Brand names: Chocapic, Fitness, Lion and Nesquik) were the two largest organic breakfast cereal companies in 2021 with a combined market share of 30.4%. The market is forecast to experience an increase in CAGR of 5.6%, reaching US$214.1 million in retail sales by 2026.
| Category | 2016 | 2017 | 2018 | 2019 | 2020 | 2021 |
|---|---|---|---|---|---|---|
| Bread | 507.5 | 542.5 | 586.4 | 656.8 | 709.3 | 760.6 |
| Breakfast Cereals | 82.6 | 110.2 | 122.5 | 135.5 | 151.8 | 162.9 |
| Source: Euromonitor International, 2022 | ||||||
| Category | Annual growth % 2020-2021 | CAGR* % 2016-2021 | Total growth % 2016-2021 |
|---|---|---|---|
| Bread | 7.2 | 8.4 | 49.9 |
| Breakfast Cereals | 7.3 | 14.5 | 97.2 |
|
Source: Euromonitor International, 2022 *CAGR: Compound Annual Growth Rate |
|||
| Company | Retail sales (US$ millions) | Market share (%) |
|---|---|---|
| Total | 760.6 | 100.0 |
| Groupe Norac SA | 63.0 | 8.3 |
| Ecotone | 50.9 | 6.7 |
| Biofournil SA | 34.5 | 4.5 |
| Otsuka Holdings Co Ltd | 21.0 | 2.8 |
| Ekibio, Groupe | 18.9 | 2.5 |
| Artisanal | 517.9 | 68.1 |
| Private Label | 46.3 | 6.1 |
| Others | 8.1 | 1.1 |
| Source: Euromonitor International, 2022 | ||
| Company | Retail sales (US$ millions) | Market share (%) |
|---|---|---|
| Total | 162.9 | 100.0 |
| Organic Stories SAS | 30.0 | 18.4 |
| Cereal Partners Worldwide SA | 19.5 | 12.0 |
| Associated British Foods Plc | 13.0 | 8.0 |
| Ecotone | 12.9 | 7.9 |
| Otsuka Holdings Co Ltd | 5.4 | 3.3 |
| Triballat-Noyal SAS | 5.2 | 3.2 |
| Private Label | 34.4 | 21.1 |
| Others | 40.1 | 24.6 |
| Source: Euromonitor International, 2022 | ||
| Category | 2022 | 2023 | 2024 | 2025 | 2026 |
|---|---|---|---|---|---|
| Bread | 823.1 | 889.5 | 959.4 | 1,031.4 | 1,102.7 |
| Breakfast Cereals | 171.5 | 181.4 | 191.9 | 202.8 | 214.1 |
| Source: Euromonitor International, 2022 | |||||
| Category | Annual growth % 2021-2022 | CAGR* % 2021-2026 | Total growth % 2021-2026 |
|---|---|---|---|
| Bread | 8.2 | 7.7 | 45.0 |
| Breakfast Cereals | 5.3 | 5.6 | 31.4 |
|
Source: Euromonitor International, 2022 *CAGR: Compound Annual Growth Rate |
|||
Organic cooking ingredients and meals
The French organic edible oil market grew at a measureable CAGR of 14.1% during the 2016-2021 period, with retail sales of US$253.8 million in 2021. Organic olive oil (both private label and major brands) in particular, experienced the largest CAGR (16.8%) in the organic edible oil segment due in part, to the increase in consumption during pandemic lockdown periods, as retail sales rose to US$190.5 million by 2021. The organic edible oil sector is forecast to remain positive with a CAGR of 8.7% as retail sales reach US$385.1 million by 2026. Avril Group (Brand name : Puget and Soleou) led sales in the French organic edible oil market with a market share of 15.4%, followed by Deoleo SA (Brand name: Carapelli) with a market share of 10.1% and Huilerie Cauvin SA (Brand name: Cauvin) with a market share of 8.3% in 2021.
Organic ready meals experienced continued growth at a CAGR of 10.2% during the historic period attaining retail sales of US$90.4 million in 2021. The market is expected to expand at a CAGR of 5.8% between 2021 and 2026, reaching retail sales of US$120.0 million by 2026. Ecotone (Brand name: Danival, Bjorg and Bonneterre) and Groupe Léa Nature (Brand name: Jardin Bio ) were the leading organic ready meal companies in France, accounting for a combined 48.4% of the organic ready meal sales in 2021.
The organic sauce, dressing and condiment market grew substantially at a CAGR of 16.5% during the 2016-2021 period, with total retail sales valued at US$63.8 million in 2021. This sector is expected to see a moderate growth at a CAGR of 5.5% during the forecast period and to be valued at US$83.3 million by 2026. Ecotone (Brand name: Bjorg, Bonneterre and Danival) and Otsuka Holdings Co Ltd (Brand name: Céréal) were the two leading companies, representing 26.0% and 6.4% of this market, respectively, in 2021.
The organic soup sub-category increased significantly by a CAGR of 16.5% during the historic period, reaching retail sales of US$105.2 million in 2021. The French organic soup market grew 14.8% between 2020 and 2021, and is forecast to expand by a further 14.0%, attaining US$119.9 million by 2022. The market is expected to see continued growth at a CAGR of 10.3% from 2021 to 2026, reaching retail sales of US$171.5 million by 2026. The organic soup market was dominated by GB Foods SA, (Brand name: Liebig) which accounted for 23.2% of the retail value sales, followed by Destombes SARL (Brand name: La Ferme d'Anchin), which accounted for 15.0% of retail sales, and Sill Entreprises SA, which accounted for 14.8% of retail sales in 2021.
The organic spreads market experienced relatively large growth at a CAGR of 11.3% from 2016 to 2021, with retail sales of US$327.2 million in 2021. This market is expected to see lower growth at a CAGR of 6.6% during the forecast period anticipating retail sales of US$450.0 million by 2026. The organic honey segment in particular, also experienced a notable CAGR of 14.4% in the historic period, and is anticipated to experience a positive increase in growth, albeit at a lower rate of 8.6%, in the forecast period. Rigoni di Asiago (Brand name: Nocciolata, Firdifrutta and Mielbio) was the leading spread company in France with a market share of 18.2%, followed by Bernard Michaud SA (Brand name: Lune de Miel) with a market share of 13.9% in 2021. Private labels continued their strong presence with a 30.8% market share of organic spread retail sales.
| Category | 2016 | 2017 | 2018 | 2019 | 2020 | 2021 |
|---|---|---|---|---|---|---|
| Organic Edible Oil Total | 131.5 | 147.4 | 166.4 | 186.7 | 228.1 | 253.8 |
| Organic Olive Oil | 87.8 | 101.0 | 116.3 | 132.5 | 165.6 | 190.5 |
| Organic Vegetable and Seed Oil | 43.7 | 46.4 | 50.1 | 54.2 | 62.5 | 63.3 |
| Organic Ready Meals | 55.7 | 62.4 | 68.9 | 75.1 | 84.6 | 90.4 |
| Organic Sauces, Dressings and Condiments | 29.7 | 33.5 | 41.4 | 49.3 | 60.4 | 63.8 |
| Organic Soup | 49.1 | 55.9 | 67.2 | 80.2 | 91.6 | 105.2 |
| Organic Spreads Total | 192.0 | 222.7 | 253.1 | 278.1 | 312.6 | 327.2 |
| Organic Spreads excl Honey | 130.1 | 147.2 | 165.0 | 179.1 | 201.4 | 206.1 |
| Organic Honey | 61.9 | 75.4 | 88.0 | 99.0 | 111.2 | 121.1 |
| Source: Euromonitor International, 2022 | ||||||
| Category | Annual growth % 2020-2021 | CAGR* % 2016-2021 | Total growth % 2016-2021 |
|---|---|---|---|
| Organic Edible Oil Total | 11.3 | 14.1 | 93.0 |
| Organic Olive Oil | 15.0 | 16.8 | 117.0 |
| Organic Vegetable and Seed Oil | 1.3 | 7.7 | 44.9 |
| Organic Ready Meals | 6.9 | 10.2 | 62.3 |
| Organic Sauces, Dressings and Condiments | 5.6 | 16.5 | 114.8 |
| Organic Soup | 14.8 | 16.5 | 114.3 |
| Organic Spreads Total | 4.7 | 11.3 | 70.4 |
| Organic Spreads excl Honey | 2.3 | 9.6 | 58.4 |
| Organic Honey | 8.9 | 14.4 | 95.6 |
|
Source: Euromonitor International, 2022 *CAGR: Compound Annual Growth Rate |
|||
| Company | Retail sales (US$ millions) | Market share (%) |
|---|---|---|
| Total | 253.8 | 100.0 |
| Avril Group | 39.0 | 15.4 |
| Deoleo SA | 25.7 | 10.1 |
| Huilerie Cauvin SA | 21.1 | 8.3 |
| CHO Group | 17.1 | 6.8 |
| Reitzel SA | 9.4 | 3.7 |
| Private Label | 54.5 | 21.5 |
| Others | 63.2 | 24.9 |
| Source: Euromonitor International, 2022 | ||
| Company | Retail sales (US$ millions) | Market share (%) |
|---|---|---|
| Total | 90.4 | 100.0 |
| Ecotone | 22.6 | 25.0 |
| Groupe Léa Nature | 21.2 | 23.4 |
| Fleury Michon, Groupe | 11.9 | 13.1 |
| Otsuka Holdings Co Ltd | 8.2 | 9.1 |
| Private Label | 13.7 | 15.1 |
| Others | 12.9 | 14.2 |
| Source: Euromonitor International, 2022 | ||
| Company | Retail sales (US$ millions) | Market share (%) |
|---|---|---|
| Total | 63.8 | 100.0 |
| Ecotone | 16.6 | 26.0 |
| Otsuka Holdings Co Ltd | 4.1 | 6.4 |
| Groupe Léa Nature | 2.7 | 4.2 |
| Kraft Heinz Co | 2.4 | 3.8 |
| Barilla Holding SpA | 2.4 | 3.7 |
| Private Label | 13.6 | 21.4 |
| Others | 15.4 | 24.2 |
| Source: Euromonitor International, 2022 | ||
| Company | Retail sales (US$ millions) | Market share (%) |
|---|---|---|
| Total | 105.2 | 100.0 |
| GB Foods SA, The | 24.4 | 23.2 |
| Destombes SARL | 15.8 | 15.0 |
| Sill Entreprises SA | 15.5 | 14.8 |
| Unilever Group | 15.1 | 14.4 |
| Ecotone | 5.8 | 5.5 |
| Private Label | 10.7 | 10.2 |
| Others | 15.5 | 14.7 |
| Source: Euromonitor International, 2022 | ||
| Company | Retail sales (US$ millions) | Market share (%) |
|---|---|---|
| Total | 327.2 | 100.0 |
| Rigoni di Asiago Srl | 59.7 | 18.2 |
| Bernard Michaud SA | 45.6 | 13.9 |
| Ecotone | 37.0 | 11.3 |
| Groupe Léa Nature | 21.6 | 6.6 |
| Confiturerie & Confiserie D'Andresy SA | 13.2 | 4.0 |
| Private Label | 100.6 | 30.8 |
| Others | 24.6 | 7.5 |
| Source: Euromonitor International, 2022 | ||
| Category | 2022 | 2023 | 2024 | 2025 | 2026 |
|---|---|---|---|---|---|
| Organic Edible Oil Total | 278.1 | 302.2 | 328.6 | 356.4 | 385.1 |
| Organic Olive Oil | 212.2 | 232.7 | 255.1 | 278.6 | 302.6 |
| Organic Vegetable and Seed Oil | 65.9 | 69.5 | 73.5 | 77.8 | 82.5 |
| Organic Ready Meals | 96.4 | 102.0 | 107.8 | 113.8 | 120.0 |
| Organic Sauces, Dressings and Condiments | 67.5 | 71.4 | 75.4 | 79.3 | 83.3 |
| Organic Soup | 119.9 | 134.6 | 148.3 | 160.3 | 171.5 |
| Organic Spreads Total | 350.7 | 375.0 | 399.4 | 424.3 | 450.0 |
| Organic Spreads excl Honey | 217.5 | 229.5 | 241.6 | 254.0 | 266.9 |
| Organic Honey | 133.2 | 145.4 | 157.8 | 170.2 | 183.1 |
| Source: Euromonitor International, 2022 | |||||
| Category | Annual growth % 2021-2022 | CAGR* % 2021-2026 | Total growth % 2021-2026 |
|---|---|---|---|
| Organic Edible Oil Total | 9.6 | 8.7 | 51.7 |
| Organic Olive Oil | 11.4 | 9.7 | 58.8 |
| Organic Vegetable and Seed Oil | 4.1 | 5.4 | 30.3 |
| Organic Ready Meals | 6.6 | 5.8 | 32.7 |
| Organic Sauces, Dressings and Condiments | 5.8 | 5.5 | 30.6 |
| Organic Soup | 14.0 | 10.3 | 63.0 |
| Organic Spreads Total | 7.2 | 6.6 | 37.5 |
| Organic Spreads excl Honey | 5.5 | 5.3 | 29.5 |
| Organic Honey | 10.0 | 8.6 | 51.2 |
|
Source: Euromonitor International, 2022 *CAGR: Compound Annual Growth Rate |
|||
Organic dairy
Organic dairy was the largest category, in terms of absolute value, in the organic packaged food market in France, recording US$1.2 billion, and accounting for a 26.0% market share in 2021. The sector grew at a CAGR of 10.3% in the historic period and is anticipated to grow in CAGR by 8.8%, reaching US$1.9 billion by 2026. Organic milk was the largest sub-category of organic dairy with retail sales of US$395.4 million (32.3% market share) in 2021. Of note, according to ici (in French only), there is a current overproduction of organic milk in France and nearly 20% of the supply was 'downgraded' or combined and sold, with conventional milk in 2021. For independent producers of large dairies, the loss amounted to about 8,000 euros in 2021 alone. In addition, the market for milk alternatives is increasing in Europe (according to Euromonitor International, as cited in agriculture et environnement (in French only)) and product sale expansion in France seems reasonable.
Euromonitor International (2022) notes that interest in organic and raw milk cheese is increasing, as more consumers are seeking the most natural cheeses, resulting in the growth of artisanal cheese made using unpasteurised milk. Further, whilst organic cheeses accounted for only a small percentage of total value within cheese overall, growth levels in terms of value are much higher than non-organic equivalents. Organic cheese experienced the largest CAGR of 28.4% as retail sales grew from US$71.7 million in 2016 to US$250.7 million in 2021, increasing 18.3% in CAGR from 2020 to 2021. Most large industrial cheese manufacturers are embracing the trend for organic cheese by improving their organic offerings and making their organic product ranges more sustainable through packaging, origin of raw materials, and fair trade. For example, the brand Les Deux Vaches and Nestlé France SA's, produce organic yoghurt with fair trade milk. In addition, spreadable cheeses have also gone organic, with new versions from Societe, Madame Loik and St Moret (Euromonitor International 2022).
Lactalis, Groupe (Brand name: Lactel, Président, Primevère and Société Bio) and Triballat-Noyal SAS (Brand name: Vrai) were the leading companies in the French organic dairy market with retail sales of US$160.2 million and US$123.0 million respectively and a combined market share of 23.1% in 2021.
| Category | 2016 | 2017 | 2018 | 2019 | 2020 | 2021 |
|---|---|---|---|---|---|---|
| Organic Dairy Total | 749.6 | 792.8 | 884.0 | 1,016.9 | 1,128.5 | 1,225.8 |
| Butter and Spreads | 133.1 | 140.2 | 144.1 | 152.2 | 167.5 | 175.2 |
| Cheese | 71.7 | 98.3 | 136.2 | 176.3 | 212.0 | 250.7 |
| Cream | 30.0 | 36.4 | 43.0 | 49.6 | 56.3 | 60.0 |
| Fromage Frais and Quark | 51.6 | 60.0 | 68.5 | 77.0 | 85.0 | 91.1 |
| Milk | 307.8 | 278.6 | 294.5 | 325.1 | 365.6 | 395.4 |
| Yoghurt | 155.3 | 179.4 | 197.7 | 236.7 | 242.2 | 253.6 |
| Source: Euromonitor International, 2022 | ||||||
| Category | Annual growth % 2020-2021 | CAGR* % 2016-2021 | Total growth % 2016-2021 |
|---|---|---|---|
| Organic Dairy Total | 8.6 | 10.3 | 63.5 |
| Butter and Spreads | 4.6 | 5.7 | 31.6 |
| Cheese | 18.3 | 28.4 | 249.7 |
| Cream | 6.6 | 14.9 | 100.0 |
| Fromage Frais and Quark | 7.2 | 12.0 | 76.6 |
| Milk | 8.2 | 5.1 | 28.5 |
| Yoghurt | 4.7 | 10.3 | 63.3 |
|
Source: Euromonitor International, 2022 *CAGR: Compound Annual Growth Rate |
|||
| Company | Retail sales (US$ millions) | Market share (%) |
|---|---|---|
| Total | 1,225.8 | 100.0 |
| Lactalis, Groupe | 160.2 | 13.1 |
| Triballat-Noyal SAS | 123.0 | 10.0 |
| Danone, Groupe | 81.1 | 6.6 |
| Sodiaal SA (Société de Diffusion Internationale Agro-alimentaire) | 65.2 | 5.3 |
| Entreprises Sill | 34.4 | 2.8 |
| Private Label | 344.5 | 28.1 |
| Artisanal | 89.8 | 7.3 |
| Others | 223.1 | 18.2 |
| Source: Euromonitor International, 2022 | ||
| Category | 2022 | 2023 | 2024 | 2025 | 2026 |
|---|---|---|---|---|---|
| Organic dairy Total | 1,345.0 | 1,465.9 | 1,590.6 | 1,724.5 | 1,865.8 |
| Butter and Spreads | 186.0 | 198.1 | 211.8 | 226.8 | 243.4 |
| Cheese | 294.0 | 330.9 | 364.6 | 400.6 | 437.9 |
| Cream | 63.6 | 68.0 | 72.5 | 77.2 | 81.3 |
| Fromage Frais and Quark | 99.8 | 109.2 | 119.3 | 129.9 | 140.7 |
| Milk | 431.9 | 471.8 | 514.7 | 560.5 | 609.0 |
| Yoghurt | 269.6 | 287.8 | 307.8 | 329.6 | 353.6 |
| Source: Euromonitor International, 2022 | |||||
| Category | Annual growth % 2021-2022 | CAGR* % 2021-2026 | Total growth % 2021-2026 |
|---|---|---|---|
| Organic dairy Total | 9.7 | 8.8 | 52.2 |
| Butter and Spreads | 6.2 | 6.8 | 38.9 |
| Cheese | 17.3 | 11.8 | 74.7 |
| Cream | 6.0 | 6.3 | 35.5 |
| Fromage Frais and Quark | 9.5 | 9.1 | 54.4 |
| Milk | 9.2 | 9.0 | 54.0 |
| Yoghurt | 6.3 | 6.9 | 39.4 |
|
Source: Euromonitor International, 2022 *CAGR: Compound Annual Growth Rate |
|||
Organic processed meat, seafood, fruits and vegetable
According to Euromonitor International (2022), meat has the potential for growth within the organic products sector. Currently, the segment's development is constrained due to the products tendency to be prohibitively expensive for many consumers. In response, some manufacturers, such as Charal, have developed responsibly raised ground meat, which is not organic, however; its lower product pricing makes it more accessible to consumers wanting to eat more responsibly and sustainably produced meats. Charal also offers organic products but their higher price makes them less appealing to many consumers.
The French organic chilled processed meat and seafood market grew significantly at a CAGR of 14.0% during the 2016-2021 period, with retail sales of US$491.5 million in 2021. The market experienced measurable growth (9.8%) between 2020 and 2021, and is expected to expand by a CAGR of 9.5% between 2021 and 2022. During the forecast period, retail sales are anticipated to increase by a CAGR of 8.7% with values of US$744.7 million by 2026.
The organic frozen meat, seafood, fruits and vegetable segment increased substantially by a CAGR of 12.8% during the historic period, with retail sales of US$91.8 million in 2021. The market expanded by a CAGR of 10.5% between 2020 and 2021, and expand by a CAGR of 10.2% between 2021 and 2022. In the forecast period, organic frozen meat is projected to achieve retail sales of US$144.9 million by 2026.
France's organic shelf stable meat, seafood, fruits and vegetable sector grew at a sizeable CAGR of 11.2% during the 2016-2021 period, with retail sales of US$133.5 million in 2021. This category also increased, experiencing a CAGR of 10.2% between 2020 and 2021 and is expected to attain 9.7% between 2021 and 2022. By 2026, the market is expected to witness a moderate CAGR of 9.3%, reaching US$208.0 million by 2026.
With respect to competition, the organic chilled processed meat and seafood segment were led by Fleury Michon, Groupe (Brand name: Fleury Michon), and Casa Tarradellas SA (Brand name: Herta Bio) with a combined market share of 27.5%, while private labels represented a 37.5% market share in 2021. The organic frozen meat, seafood, fruit and vegetable segment was led by LDC Group (Brand name: Maître Coq), representing a 23.7% market share, while private labels represented a strong market share position of 45.2% in 2021. The organic shelf stable meat, seafood, fruit and vegetable segment was led by Groupe Léa Nature (Brand name: Jardin Bio) representing a 13.3% market share, while private labels held a 21.5% market share in 2021.
| Category | 2016 | 2017 | 2018 | 2019 | 2020 | 2021 |
|---|---|---|---|---|---|---|
| Chilled Processed Meat and Seafood | 255.2 | 302.5 | 350.2 | 397.2 | 447.7 | 491.5 |
| Frozen Meat, Seafood, Fruit and Vegetables | 50.3 | 58.9 | 66.7 | 74.4 | 83.1 | 91.8 |
| Shelf Stable Meat, Seafood, Fruit and Vegetables | 78.4 | 88.1 | 98.5 | 109.0 | 121.1 | 133.5 |
| Source: Euromonitor International, 2022 | ||||||
| Category | Annual growth % 2020-2021 | CAGR* % 2016-2021 | Total growth % 2016-2021 |
|---|---|---|---|
| Chilled Processed Meat and Seafood | 9.8 | 14.0 | 92.6 |
| Frozen Meat, Seafood, Fruit and Vegetables | 10.5 | 12.8 | 82.5 |
| Shelf Stable Meat, Seafood, Fruit and Vegetables | 10.2 | 11.2 | 70.3 |
|
Source: Euromonitor International, 2022 *CAGR: Compound Annual Growth Rate |
|||
| Company | Retail sales (US$ millions) | Market share (%) |
|---|---|---|
| Total | 491.5 | 100.0 |
| Fleury Michon, Groupe | 78.9 | 16.1 |
| Casa Tarradellas SA | 56.1 | 11.4 |
| Private Label | 184.1 | 37.5 |
| Others | 172.4 | 35.1 |
| Source: Euromonitor International, 2022 | ||
| Company | Retail sales (US$ millions) | Market share (%) |
|---|---|---|
| Total | 91.8 | 100.0 |
| LDC Group | 21.8 | 23.7 |
| Private Label | 41.5 | 45.2 |
| Others | 28.5 | 31.0 |
| Source: Euromonitor International, 2022 | ||
| Company | Retail sales (US$ millions) | Market share (%) |
|---|---|---|
| Total | 133.5 | 100.0 |
| Groupe Léa Nature | 17.7 | 13.3 |
| Private Label | 28.7 | 21.5 |
| Others | 87.1 | 65.2 |
| Source: Euromonitor International, 2022 | ||
| Category | 2022 | 2023 | 2024 | 2025 | 2026 |
|---|---|---|---|---|---|
| Chilled Processed Meat and Seafood | 538.0 | 586.2 | 632.9 | 687.1 | 744.7 |
| Frozen Meat, Seafood, Fruit and Vegetables | 101.2 | 111.1 | 121.5 | 133.3 | 144.9 |
| Shelf Stable Meat, Seafood, Fruit and Vegetables | 146.5 | 160.4 | 175.0 | 191.4 | 208.0 |
| Source: Euromonitor International, 2022 | |||||
| Category | Annual growth % 2021-2022 | CAGR* % 2021-2026 | Total growth % 2021-2026 |
|---|---|---|---|
| Chilled Processed Meat and Seafood | 9.5 | 8.7 | 51.5 |
| Frozen Meat, Seafood, Fruit and Vegetables | 10.2 | 9.6 | 57.8 |
| Organic Shelf Stable Meat, Seafood, Fruit and Vegetables | 9.7 | 9.3 | 55.8 |
|
Source: Euromonitor International, 2022 *CAGR: Compound Annual Growth Rate |
|||
Organic rice and pasta
The French organic rice and pasta sector grew at a moderate CAGR of 11.9% in the historic period, recording retail sales of US$129.0 million in 2021. The market contracted 1.7% between 2020 and 2021, and is expected to recover and expand by a CAGR of 8.4% between 2021 and 2022. During the forecast period, retail sales are anticipated to increase by a CAGR of 9.7% recording values of US$204.8 million by 2026.
The French organic rice market experienced a CAGR of 8.6% during the historic period, with retail sales of US$48.7 million in 2021. Ecotone (Brand names: Bonneterre), Groupe Léa Nature (Brand names: Jardin Bio) and (The) Hain Celestial Group Inc, (Brand name: Lima) were the three largest organic rice companies in 2021 with a combined market share of 31.8%. Private labels had values of US$16.1 million, representing a 33.1% market share in 2021. The market is forecast to experience an increase in CAGR of 6.2%, reaching US$65.8 million in retail sales by 2026.
Organic pasta was the larger sub-category with retail sales of US$80.2 million (62.2% market share) in 2021. During the historic period, organic pasta experienced a CAGR of 14.2% and is expected to increase in CAGR by 11.6% to record retail sales of $US139.0 million by 2026. Barilla Holding SpA (Brand name: Barilla) was the leading spread company in France with a market share of 13.5%, followed by Ebro Foods SA (Brand name: Panzani and Lustucru) with a market share of 5.9% and Alpina Savoie SA (Brand name: Alpina) with a 4.9% market share in 2021. Private labels continued their strong presence with retail sales of $US45.5 million and a 56.7% market share in 2021.
| Category | 2016 | 2017 | 2018 | 2019 | 2020 | 2021 |
|---|---|---|---|---|---|---|
| Organic Rice and Pasta Total | 73.6 | 85.6 | 99.3 | 114.0 | 131.2 | 129.0 |
| Rice | 32.3 | 35.8 | 39.4 | 42.8 | 49.2 | 48.7 |
| Pasta | 41.3 | 49.9 | 59.9 | 71.1 | 82.0 | 80.2 |
| Source: Euromonitor International, 2022 | ||||||
| Category | Annual growth % 2020-2021 | CAGR* % 2021-2026 | Total growth % 2021-2026 |
|---|---|---|---|
| Organic Rice and Pasta Total | −1.7 | 11.9 | 75.3 |
| Rice | −1.0 | 8.6 | 50.8 |
| Pasta | −2.2 | 14.2 | 94.2 |
|
Source: Euromonitor International, 2022 *CAGR: Compound Annual Growth Rate |
|||
| Company | Retail sales ($US millions) | Market share (%) |
|---|---|---|
| Total | 48.7 | 100.0 |
| Ecotone | 5.6 | 11.5 |
| Groupe Léa Nature | 5.3 | 10.9 |
| Hain Celestial Group Inc, The | 4.6 | 9.4 |
| Mars Inc | 2.8 | 5.7 |
| Ebro Foods SA | 2.6 | 5.3 |
| Private Label | 16.1 | 33.1 |
| Others | 11.8 | 24.2 |
| Source: Euromonitor International, 2022 | ||
| Company | Retail sales ($US millions) | Market share (%) |
|---|---|---|
| Total | 80.2 | 100.0 |
| Barilla Holding SpA | 10.8 | 13.5 |
| Ebro Foods SA | 4.7 | 5.9 |
| Alpina Savoie SA | 3.9 | 4.9 |
| Ebro Foods SA | 2.2 | 2.7 |
| Private Label | 45.5 | 56.7 |
| Others | 13.1 | 16.3 |
| Source: Euromonitor International, 2022 | ||
| Category | 2022 | 2023 | 2024 | 2025 | 2026 |
|---|---|---|---|---|---|
| Organic Rice and Pasta Total | 139.9 | 154.8 | 170.7 | 187.5 | 204.8 |
| Rice | 49.9 | 53.1 | 56.9 | 61.1 | 65.8 |
| Pasta | 90.0 | 101.6 | 113.8 | 126.4 | 139.0 |
| Source: Euromonitor International, 2022 | |||||
| Category | Annual growth % 2021-2022 | CAGR* % 2021-2026 | Total growth % 2021-2026 |
|---|---|---|---|
| Organic Rice and Pasta Total | 8.4 | 9.7 | 58.8 |
| Rice | 2.5 | 6.2 | 35.1 |
| Pasta | 12.2 | 11.6 | 73.3 |
|
Source: Euromonitor International, 2022 *CAGR: Compound Annual Growth Rate |
|||
Organic snacks
The French organic confectionery market grew at a substantial CAGR of 20.2% (notably chocolate confectionery which grew at a CAGR of 21.3%) in the historic period, recording confectionery retail sales of US$168.2 million in 2021. The market increased 8.0% between 2020 and 2021, and is expected to further develop by 8.4% between 2021 and 2022. Organic chocolate confectionery in particular, had retail sales of US$154.8 million in 2021, and represents a significant proportion of the chocolate tablet industry. An estimated 7% of all chocolates sold in France are now organic as consumers are more trusting of locally produced organic chocolate, fostering growth in artisanal and French focused products. Private labels are also offering their own organic chocolate tablets (Euromonitor International 2022).
During the forecast period, confectionery retail sales are anticipated to increase by a CAGR of 7.3% recording values of US$239.7 million by 2026, as new launches by multi-national companies and local industry continue. Ecotone (Brand name: Alter Eco and Bonneterre) and Ethiquable Deutschland eG (Brand name: Ethiquable) were the largest organic confectionery companies in France accumulating market share representation of 23.4% and 20.2% respectively, in 2021. Private label organic confectionery was valued at US$45.5 million and represented a 27.1% market share in 2021.
The French organic ice cream segment experienced the largest CAGR of 31.5% of the organic snack categories during the 2016-2021 period, with retail sales of US$12.2 million in 2021, increasing from US$3.1 million in 2016. The ice cream market grew 11.9% between 2020 and 2021, and is expected to increase by 11.5% between 2021 and 2022. The sector is expected to experience the largest CAGR of 10.3% of the organic snack subcategories in the forecast period, reaching US$19.9 million by 2026. Aquitaine Biologie Sarl (Brand name: Aquibio) and Terre Adélice Sarl (Brand name: Terre adélice) were the two largest organic ice cream companies in France representing market shares of 15.6% and 14.8% respectively, in 2021. Private shares were valued at $US2.3 million, representing a 18.9% market share in 2021.
The organic savoury snack market increased by a moderate CAGR of 12.2% during the historic period, attaining retail sales of US$97.3 million in 2021. Of interest, the nuts, seeds and trail mixes savoury snacks experienced a CAGR of 14.1% as retail sales grew to US$38.4 million, while savoury snacks excluding nuts, seeds and trail mixes experienced a CAGR of 11.1% reaching retail sales of $US58.9 million in 2021. The savoury snack sector increased by 7.6% between 2020 and 2021, and is expected to experience moderate growth at a CAGR of 8.6% during the forecast period, reaching retail sales of US$147.1 by 2026. Sales in the savoury snack sector are fragmented as Altho SAS (Brand name: Bret's) and Maitre Prunille SAS (Brand name: Maitre Prunille) were the top companies representing market shares of 14.5% and 8.4% respectively, while private labels accounted for retail sales of US$45.3 million, representing a measureable 46.6% market share in 2021.
The organic sweet biscuits, snack bars and fruit snack subcategory experienced a moderate CAGR of 12.6% in the historic period, and was the largest organic snack category in France- in absolute value terms, with retail sales of US$280.1 million in 2021. Sweet biscuits represented the largest segment of organic sweet snacks with retail sales of US$208.7 million (74.5% market share) in 2021. The sweet snack market is expected to increase by a CAGR of 7.9% between 2021 and 2026, reaching retail sales of US$408.8 by 2026. The organic sweet snack market in France is fragmented with Ecotone (Brand name: Bjorg and Bonneterre) representing a 25.5% market share, followed by Morina Patissier SA (Brand name: Saint-Michel) with a 9.1% market share and Otsuka Holdings Co Ltd (Brand name: Cereal Bio) with a 8.2% market share in 2021. The organic sweet biscuits market in particular, is further represented by Ecotone (Brand name: Bjorg) with a 31.9% market share, followed by Morina Patissier SA (Brand name: Saint-Michel) with a 12.2% market share Otsuka Holdings Co Ltd (Brand name: Cereal Bio) with a 11.0% market share in 2021.
| Category | 2016 | 2017 | 2018 | 2019 | 2020 | 2021 |
|---|---|---|---|---|---|---|
| Confectionery | 67.1 | 88.1 | 109.4 | 134.2 | 155.8 | 168.2 |
| Chocolate Confectionery | 59.0 | 79.1 | 99.8 | 122.1 | 143.3 | 154.8 |
| Sugar Confectionery | 8.2 | 8.9 | 9.6 | 12.1 | 12.5 | 13.4 |
| Ice Cream | 3.1 | 6.5 | 7.8 | 9.0 | 10.9 | 12.2 |
| Savoury Snacks | 54.7 | 63.3 | 71.7 | 79.6 | 90.4 | 97.3 |
| Nuts, Seeds and Trail Mixes | 19.9 | 23.6 | 27.2 | 30.5 | 35.2 | 38.4 |
| Savoury Snacks Excl Nuts, Seeds and Trail Mixes | 34.8 | 39.7 | 44.5 | 49.0 | 55.2 | 58.9 |
| Sweet Biscuits, Snack Bars and Fruit Snacks | 154.6 | 173.9 | 192.6 | 230.5 | 262.7 | 280.1 |
| Cereal Bars | 18.7 | 19.8 | 21.0 | 21.9 | 20.8 | 22.0 |
| Fruit Snacks | 29.2 | 33.0 | 36.7 | 40.9 | 47.2 | 49.5 |
| Sweet Biscuits | 106.7 | 121.1 | 134.9 | 167.7 | 194.7 | 208.7 |
| Source: Euromonitor International, 2022 | ||||||
| Category | Annual growth % 2020-2021 | CAGR* % 2016-2021 | Total growth % 2016-2021 |
|---|---|---|---|
| Confectionery | 8.0 | 20.2 | 150.7 |
| Chocolate Confectionery | 8.0 | 21.3 | 162.4 |
| Sugar Confectionery | 7.2 | 10.3 | 63.4 |
| Ice Cream | 11.9 | 31.5 | 293.5 |
| Savoury Snacks | 7.6 | 12.2 | 77.9 |
| Nuts, Seeds and Trail Mixes | 9.1 | 14.1 | 93.0 |
| Savoury Snacks Excl Nuts, Seeds and Trail Mixes | 6.7 | 11.1 | 69.3 |
| Sweet Biscuits, Snack Bars and Fruit Snacks | 6.6 | 12.6 | 81.2 |
| Cereal Bars | 5.8 | 3.3 | 17.6 |
| Fruit Snacks | 4.9 | 11.1 | 69.5 |
| Sweet Biscuits | 7.2 | 14.4 | 95.6 |
|
Source: Euromonitor International, 2022 *CAGR: Compound Annual Growth Rate |
|||
| Company | Retail sales ($US millions) | Market share (%) |
|---|---|---|
| Total | 168.2 | 100.0 |
| Ecotone | 39.4 | 23.4 |
| Ethiquable Deutschland eG | 34.0 | 20.2 |
| Mondelez International Inc | 15.8 | 9.4 |
| Private Label | 45.5 | 27.1 |
| Others | 25.9 | 15.4 |
| Source: Euromonitor International, 2022 | ||
| Company | Retail sales ($US millions) | Market share (%) |
|---|---|---|
| Total | 12.2 | 100.0 |
| Aquitaine Biologie Sarl | 1.9 | 15.6 |
| Terre Adélice Sarl | 1.8 | 14.8 |
| Private Label | 2.3 | 18.9 |
| Others | 4.9 | 40.2 |
| Source: Euromonitor International, 2022 | ||
| Company | Retail sales ($US millions) | Market share (%) |
|---|---|---|
| Total | 97.3 | 100.0 |
| Altho SAS | 14.1 | 14.5 |
| Maitre Prunille SAS | 8.2 | 8.4 |
| Hain Celestial Group Inc, The | 6.3 | 6.5 |
| Private Label | 45.3 | 46.6 |
| Others | 23.5 | 24.2 |
| Source: Euromonitor International, 2022 | ||
| Company | Retail sales ($US millions) | Market share (%) |
|---|---|---|
| Total | 280.1 | 100.0 |
| Ecotone | 71.3 | 25.5 |
| Morina Patissier SA | 25.6 | 9.1 |
| Otsuka Holdings Co Ltd | 23.0 | 8.2 |
| Groupe Léa Nature | 11.0 | 3.9 |
| Vitagermine SAS | 8.7 | 3.1 |
| Private Label | 92.7 | 33.1 |
| Others | 32.0 | 11.4 |
| Source: Euromonitor International, 2022 | ||
| Category | 2022 | 2023 | 2024 | 2025 | 2026 |
|---|---|---|---|---|---|
| Confectionery | 182.4 | 197.2 | 210.9 | 225.2 | 239.7 |
| Chocolate Confectionery | 168.0 | 181.9 | 194.7 | 208.1 | 221.8 |
| Sugar Confectionery | 14.4 | 15.3 | 16.2 | 17.1 | 17.8 |
| Ice Cream | 13.6 | 15.1 | 16.6 | 18.2 | 19.9 |
| Savoury Snacks | 105.4 | 114.5 | 124.4 | 135.2 | 147.1 |
| Nuts, Seeds and Trail Mixes | 41.8 | 45.9 | 50.4 | 55.7 | 61.7 |
| Savoury Snacks Excl Nuts, Seeds and Trail Mixes | 63.6 | 68.6 | 74.0 | 79.6 | 85.3 |
| Sweet Biscuits, Snack Bars and Fruit Snacks | 303.7 | 327.7 | 353.4 | 380.8 | 408.8 |
| Cereal Bars | 23.1 | 24.2 | 25.4 | 26.8 | 28.3 |
| Fruit Snacks | 53.4 | 56.5 | 59.5 | 62.7 | 65.8 |
| Sweet Biscuits | 227.2 | 247.1 | 268.5 | 291.4 | 314.7 |
| Source: Euromonitor International, 2022 | |||||
| Category | Annual growth % 2021-2022 | CAGR* % 2021-2026 | Total growth % 2021-2026 |
|---|---|---|---|
| Confectionery | 8.4 | 7.3 | 42.5 |
| Chocolate Confectionery | 8.5 | 7.5 | 43.3 |
| Sugar Confectionery | 7.5 | 5.8 | 32.8 |
| Ice Cream | 11.5 | 10.3 | 63.1 |
| Savoury Snacks | 8.3 | 8.6 | 51.2 |
| Nuts, Seeds and Trail Mixes | 8.9 | 9.9 | 60.7 |
| Savoury Snacks Excl Nuts, Seeds and Trail Mixes | 8.0 | 7.7 | 44.8 |
| Sweet Biscuits, Snack Bars and Fruit Snacks | 8.4 | 7.9 | 45.9 |
| Cereal Bars | 5.0 | 5.2 | 28.6 |
| Fruit Snacks | 7.9 | 5.9 | 32.9 |
| Sweet Biscuits | 8.9 | 8.6 | 50.8 |
|
Source: Euromonitor International, 2022 *CAGR: Compound Annual Growth Rate |
|||
New product launch analysis
According to Mintel's Global New Products Database (GNPD), there were 15,343 organic packaged food products launched in the French market from 2017 to 2021. The number of yearly product launches has increased in growth by a CAGR of 14.4% from a launch of 2,355 organic packaged food products in 2016 to its most recent launch of 4,031 organic packaged food products in 2021. Of note, new product launches of organic packaged food experienced the largest increase in growth rate (36.1%) from 2020 to 2021 as product launches increased from 2,961 to 4,031 products, and contracted in growth by 8.2% from 3,224 products released in 2019 to 2,961 products in 2020.
The predominant categories of organic packaged food products released were bakery (2,267 products), sauces and seasonings (2,061 products) and snacks (1,440 products). The most popular product claim was ethical-environmentally friendly package (6,068 products), followed by ethical-recycling (5,495 products) and ethical - sustainable (habitat/resources) with 2,895 products. The companies with the highest number of new product launches was Scamark with (329 products), followed by Léa nature (265 products) and Monoprix (250 products). Nearly half of the product launches (6,212 products) were new variety/ range extension, whereas 28.8% were new products (4,425 products). The top five packaging types included flexible packaging (5,415 products), jar (3,287 products), carton (1,259 products), flexible stand-up pouch (1,145 products) and tray (1,078 products).
| Product attributes | Number of new products by year | Total | ||||
|---|---|---|---|---|---|---|
| 2017 | 2018 | 2019 | 2020 | 2021 | ||
| Yearly product launches | 2,355 | 2,772 | 3,224 | 2,961 | 4,031 | 15,343 |
| Top 5 categories | ||||||
| Bakery | 371 | 433 | 502 | 422 | 539 | 2,267 |
| Sauces & Seasonings | 299 | 372 | 371 | 417 | 602 | 2,061 |
| Snacks | 240 | 244 | 292 | 281 | 383 | 1,440 |
| Dairy | 194 | 242 | 356 | 249 | 355 | 1,396 |
| Side Dishes | 224 | 267 | 289 | 235 | 320 | 1,335 |
| Top 10 claims | ||||||
| Ethical - Environmentally Friendly Package | 722 | 1,004 | 1,282 | 1,220 | 1,840 | 6,068 |
| Ethical - Recycling | 657 | 922 | 1,175 | 1,117 | 1,624 | 5,495 |
| Ethical - Sustainable (Habitat/Resources) | 276 | 387 | 572 | 645 | 1,015 | 2,895 |
| Ethical - Environmentally Friendly Package | 277 | 368 | 550 | 563 | 931 | 2,689 |
| Low/No/Reduced Allergen | 524 | 562 | 536 | 391 | 571 | 2,584 |
| Gluten Free | 460 | 509 | 471 | 349 | 482 | 2,271 |
| Vegan/No Animal Ingredients | 348 | 382 | 483 | 405 | 590 | 2,208 |
| Social Media | 221 | 349 | 439 | 438 | 652 | 2,099 |
| No Additives/Preservatives | 238 | 364 | 381 | 369 | 550 | 1,902 |
| Ethical - Human | 200 | 189 | 309 | 386 | 680 | 1,764 |
| Top 10 companies | ||||||
| Scamark | 66 | 59 | 68 | 70 | 66 | 329 |
| Léa nature | 45 | 43 | 53 | 47 | 77 | 265 |
| Monoprix | 3 | 13 | 87 | 87 | 60 | 250 |
| Interdis | 4 | 14 | 24 | 57 | 125 | 224 |
| Intermarché | 9 | 37 | 49 | 62 | 61 | 218 |
| Casino | 6 | 40 | 78 | 34 | 50 | 208 |
| Nutrition & Santé | 14 | 32 | 44 | 39 | 72 | 201 |
| La Vie Claire | 49 | 20 | 108 | 13 | 0 | 190 |
| Lidl | 29 | 20 | 62 | 21 | 56 | 188 |
| Groupe Ekibio | 31 | 37 | 45 | 21 | 41 | 175 |
| Top 5 flavours (including blend) | ||||||
| Unflavoured/Plain | 875 | 1,072 | 1,258 | 1,180 | 1,568 | 5,953 |
| Chocolate | 55 | 73 | 65 | 80 | 88 | 361 |
| Hazelnut | 29 | 25 | 32 | 44 | 80 | 210 |
| Vegetable | 27 | 45 | 48 | 20 | 30 | 170 |
| Tomato | 23 | 31 | 27 | 27 | 47 | 155 |
| Top 5 ingredients | ||||||
| Salt | 702 | 827 | 1,092 | 898 | 1,184 | 4,703 |
| Waters | 689 | 694 | 933 | 672 | 1,040 | 4,028 |
|
Sunflower Seed Oil |
475 | 566 | 701 | 570 | 784 | 3,096 |
| Cane Sugar | 398 | 489 | 599 | 543 | 758 | 2,787 |
| Sea Salt | 478 | 489 | 551 | 434 | 606 | 2,558 |
| Launch types | ||||||
| New Variety/Range Extension | 892 | 1,094 | 1,431 | 1,117 | 1,678 | 6,212 |
| New Product | 784 | 910 | 858 | 914 | 959 | 4,425 |
| New Packaging | 494 | 576 | 717 | 675 | 1,012 | 3,474 |
| Relaunch | 165 | 185 | 202 | 238 | 370 | 1,160 |
| New Formulation | 20 | 7 | 16 | 17 | 12 | 72 |
| Top 5 package types | ||||||
| Flexible | 872 | 975 | 1,171 | 1,065 | 1,332 | 5,415 |
| Jar | 479 | 551 | 578 | 689 | 990 | 3,287 |
| Carton | 167 | 212 | 296 | 266 | 318 | 1,259 |
| Flexible stand-up pouch | 149 | 252 | 213 | 202 | 329 | 1,145 |
| Tray | 206 | 216 | 273 | 165 | 218 | 1,078 |
| Product origin | ||||||
| Imported | 343 | 412 | 376 | 311 | 384 | 1,826 |
| Not imported | 645 | 807 | 993 | 854 | 1,232 | 4,531 |
| Source: Mintel Global New Product Database (GNPD), 2022 | ||||||
| Category | Number of products | Average price (in US$) |
|---|---|---|
| Bakery | 2,267 | 3.99 |
| Sauces & Seasonings | 2,061 | 5.79 |
| Snacks | 1,440 | 517 |
| Dairy | 1,396 | 3.64 |
| Side Dishes | 1,335 | 3.64 |
| Processed Fish, Meat & Egg Products | 1,251 | 5.96 |
| Sweet Spreads | 1,228 | 8.16 |
| Fruit & Vegetables | 758 | 3.95 |
| Chocolate Confectionery | 579 | 5.19 |
| Breakfast Cereals | 533 | 5.66 |
| Desserts & Ice Cream | 527 | 3.82 |
| Savoury Spreads | 497 | 4.23 |
| Meals & Meal Centers | 461 | 5.06 |
| Baby Food | 391 | 5.3 |
| Soup | 330 | 4.15 |
| Sugar & Gum Confectionery | 160 | 5.46 |
| Sweeteners & Sugar | 129 | 5.28 |
| Source: Mintel Global New Product Database (GNPD), 2022 | ||
Examples of new products
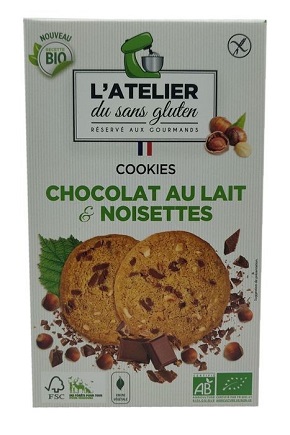
Milk Chocolate and Hazelnut Gluten-Free Cookies
Source: Mintel, 2022
| Company | L'Atelier du Sans Gluten |
|---|---|
| Brand | L'Atelier du Sans Gluten |
| Category | Bakery |
| Sub-category | Sweet biscuits / cookies |
| Market | France |
| Location of manufacture | France |
| Import Status | Not imported |
| Store type | Mass merchandise / hypermarket |
| Date published | December 2021 |
| Launch type | Relaunch |
| Price in US dollars | 5.02 |
L'Atelier du Sans Gluten Cookies Chocolat au Lait & Noisettes (Milk Chocolate and Hazelnut Gluten-Free Cookies) have been relaunched with a new formulation, now made to an organic recipe, and a new packaging design. The artisan product is made in the Île-de-France with 100% green energy and is free from preservatives, artificial additives, palm oil, soya lecithin, natural vanilla flavouring, and white sugar. It retails in a recyclable 150 gram pack printed with vegetable inks, containing two sachets of three cookies each and bearing the AB Certified, EU Organic, Facebook, Instagram, FSC Mix and FSC Forest for All Forever logos. The manufacturer has reduced its packaging by 40% and claims to favour nearest organic producers in France or Europe to reduce their carbon footprint, with the ingredients grown on other continents, such as cocoa and sugar cane, obtained from fairtrade.
Organic Toasted Wheat Rolls

Source: Mintel, 2022
| Company | Interdis |
|---|---|
| Brand | Carrefour Bio |
| Category | Bakery |
| Sub-category | Bread and bread products |
| Market | France |
| Store type | Supermarket |
| Date published | December 2021 |
| Launch type | New variety / range extension |
| Price in US dollars | 1.41 |
Carrefour Bio Petits Pains Grillés au Froment (Organic Toasted Wheat Rolls) have been added to the range. The product is free from palm oil, scores a B on the Nutri-Score, and retails in a 225 gram pack bearing the AB and EU Organic logos.
Pure BBQ Sauce

Source: Mintel, 2022
| Company | Copyr |
|---|---|
| Brand | Senchou |
| Category | Sauces and seasonings |
| Sub-category | Table sauces |
| Market | France |
| Location of manufacture | France |
| Import Status | Not imported |
| Store type | Mass merchandise / hypermarket |
| Date published | December 2021 |
| Launch type | New variety / range extension |
| Price in US dollars | 4.41 |
| Bar code | 3361779994516 |
Senchou Pur BBQ Sauce (Pure BBQ Sauce) has been added to the range. This organic barbecue sauce has been smoked with oak wood, is free from added sugar, gluten and GMO, and is suitable for vegans. It has been made in the Ariège region, and retails in a 400 gram pack bearing the AB - Agriculture Biologique and EU Organic logos.
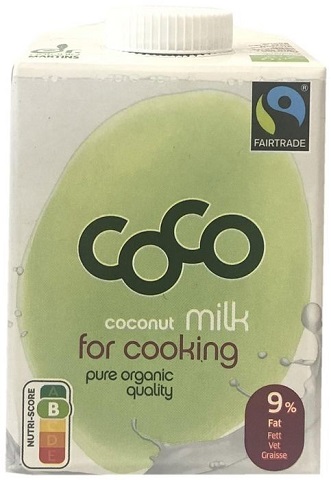
Coconut Milk for Cooking
Source: Mintel, 2022
| Company | Green Coco |
|---|---|
| Brand | Dr. Antonio Martins Coco |
| Category | sauces and seasonings |
| Sub-category | Cooking sauces |
| Market | France |
| Location of manufacture | Germany |
| Import Status | Imported product |
| Store type | Mass merchandise / hypermarket |
| Date published | December 2021 |
| Product source | Shopper |
| Launch type | New packaging |
| Price in US dollars | 2.71 |
Dr. Antonio Martins Coco Lait de Coco Bio Allégé à Cuisson (Coconut Milk for Cooking) has been repackaged with a new design. This light organic coconut milk from fully ripe coconuts is described as nature's other milk, and beautifully creamy with a deliciously coconut flavour. It contains 9% fat and is said to be a shot of exotic for a creative kitchen. This vegan friendly product scores B on the Nutri-Score, and now retails in a 500 millilitre pack bearing the Fairtrade, FSC Mix and EU Organic logos.
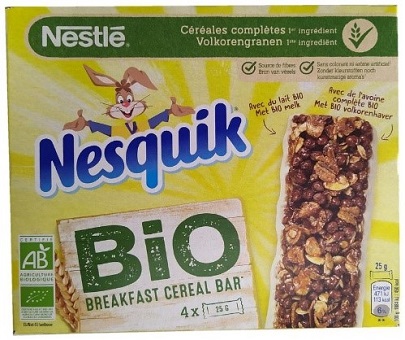
Breakfast Cereal Bars
Source: Mintel, 2022
| Company | Nestlé |
|---|---|
| Brand | Nestlé Nesquik Bio |
| Category | Snacks |
| Sub-category | Snack / cereal / energy bars |
| Market | France |
| Store type | Supermarket |
| Date published | December 2020 |
| Launch type | New product |
| Price in US dollars | 2.88 |
Nestlé Nesquik Bio Barres de Céréales (Breakfast Cereal Bars) are now available. This organic product is formulated with wholegrain cereals as the first ingredient, as well as organic wholegrain oat, organic milk and cocoa, is a source of fibre, and is free from colouring and artificial flavouring. It retails in a 100 gram pack containing four 25 gram units, and bearing AB Certified and EU Green Leaf logos. The manufacturer claims that this products participates in the respect of the environment and biodiversity.
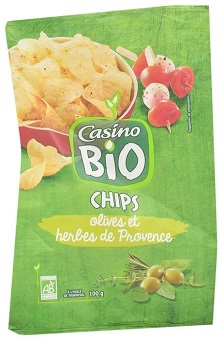
Olive and Provence Herb Chips
Source: Mintel, 2022
| Company | Casino |
|---|---|
| Brand | Casino Bio |
| Category | Snacks |
| Sub-category | Potato snacks |
| Market | France |
| Store type | Mass merchandise / hypermarket |
| Date published | December 2019 |
| Launch type | New variety / range extension |
| Price in US dollars | 2.16 |
Casino Bio Chips Olives et Herbes de Provence (Olive and Provence Herb Chips) have been added to the range. This organic product is prepared with sunflower oil and is free from palm oil and glucose-fructose syrup. It retails in a 100 gram pack featuring the AB and EU Green Leaf logos.
Cancoillotte Cheese with Garlic

Source: Mintel, 2022
| Company | Interdis |
|---|---|
| Brand | Carrefour Bio |
| Category | Dairy |
| Sub-category | Processed cheese |
| Market | France |
| Location of manufacture | France |
| Import Status | Not imported |
| Store type | Supermarket |
| Date published | December 2020 |
| Launch type | New product |
| Price in US dollars | 2.63 |
Carrefour Bio Cancoillotte à l'Ail (Cancoillotte Cheese with Garlic) is now available. This organic processed cheese speciality retails in a 200 gram pack bearing the AB and EU Green Leaf logos.
Organic Apricot Flavoured Fermented Soy Dessert
Source: Mintel, 2022
| Company | St Hubert |
|---|---|
| Brand | St Hubert Végétal |
| Category | Dairy |
| Sub-category | Plant based spoonable yogurts (dairy alternatives) |
| Market | France |
| Location of manufacture | France |
| Import Status | Not imported |
| Store type | Supermarket |
| Date published | November 2018 |
| Launch type | New product |
| Price in US dollars | 2.62 |
St Hubert Végétal Abricot Bio (Organic Apricot Flavoured Fermented Soy Dessert) is now available. This organic certified product contains mixed fruits, is formulated with non GMO French soy, and suitable for vegetarians and vegans. It is low in fat and saturated fat, and a source of plant-based proteins which contribute to maintaining normal bones. The product retails in a 400 gram partly recyclable pack containing four 100 gram pots and featuring the AB and EU Green Leaf logos.
Organic Beef Tortellini
Source: Mintel, 2022
| Company | Maison Tino |
|---|---|
| Brand | Grazie |
| Category | Side dishes |
| Sub-category | Pasta |
| Market | France |
| Location of manufacture | Italy |
| Import Status | Imported product |
| Store type | Supermarket |
| Date published | December 2021 |
| Launch type | New variety / range extension |
| Price in US dollars | 5.70 |
Grazie Tortellini à la Viande de Boeuf Bio (Organic Beef Tortellini) have been added to the range. The GMO free product is made with Italian raised beef, has not been treated with ionisation and has a cooking time of two minutes. It retails in a 250 gram pack bearing the AB and EU Organic logos, and cooking instructions.
Wholemeal Rice Noodles
Source: Mintel, 2022
| Company | Duval Foods |
|---|---|
| Brand | Racines Bio |
| Category | Side dishes |
| Sub-category | Noodles |
| Market | France |
| Location of manufacture | Thailand |
| Import Status | Imported product |
| Store type | Supermarket |
| Date published | December 2020 |
| Launch type | New variety / range extension |
| Price in US dollars | 4.04 |
Racines Bio Nouilles de Riz Complet (Wholemeal Rice Noodles) have been added to the range. This organic product is naturally free from gluten, is suitable for vegans, and can be cooked in eight minutes. It retails in a 220 gram pack containing four servings, and bearing the AB and EU Green Leaf logos, as well as a recipe suggestion and cooking instructions.
Organic labelling
Mandatory organic standards and labels
The European Union (EU) legislation on organic farming is fully implemented in France and defines the standards for all organic products produced by member countries. The French Ministry of Agriculture is responsible for the implementation of the EU legislation for organic farming. The National Institute of Origin and Quality (INAO), as the assigned competent authority, is responsible for the approval and monitoring of the private control bodies. (FiBL organicexportinfo)

Pre-packaged organic products sold in France require the EU organic farming logo. For products imported from third counties, the use of the EU organic farming logo is optional. A mandatory national organic label does not exist. (FiBL organicexportinfo)
Whenever the EU organic logo is used on a product, it has to be accompanied by the code number of the control body, and the place where the agricultural raw materials of which the product is composed, have been farmed. (Alqueriadebou.com)
Some of the requirements for the EU-Organic label are (inecta, July 2019):
- The ingredients must be comprised of 95% organic farming
- Throughout production, there must be clear division between organic and non-organic products
- Little to no use of antibiotics on animals
- Strict compliance to rules regarding animal welfare and conditions
- Zero use of genetically modified products whatsoever
Voluntary organic standards and labels

Organic certification in France was introduced in 1985. The green and white logo or label is comprised of the acronym "AB" or "Agriculture Biologique" and fulfills the EU regulations for organic food. (bioagricert) The national organic logo, the AB mark, is owned by the French Ministry of Agriculture. Private standards and labels do not exist. (FiBL organicexportinfo)
Usage of the AB mark is voluntary and must follow rules for the AB mark. (FiBL organicexportinfo) Organic producers are often encouraged to label their products with the 'AB' trademark as this is a recognized label by the French consumer. (bioagricert)
For more information
The Canadian Trade Commissioner Service:
International Trade Commissioners can provide Canadian industry with on-the-ground expertise regarding market potential, current conditions and local business contacts, and are an excellent point of contact for export advice.
More agri-food market intelligence:
International agri-food market intelligence
Discover global agriculture and food opportunities, the complete library of Global Analysis reports, market trends and forecasts, and information on Canada's free trade agreements.
Agri-food market intelligence service
Canadian agri-food and seafood businesses can take advantage of a customized service of reports and analysis, and join our email subscription service to have the latest reports delivered directly to their inbox.
More on Canada's agriculture and agri-food sectors:
Canada's agriculture sectors
Information on the agriculture industry by sector. Data on international markets. Initiatives to support awareness of the industry in Canada. How the department engages with the industry.
Resources
- Agriculture et environnement: Will the organic milk crisis continue? (in French only), 25 October 2021
- Alqueriadebou.com: EU organic logo, questions & answers
- bioagricert
- Business France Nordics; Food & Wine - What about organic in France?, 7 February 2020
- CIC AIDEXPORT; Insights into the French organic food sector, 20 December 2021.
- Euromonitor International, 2022:
- Country Report: Health and Wellness in France, January 2022
- Country Report: Organic Packaged Food in France, January 2022
- Country Report: Economy, Finance and Trade: France, 15 February 2022
- Country Report: Environmental Sustainability: France, 29 September 2021.
- franceinfo: Declining sales, suspicious consumers, weakened producers – is the organic market running out of steam? (in French only), Mahuet, Agathe, 09/05/2022.
- Global Trade Tracker, 2022
- ici (in French only) (par France Bleu et France 3): Video: Due to lack of demand, 18% of the organic milk of this Breton producer is mixed with conventional milk, Delmarle, Thibault, 6 February 2022
- Inecta; What is the EU-Organic Certification?, Gudmundsson, Bjorgviv, 16 July 2019.
- Mintel Global New Products Database, 2022
- The Research Institute of Organic Agriculture FiBL; organicexportinfo – Last update: 26 November 2018
- 20 Minutes France (Société) : In the midst of a growth crisis, the organic sector is wondering about its future (in French only)
Health and Wellness Series – Organic packaged food trends in France
Global Analysis Report
Prepared by: Laurie Bernardi, International Market Analyst
© His Majesty the King in Right of Canada, represented by the Minister of Agriculture and Agri-Food (2022).
Photo credits
All photographs reproduced in this publication are used by permission of the rights holders.
All images, unless otherwise noted, are copyright His Majesty the King in Right of Canada.
To join our distribution list or to suggest additional report topics or markets, please contact:
Agriculture and Agri-Food Canada, Global Analysis1341 Baseline Rd, Tower 5, 3rd floor
Ottawa ON K1A 0C5
Canada
Email: aafc.mas-sam.aac@agr.gc.ca
The Government of Canada has prepared this report based on primary and secondary sources of information. Although every effort has been made to ensure that the information is accurate, Agriculture and Agri-Food Canada (AAFC) assumes no liability for any actions taken based on the information contained herein.
Reproduction or redistribution of this document, in whole or in part, must include acknowledgement of agriculture and agri-food Canada as the owner of the copyright in the document, through a reference citing AAFC, the title of the document and the year. Where the reproduction or redistribution includes data from this document, it must also include an acknowledgement of the specific data source(s), as noted in this document.
Agriculture and Agri-Food Canada provides this document and other report services to agriculture and food industry clients free of charge.