

Note: This report includes forecasting data that is based on baseline historical data.
Executive summary
Out of 11.6 million households owning a dog or a cat in the Philippines, 85.2% possessed a dog(s) versus 14.8% of households with a cat(s) in 2021. Over this period in the Philippines, the pet population consisted of 2.1 million cats, 17.0 million dogs (majority small dog - 76.4%), 88.4 thousand birds, 39.1 million fish, 5.4 thousand small mammals, and 7.2 thousand of reptiles.
In 2021, the Philippines imported a total of US$177.2 million (161.1 thousand tonnes) from the world in dog and cat food products, put up for retail sale - growing at a value compound annual growth rate (CAGR) of 31.8% (2018-2021). Top supplier markets included Thailand (US$73.7 million), United States (US$26.7 million), and Australia (US$25.1 million). Canada ranked as the 10th largest supplier to the Philippines at US$879.7 thousand in 2021, with a CAGR of 3.3% (2018-2021).
Pet food retail sales in the Philippean market totalled US$359.6 million in 2021, with a high CAGR of 26.8% between 2016 and 2021. Dog food sales accounted for 83.7% of the value market share within the sector, followed by cat food (15.2%), fish food (0.8%), bird food (0.3%), and a minimal amount of small mammal/reptile food (0.008%) in 2021.
In 2021, leading companies in the pet food sector in the Philippines included Mars inc. with both its dog/cat food brands (Pedigree/Whiskas) at a total of US$148.7 million or 41.4% value share; along with dog food companies including the Charoen Pokphand Group (SmartHeart) at US$43.6 million (12.1%) and Consumer Care Products Inc. (Vitality) at US$37.6 million (10.5%).
Top other pet food companies (brand) in 2021 for fish food were Spectrum Brands Holdings Inc. (Tetra) at a total of US$0.7 million or 0.2% value share; bird and small mammal/reptile food: Bio Research Inc. (Bio-Min) at US$0.2 million (0.06%) and US$3.0 thousand (0.0%), respectively. Private labels were only registered in the dog food sector holding a 1.0% market share at a value of US$3.0 million in 2021.
Sector overview: Pet population and ownership
In 2021, the total cat (2.1 million) & dog (17.0 million) population in the Philippines was around 19.1 million, equivalent to 1.7 million households (6.5%) owning a cat and 9.9 million households (37.5%) owning a dog. The number of households owning a cat has increased by a CAGR of 3.0% with its cat population increasing by 1.8% (2016-2021). Meanwhile the number of households owning a dog has increased by a CAGR of 2.9% with its dog population increasing by 3.4% over the same period - consisting of small (76%), medium (16%), and large (8%) dogs in 2021.
The other Philippean pet population consisting of birds (88.4 thousand), fish (39.1 million), small mammals (5.4 thousand), and reptiles (7.2 thousand) totalled around 39.2 million in 2021. The other pet population has increased by a CAGR of 3.2% (2016-2021) and is expected to slightly increase by 3.3% (2021-2026).
Philippean demand for a wide range of specialized pet products with value-added health, wellbeing or hygiene claims has increased with more time spent at home during the pandemic crisis, reinforced by the strong pet humanisation trend. Pet products amongst owners of cats and dogs such as grooming tools, dietary supplements, cat litter, and tick/flea soaps or shampoos are becoming even more popular, especially since pet owners had limited opportunity to visit grooming salons during the lockdown restriction period and decided to take self-petcare on themselves. Moreover, pet products are seeing a slightly improved growth rate in 2022 compared with the previous year, while a contributing factor has been due to rising rates in pet adoption.Footnote 1
The pet humanisation trend to extend human products into pet products has resulted in more focus going towards innovative natural (no artificial chemicals, fragrances) and environmental or sustainable (biodegradable) pet products. The demand for convenience in the midst of busy modern lifestyles has also, led to the development of an expanding range of hi-tech gadgets in pet products like automatic or Smart Wi-Fi feeder brands, dog bowls that weigh the food on a digital scale or products like a Smart Fountain that has a filter and UV light to kill water bacteria that also, runs on a timer to dispense water at set times.
In addition, since many pet owners were forced to groom their pet in the home during lockdowns, the home-grooming trend is expected to last beyond COVID-19. As consumers have grown more accustomed and comfortable in the process, this will help support sales in self-care grooming products even as owners re-gain access to professional groomers outside the home.Footnote 1
| Categorization type (unit) | 2016 | 2017 | 2018 | 2019 | 2020 | 2021 | CAGR* % 2016-2021 |
|---|---|---|---|---|---|---|---|
| Households owning a cat (%) | 6.3 | 6.4 | 6.4 | 6.5 | 6.5 | 6.5 | 0.6 |
| Households owning a cat ('000) | 1,483.3 | 1,533.2 | 1,585.9 | 1,641.5 | 1,679.7 | 1,717.9 | 3.0 |
| Households owning a dog (%) | 36.3 | 36.3 | 36.3 | 36.4 | 36.9 | 37.5 | 0.7 |
| Households owning a dog ('000) | 8,535.0 | 8,748.7 | 8,963.0 | 9,173.5 | 9,506.3 | 9,865.1 | 2.9 |
| Source: Euromonitor, 2022 | |||||||
| Categorization type | 2016 | 2021 | CAGR* % 2016-2021 | 2022 | 2026 | CAGR* % 2021-2026 |
|---|---|---|---|---|---|---|
| Total - dog and cat population | 16,257.8 | 19,078.3 | 3.3 | 19,890.3 | 23,538.1 | 4.3 |
| Cat population | 1,895.3 | 2,068.6 | 1.8 | 2,130.5 | 2,393.3 | 3.0 |
| Subtotal - dog population | 14,362.5 | 17,009.8 | 3.4 | 17,759.8 | 21,144.7 | 4.4 |
| Small dog (up to 20 pounds or 9 kilograms) | 10,522.6 | 12,987.1 | 4.3 | 13,593.5 | 16,331.3 | 4.7 |
| Medium dog (20-50 pounds or 9-23 kilograms) | 2,413.3 | 2,660.6 | 2.0 | 2,760.2 | 3,210.1 | 3.8 |
| Large dog (over 50 pounds or over 23 kilograms) | 1,426.6 | 1,362.1 | −0.9 | 1,406.1 | 1,603.3 | 3.3 |
| Total - other pet population | 33,513.2 | 39,155.4 | 3.2 | 40,497.8 | 45,996.6 | 3.3 |
| Bird population | 84.0 | 88.4 | 1.0 | 89.4 | 94.0 | 1.2 |
| Fish population | 33,417.4 | 39,054.5 | 3.2 | 40,395.7 | 45,889.1 | 3.3 |
| Subtotal - small mammal/reptile | 11.9 | 12.5 | 1.0 | 12.7 | 13.5 | 1.6 |
| Small mammal population | 4.8 | 5.4 | 2.4 | 5.5 | 6.3 | 3.1 |
| Reptile population | 7.1 | 7.2 | 0.3 | 7.2 | 7.2 | 0.0 |
|
Source: Euromonitor, 2022 *CAGR: Compound Annual Growth Rate. Base year for growth rate is 2021, which is actual retail value sales. |
||||||
Trade of retail dog and cat food products in the Philippines
In 2021, the global retail dog and cat food sector totalled an import value of US$20.6 billion (9,671.4 thousand tonnes). Leading global import markets were Germany (US$2.0 billion), the United States (US$1.5 billion), and Poland (US$1.1 billion). Following the United Kingdom (US$1.12 billion), Canada was the 5th largest importer of dog/cat food products at a value of US$1.06 billion (411.8 thousand tonnes) in 2021.
Amongst the top 10 markets in the world with a market share of 53.2%, all of these importers of retail dog and cat food products have been growing by a total CAGR of 12.5% (US$11 billion) over the last 4 years (2018-2021). Leading markets with the highest growth over this period, was Poland at a CAGR of 26.3%, followed by the US (16.0%), and Canada (15.9%).
| Country | 2018 | 2019 | 2020 | 2021 | CAGR* % 2018-2021 | Market share in 2021 (%) |
|---|---|---|---|---|---|---|
| Total - dog/cat food, up for retail sale | 14,116.3 | 15,030.3 | 17,605.1 | 20,618.6 | 13.5 | 100.0 |
| 1. Germany | 1,465.2 | 1,514.7 | 1,684.4 | 1,973.7 | 10.4 | 9.6 |
| 2. United States | 982.3 | 1,027.9 | 1,231.8 | 1,534.1 | 16.0 | 7.4 |
| 3. Poland | 570.1 | 695.5 | 988.3 | 1,149.2 | 26.3 | 5.6 |
| 4. United Kingdom | 878.8 | 927.3 | 1,006.1 | 1,122.7 | 8.5 | 5.4 |
| 5. Canada | 683.1 | 799.9 | 898.2 | 1,064.1 | 15.9 | 5.2 |
| 6. France | 701.4 | 719.9 | 902.0 | 1,053.4 | 14.5 | 5.1 |
| 7. Italy | 630.5 | 677.4 | 705.0 | 847.8 | 10.4 | 4.1 |
| 8. Netherlands | 637.9 | 610.7 | 699.2 | 781.0 | 7.0 | 3.8 |
| 9. Belgium | 504.9 | 513.2 | 657.1 | 731.9 | 13.2 | 3.5 |
| 10. Japan | 643.5 | 646.1 | 673.7 | 701.7 | 2.9 | 3.4 |
| Subtotal - top 10 importers | 7,697.6 | 8,132.5 | 9,445.8 | 10,959.6 | 12.5 | 53.2 |
|
Source: Global Trade Tracker, 2022 *CAGR: Compound Annual Growth Rate |
||||||
| Country | 2018 | 2019 | 2020 | 2021 | CAGR* % 2018-2021 | Market share in 2021 (%) |
|---|---|---|---|---|---|---|
| Total - dog/cat food, up for retail sale | 7,362,926 | 7,740,180 | 8,592,822 | 9,671,413 | 9.5 | 100.0 |
| 1. Germany | 694,657 | 740,605 | 780,124 | 820,764 | 5.7 | 8.5 |
| 2. Spain | 179,215 | 210,644 | 238,405 | 566,265 | 46.7 | 5.9 |
| 3. United Kingdom | 520,952 | 528,321 | 544,068 | 562,351 | 2.6 | 5.8 |
| 4. France | 386,936 | 407,619 | 469,284 | 521,475 | 10.5 | 5.4 |
| 5. Poland | 290,350 | 328,294 | 431,634 | 499,160 | 19.8 | 5.2 |
| 6. Canada | 273,625 | 334,937 | 377,854 | 411,766 | 14.6 | 4.3 |
| 7. Belgium | 314,022 | 353,461 | 380,277 | 400,029 | 8.4 | 4.1 |
| 8. Italy | 341,866 | 357,322 | 319,423 | 394,276 | 4.9 | 4.1 |
| 9. United States | 253,912 | 248,039 | 292,372 | 317,257 | 7.7 | 3.3 |
| 10. Romania | 179,166 | 214,757 | 275,840 | 302,191 | 19.0 | 3.1 |
| Subtotal - top 10 importers | 3,434,701 | 3,723,999 | 4,109,281 | 4,795,534 | 11.8 | 49.6 |
| 11. Netherlands | 272,697 | 273,090 | 281,915 | 296,614 | 2.8 | 3.1 |
| 13. Japan | 219,422 | 212,646 | 217,924 | 221,558 | 0.3 | 2.3 |
|
Source: Global Trade Tracker, 2022 *CAGR: Compound Annual Growth Rate |
||||||
In 2021, the Philippines imported a total value of US$177.2 million (161.1 thousand tonnes) of retail dog and cat food products from the world. Leading suppliers to the Philippines were Thailand (US$73.7 million), the United States (US$26.7 million), and Australia (US$25.1 million). Canada was the 10th largest exporter of dog/cat food products at a value of US$879,736 (959 metric tonnes) in 2021, growing by a value CAGR of 3.3% (2018-2021).
The total Philippean dog/cat food import sector grew by a CAGR of 31.8% between 2018-2021. Leading markets with the highest growth over this period were China (323.8%), followed by Malaysia (152.5%), and Austria (83.3%). Amongst the top suppliers to the Philippines, South Africa is the only market with a declining CAGR of 14.0% (2018-2021).
| Country | 2018 | 2019 | 2020 | 2021 | CAGR* % 2018-2021 | Market share in 2021 (%) |
|---|---|---|---|---|---|---|
| Total - dog/cat food, up for retail sale | 77.4 | 95.9 | 114.5 | 177.2 | 31.8 | 100.0 |
| 1. Thailand | 28.1 | 38.8 | 51.6 | 73.7 | 38.0 | 41.6 |
| 2. United States | 23.7 | 23.8 | 21.8 | 26.7 | 4.0 | 15.0 |
| 3. Australia | 12.4 | 17.0 | 14.1 | 25.1 | 26.4 | 14.2 |
| 4. China | 0.3 | 1.4 | 8.0 | 20.9 |
323.8 |
11.8 |
| 5. Italy | 3.6 | 6.1 | 9.9 | 15.9 | 64.2 | 9.0 |
| 6. France | 1.1 | 1.6 | 2.1 | 4.9 | 63.3 | 2.8 |
| 7. Malaysia | 0.1 | 0.226 | 0.884 | 1.9 | 152.5 | 1.1 |
| 8. Austria | 0.2 | 0.466 | 0.759 | 1.3 | 83.3 | 0.7 |
| 9. South Africa | 1.8 | 2.3 | 2.5 | 1.2 | −14.0 | 0.7 |
| 10. Canada | 0.8 | 0.880 | 0.643 | 0.880 | 3.3 | 0.5 |
| Subtotal - top 10 suppliers | 72.2 | 92.6 | 112.2 | 172.4 | 33.7 | 97.3 |
|
Source: Global Trade Tracker, 2022 *CAGR: Compound Annual Growth Rate |
||||||
| Country | 2018 | 2019 | 2020 | 2021 | CAGR* % 2018-2021 | Market share in 2021 (%) |
|---|---|---|---|---|---|---|
| Total - dog/cat food, up for retail sale | 80,606 | 93,957 | 108,475 | 161,084 | 26.0 | 100.0 |
| 1. Thailand | 22,955 | 29,794 | 38,908 | 53,551 | 32.6 | 33.2 |
| 2. United States | 34,924 | 35,940 | 33,312 | 40,243 | 4.8 | 25.0 |
| 3. China | 182 | 1,380 | 8,991 | 22,833 | 400.6 | 14.2 |
| 4. Australia | 10,758 | 14,048 | 11,498 | 19,268 | 21.4 | 12.0 |
| 5. Italy | 3,657 | 5,681 | 8,450 | 12,699 | 51.4 | 7.9 |
| 6. Malaysia | 96 | 216 | 1,356 | 3,128 | 219.4 | 1.9 |
| 7. France | 699 | 873 | 1,080 | 2,522 | 53.4 | 1.6 |
| 8. Canada | 876 | 891 | 655 | 959 | 3.1 | 0.6 |
| 9. Brazil | 869 | 800 | 407 | 783 | −3.4 | 0.5 |
| 10. Austria | 118 | 281 | 440 | 629 | 74.7 | 0.4 |
| Subtotal - top 10 suppliers | 75,134 | 89,904 | 105,097 | 156,615 | 27.7 | 97.2 |
| 11. South Africa | 1,084 | 1,197 | 1,240 | 625 | −16.8 | 0.4 |
|
Source: Global Trade Tracker, 2022 *CAGR: Compound Annual Growth Rate |
||||||
Pet food retail sales in the Philippines
In 2021, pet food retail sales in the Philippean market totalled US$359.6 million with a high CAGR of 26.8% between 2016 and 2021. Dog food sales accounted for 83.7% of the market share within the sector, followed by cat food (15.2%), fish food (0.8%), bird food (0.3%), and a minimal amount of small mammal/reptile food (0.008%) in 2021.
Pet food sales between 2021 and 2026 are expected to return to a moderate level at a CAGR of 9.2% to reach a value of US$557.6 million in 2026. Over this period, cat food is expected to slightly increase in value share to reach 17.5% compared to dog food at 81.5% in 2026. Meanwhile in the last forecast year, fish food will reach a slightly lower market share of 0.7%; similarly, for bird food at 0.25%.
| Category | 2016 | 2021 | CAGR* % 2016-2021 | 2022 | 2026 | CAGR* % 2021-2026 |
|---|---|---|---|---|---|---|
| Total - pet food | 109.7 | 359.6 | 26.8 | 392.0 | 557.6 | 9.2 |
| Subtotal - dog and cat food | 106.5 | 355.4 | 27.3 | 387.6 | 552.1 | 9.2 |
| Cat food | 20.7 | 54.5 | 21.4 | 60.6 | 97.7 | 12.4 |
| Dog food | 85.9 | 301.0 | 28.5 | 327.0 | 454.5 | 8.6 |
| Subtotal - other pet food | 3.1 | 4.2 | 6.3 | 4.4 | 5.5 | 5.5 |
| Bird food | 0.9 | 1.1 | 4.1 | 1.2 | 1.4 | 4.9 |
| Fish food | 2.2 | 3.0 | 6.4 | 3.2 | 4.0 | 5.9 |
| Small mammal/reptile food | 0.028 | 0.030 | 1.4 | 0.030 | 0.033 | 2.1 |
|
Source: Euromonitor, 2022 *CAGR: Compound Annual Growth Rate |
||||||
Dog food trends
Retail sales of dog food in the Philippines totalled US$301 million in 2021, with sales of dry dog food consisting of 69.0%, wet dog food (28.7%) and dog treat & mixers (2.3%). Over this year, mid-priced dry dog food (US$91.1 million) registered the largest sales, followed by economy dry (US$80 million) and premium dry (US$36.6 million). Meanwhile, premium wet dog food (US$37.3 million) was more popular over mid-priced wet (US$28.1 million) and economy wet (US$21.1 million).
In 2026, total retail sales in dog food is expected to reach US$454.5 million growing at a CAGR of 8.6% (2021-2026). Dry dog food sales is expected to represent 70.5%, followed by wet dog food (27.7%) and dog treats & mixers (2.1%) in 2026. Pet owners are expected to move more frequently towards purchasing economy dry food versus mid-priced dry over the next 5-year period, while premium wet dog food is forecast to remain the largest in its wet dog food category.
Philippean pet owners chose to prepare 1.3% of its dog food for consumption, while 98.7% consisted of non-prepared dog food in 2021. Adult dry dog food was purchased the most often (57.4%) of the time, followed by pup dry (20.1%), senior dry (0.4%) in 2021 - with other dog dry (22.1%). Meanwhile, in the wet dog food category over the life-cycle of dogs, food products were distributed amongst adults (23.5%), pups (10.3%), seniors (0.5%), and remaining others (65.7%) over this year.
| Category | 2016 | 2017 | 2018 | 2019 | 2020 | 2021 |
|---|---|---|---|---|---|---|
| Total - dog food | 85.9 | 96.0 | 126.1 | 187.2 | 222.8 | 301.0 |
| Dog treats and mixers | 1.3 | 1.4 | 1.5 | 2.0 | 2.7 | 6.8 |
| Subtotal - dry dog food | 61.4 | 69.1 | 90.1 | 134.1 | 161.7 | 207.7 |
| Economy dry | 26.2 | 30.1 | 38.5 | 53.5 | 59.5 | 80.0 |
| Mid-priced dry | 24.8 | 27.8 | 36.1 | 53.1 | 73.0 | 91.1 |
| Premium dry | 10.4 | 11.2 | 15.6 | 27.5 | 29.2 | 36.6 |
| Subtotal - wet dog food | 23.3 | 25.4 | 34.5 | 51.1 | 58.4 | 86.4 |
| Economy wet | 1.4 | 1.6 | 2.7 | 4.0 | 8.1 | 21.1 |
| Mid-priced wet | 10.1 | 11.1 | 14.0 | 18.5 | 19.9 | 28.1 |
| Premium wet | 11.7 | 12.8 | 17.8 | 28.6 | 30.4 | 37.3 |
|
Source: Euromonitor International, 2022 *CAGR: Compound Annual Growth Rate |
||||||
| Category | Annual growth % 2021/2020 | CAGR* % 2016-2021 | Total growth % 2016-2021 |
|---|---|---|---|
| Total - dog food | 35.1 | 28.5 | 250.4 |
| Dog treats and mixers | 151.9 | 39.2 | 423.1 |
| Subtotal - dry dog food | 28.4 | 27.6 | 238.3 |
| Economy dry | 34.5 | 25.0 | 205.3 |
| Mid-priced dry | 24.8 | 29.7 | 267.3 |
| Premium dry | 25.3 | 28.6 | 251.9 |
| Subtotal - wet dog food | 47.9 | 30.0 | 270.8 |
| Economy wet | 160.5 | 72.0 | 1407.1 |
| Mid-priced wet | 41.2 | 22.7 | 178.2 |
| Premium wet | 22.7 | 26.1 | 218.8 |
|
Source: Euromonitor International, 2022 *CAGR: Compound Annual Growth |
|||
| Category | 2021 | 2022 | 2023 | 2024 | 2025 | 2026 |
|---|---|---|---|---|---|---|
| Total - dog food | 301.0 | 327.0 | 355.2 | 385.4 | 418.3 | 454.5 |
| Dog treats and mixers | 6.8 | 7.3 | 7.8 | 8.3 | 8.9 | 9.4 |
| Subtotal - dry dog food | 207.7 | 226.5 | 246.8 | 268.7 | 292.8 | 319.3 |
| Economy dry | 80.0 | 88.7 | 98.4 | 109.2 | 121.2 | 134.9 |
| Mid-priced dry | 91.1 | 98.5 | 106.3 | 114.4 | 122.9 | 132.0 |
| Premium dry | 36.6 | 39.2 | 42.1 | 45.2 | 48.6 | 52.4 |
| Subtotal - wet dog food | 86.4 | 93.3 | 100.6 | 108.3 | 116.6 | 125.8 |
| Economy wet | 21.1 | 23.4 | 26.0 | 28.8 | 32.0 | 35.6 |
| Mid-priced wet | 28.1 | 30.2 | 32.5 | 35.0 | 37.8 | 40.8 |
| Premium wet | 37.3 | 39.6 | 42.1 | 44.5 | 46.9 | 49.3 |
|
Source: Euromonitor International, 2022 *CAGR: Compound Annual Growth Rate |
||||||
| Category | Annual growth % 2022/2021 | CAGR* % 2021-2026 | Total growth % 2021-2026 |
|---|---|---|---|
| Total - dog food | 8.6 | 8.6 | 51.0 |
| Dog treats and mixers | 7.4 | 6.7 | 38.2 |
| Subtotal - dry dog food | 9.1 | 9.0 | 53.7 |
| Economy dry | 10.9 | 11.0 | 68.6 |
| Mid-priced dry | 8.1 | 7.7 | 44.9 |
| Premium dry | 7.1 | 7.4 | 43.2 |
| Subtotal - wet dog food | 8.0 | 7.8 | 45.6 |
| Economy wet | 10.9 | 11.0 | 68.7 |
| Mid-priced wet | 7.5 | 7.7 | 45.2 |
| Premium wet | 6.2 | 5.7 | 32.2 |
|
Source: Euromonitor International, 2022 *CAGR: Compound Annual Growth |
|||
| Categorization type | 2016 | 2017 | 2018 | 2019 | 2020 | 2021 | 2022 |
|---|---|---|---|---|---|---|---|
| Prepared dog food | 0.8 | 0.8 | 0.9 | 1.0 | 1.1 | 1.3 | 1.5 |
| Non-prepared dog food | 99.3 | 99.2 | 99.1 | 99.0 | 98.9 | 98.7 | 98.5 |
| Source: Euromonitor International, 2022 | |||||||
| Category | Category type | 2016 | 2017 | 2018 | 2019 | 2020 | 2021 | 2022 |
|---|---|---|---|---|---|---|---|---|
| Dry dog food | Pup | 19.8 | 20.1 | 20.1 | 20.1 | 20.0 | 20.1 | 20.1 |
| Adult | 58.9 | 58.7 | 58.6 | 58.5 | 58.5 | 57.4 | 57.3 | |
| Senior | 0.5 | 0.5 | 0.5 | 0.5 | 0.5 | 0.4 | 0.4 | |
| Other | 20.9 | 20.7 | 20.8 | 20.9 | 21.0 | 22.1 | 22.2 | |
| Total - dry | 100.0 | 100.0 | 100.0 | 100.0 | 100.0 | 100.0 | 100.0 | |
| Wet dog food | Pup | 11.0 | 11.1 | 11.1 | 11.1 | 11.0 | 10.3 | 10.4 |
| Adult | 33.5 | 33.5 | 33.5 | 33.6 | 33.5 | 23.5 | 23.6 | |
| Senior | 0.6 | 0.6 | 0.6 | 0.6 | 0.6 | 0.5 | 0.4 | |
| Other | 54.8 | 54.7 | 54.7 | 54.6 | 54.8 | 65.7 | 65.5 | |
| Total - wet | 100.0 | 100.0 | 100.0 | 100.0 | 100.0 | 100.0 | 100.0 | |
| Source: Euromonitor International, 2022 | ||||||||
Cat food trends
Retail sales of cat food in the Philippines totalled US$54.1 million in 2021, with sales of wet cat food consisting for 63.9%, dry cat food (27%) and cat treat & mixers (9.1%). Over this year, mid-priced wet cat food (US$24.9 million) registered the largest sales, followed by premium wet (US$9.8 million). Similarly, mid-priced dry cat food (US$9.1 million) was more popular over premium dry (US$3.4 million) in 2021.
In 2026, total retail sales in cat food is expected to reach US$97.7 million growing at a CAGR of 12.4% (2021-2026). Wet cat food sales are expected to represent 62.5%, followed by dry cat food (28.8%) and cat treats & mixers (8.5%) in 2026. Mid-priced wet or dry cat food during the forecast period is expected to remain as the most popular format type over the premium wet or dry cat food categories.
Philippean pet owners chose to prepare 2.1% of its cat food for consumption, while 97.9% consisted of non-prepared cat food in 2021. In the wet cat food category over the life-cycle of cats, pet food products were purchased most amongst adults (45.1%), followed by kittens (15.2%), seniors (0.0%), and remaining others (39.7%) over this year. Meanwhile, adult dry cat food was purchased the most often (72.2%) of the time, then kitten dry (19.1%) and senior dry (0.5%) in 2021 - with other dry cat food (8.1%).
| Category | 2016 | 2017 | 2018 | 2019 | 2020 | 2021 |
|---|---|---|---|---|---|---|
| Total - cat food | 20.7 | 22.3 | 29.1 | 40.1 | 42.3 | 54.5 |
| Cat treats and mixers | 1.1 | 0.9 | 1.7 | 3.6 | 3.7 | 5.0 |
| Subtotal - dry cat food | 6.0 | 6.7 | 8.7 | 11.9 | 12.4 | 14.7 |
| Mid-priced dry | 4.7 | 5.2 | 6.7 | 9.0 | 9.1 | 9.9 |
| Premium dry | 1.3 | 1.5 | 2.1 | 3.0 | 3.4 | 4.7 |
| Subtotal - wet cat food | 13.6 | 14.8 | 18.7 | 24.6 | 26.1 | 34.8 |
| Mid-priced wet | 8.6 | 9.5 | 12.4 | 17.0 | 18.0 | 24.9 |
| Premium wet | 4.9 | 5.3 | 6.3 | 7.6 | 8.1 | 9.8 |
|
Source: Euromonitor International, 2022 *CAGR: Compound Annual Growth Rate |
||||||
| Category | Annual growth % 2021/2020 | CAGR* % 2016-2021 | Total growth % 2016-2021 |
|---|---|---|---|
| Total - cat food | 28.8 | 21.4 | 163.3 |
| Cat treats and mixers | 35.1 | 35.4 | 354.5 |
| Subtotal - dry cat food | 18.5 | 19.6 | 145.0 |
| Mid-priced dry | 8.8 | 16.1 | 110.6 |
| Premium dry | 38.2 | 29.3 | 261.5 |
| Subtotal - wet cat food | 33.3 | 20.7 | 155.9 |
| Mid-priced wet | 38.3 | 23.7 | 189.5 |
| Premium wet | 21.0 | 14.9 | 100.0 |
|
Source: Euromonitor International, 2022 *CAGR: Compound Annual Growth |
|||
| Category | 2021 | 2022 | 2023 | 2024 | 2025 | 2026 |
|---|---|---|---|---|---|---|
| Total - cat food | 54.5 | 60.6 | 68.4 | 77.1 | 86.8 | 97.7 |
| Cat treats and mixers | 5.0 | 5.5 | 6.1 | 6.8 | 7.5 | 8.3 |
| Subtotal - dry cat food | 14.7 | 16.8 | 19.2 | 21.8 | 24.8 | 28.2 |
| Mid-priced dry | 9.9 | 11.5 | 13.1 | 14.8 | 16.8 | 19.0 |
| Premium dry | 4.7 | 5.3 | 6.1 | 7.0 | 8.0 | 9.2 |
| Subtotal - wet cat food | 34.8 | 38.3 | 43.1 | 48.5 | 54.5 | 61.1 |
| Mid-priced wet | 24.9 | 27.2 | 30.6 | 34.2 | 38.3 | 42.9 |
| Premium wet | 9.8 | 11.1 | 12.6 | 14.2 | 16.1 | 18.3 |
|
Source: Euromonitor International, 2022 *CAGR: Compound Annual Growth Rate |
||||||
| Category | Annual growth % 2022/2021 | CAGR* % 2021-2026 | Total growth % 2021-2026 |
|---|---|---|---|
| Total - cat food | 11.2 | 12.4 | 79.3 |
| Cat treats and mixers | 10.0 | 10.7 | 66.0 |
| Subtotal - dry cat food | 14.3 | 13.9 | 91.8 |
| Mid-priced dry | 16.2 | 13.9 | 91.9 |
| Premium dry | 12.8 | 14.4 | 95.7 |
| Subtotal - wet cat food | 10.1 | 11.9 | 75.6 |
| Mid-priced wet | 9.2 | 11.5 | 72.3 |
| Premium wet | 13.3 | 13.3 | 86.7 |
|
Source: Euromonitor International, 2022 *CAGR: Compound Annual Growth |
|||
| Categorization type | 2016 | 2017 | 2018 | 2019 | 2020 | 2021 | 2022 |
|---|---|---|---|---|---|---|---|
| Prepared cat food | 1.6 | 1.7 | 1.7 | 1.8 | 1.9 | 2.1 | 2.3 |
| Non-prepared cat food | 98.4 | 98.3 | 98.3 | 98.2 | 98.1 | 97.9 | 97.7 |
| Source: Euromonitor International, 2022 | |||||||
| Category | Category type | 2016 | 2017 | 2018 | 2019 | 2020 | 2021 | 2022 |
|---|---|---|---|---|---|---|---|---|
| Dry cat food | Kitten | 19.3 | 19.3 | 19.3 | 19.2 | 19.2 | 19.1 | 19.1 |
| Adult | 74.0 | 73.9 | 73.4 | 72.4 | 72.5 | 72.2 | 72.1 | |
| Senior | 0.4 | 0.4 | 0.5 | 0.5 | 0.5 | 0.5 | 0.5 | |
| Other | 6.3 | 6.3 | 6.9 | 7.9 | 7.8 | 8.1 | 8.3 | |
| Total - dry | 100.0 | 100.0 | 100.0 | 100.0 | 100.0 | 100.0 | 100.0 | |
| Wet cat food | Kitten | 16.1 | 16.1 | 16.1 | 16.1 | 15.9 | 15.2 | 15.2 |
| Adult | 51.6 | 51.7 | 51.8 | 51.9 | 50.0 | 45.1 | 44.8 | |
| Senior | 0.2 | 0.2 | 0.2 | 0.2 | 0.2 | 0.0 | 0.0 | |
| Other | 32.1 | 32.0 | 31.9 | 31.8 | 33.9 | 39.7 | 40.0 | |
| Total - wet | 100.0 | 100.0 | 100.0 | 100.0 | 100.0 | 100.0 | 100.0 | |
| Source: Euromonitor International, 2022 | ||||||||
Other pet food trends: bird, fish, small mammal / reptile
In the Philippines in 2021, retail sales of other pet food products such as bird, fish, and small mammal/reptile food totalled US$4.2 million growing at a CAGR of 6.3% (2016-2021). Value sales of fish food consisted of US$3.0 million (72.7%), bird food at US$1.1 million (26.6%), and small mammal/reptile food at US$29.5 thousand (0.7%) in 2021.
In 2026, total retail sales in other pet food products in the Philippines are forecast to reach US$5.5 million growing at a CAGR of 5.5% (2021-2026). Forecast value sales of fish food will reach US$4.0 million (74%), bird food at US$1.4 million (25.4%), and small mammal/reptile food at US$32.8 thousand (0.6%) in 2026.
| Category | 2016 | 2017 | 2018 | 2019 | 2020 | 2021 |
|---|---|---|---|---|---|---|
| Total - other pet food | 3.1 | 3.3 | 3.5 | 3.7 | 3.9 | 4.2 |
| Bird food | 0.9 | 0.9 | 1.0 | 1.0 | 1.1 | 1.1 |
| Fish food | 2.2 | 2.3 | 2.5 | 2.7 | 2.8 | 3.0 |
| Small mammal/reptile food | 0.028 | 0.028 | 0.028 | 0.029 | 0.029 | 0.030 |
|
Source: Euromonitor International, 2022 *CAGR: Compound Annual Growth Rate |
||||||
| Category | Annual growth % 2021/2020 | CAGR* % 2016-2021 | Total growth % 2016-2021 |
|---|---|---|---|
| Total - other pet food | 7.7 | 6.3 | 35.5 |
| Bird food | 0.0 | 4.1 | 22.2 |
| Fish food | 7.1 | 6.4 | 36.4 |
| Small mammal/reptile food | 1.7 | 1.4 | 7.3 |
|
Source: Euromonitor International, 2022 *CAGR: Compound Annual Growth |
|||
| Category | 2021 | 2022 | 2023 | 2024 | 2025 | 2026 |
|---|---|---|---|---|---|---|
| Total - other pet food | 4.2 | 4.4 | 4.7 | 4.9 | 5.2 | 5.5 |
| Bird food | 1.1 | 1.2 | 1.2 | 1.3 | 1.3 | 1.4 |
| Fish food | 3.0 | 3.2 | 3.4 | 3.6 | 3.8 | 4.0 |
| Small mammal/reptile food | 0.030 | 0.030 | 0.031 | 0.031 | 0.032 | 0.033 |
|
Source: Euromonitor International, 2022 *CAGR: Compound Annual Growth Rate |
||||||
| Category | Annual growth % 2022/2021 | CAGR* % 2021-2026 | Total growth % 2021-2026 |
|---|---|---|---|
| Total - other pet food | 4.8 | 5.5 | 31.0 |
| Bird food | 9.1 | 4.9 | 27.3 |
| Fish food | 6.7 | 5.9 | 33.3 |
| Small mammal/reptile food | 1.7 | 2.1 | 11.2 |
|
Source: Euromonitor International, 2022 *CAGR: Compound Annual Growth |
|||
Competitive landscape in the pet food sector
In 2021, leading companies (top dog/cat brands) in the pet food sector in the Philippines included both dog/cat food company Mars Inc. (Pedigree/Whiskas) at a total of US$148.7 million or 41.4% value share; along with dog food companies including the Charoen Pokphand Group (12.1%) and Consumer Care Products Incorporation (10.5%).
Over the last year, leading dog food companies (top brand) specifically in the dog food sector in the Philippean market included Mars Inc. (Pedigree) at a total of US$111.3 million or 37.0% value share in its category, the Charoen Pokphand Group (SmartHeart) at US$43.6 million (14.5%), and Consumer Care Products Inc. (Vitality) at US$37.6 million (12.5%). Private labels were only registered in the dog food sector holding a 1.0% market share at a value of US$3.0 million in 2021.
In the dog food category in 2021, Nestlé despite having several dog food brands (Alpo, Hi-Pro, Pro Plan) were not as prominently found in the top 5 companies in the Philippines, which only held a 0.2% share in its dog food category at a value of US$0.1 million. Other dog food competitors (top brands) holding a higher value share over Nestlé included GuanChong Pet (Shanghai) Co. Ltd.(Aozi), Pet One Inc. (Pet One), Colgate-Palmolive Co. (Hill's Science Diet), Universal Robina Corp. (Bow Wow), and Ampro Pet Nutrition Inc. (Good Boy).
In 2021, leading cat food companies (top brand) in the Philippines included Mars Inc. (Whiskas) at a total of US$37.4 million or 68.7% value share in its category, Monge & C SpA (Monge) at US$5.8 million (10.6%), Inaba Pet Food Co. Ltd. (Ciao) at US$1.2 million (2.2%), and Nestlé at US$0.9 million (1.6%).
Reporting fish food companies (brand) in the Philippines included Spectrum Brands Holdings Inc. (Tetra) at a total of US$0.7 million or 22.2% value share in its category, Sera GmbH (Sera) at US$0.3 million (9.2%), and Bio Research Inc. (Bio-Gold) at US$0.2 million (6.5%) in 2021.
Bird food companies (brand) included Bio Research Inc. (Bio-Min) at a total of US$0.2 million or 14.6% value share in its category, Versele-Laga NV (Nutribird) at US$0.1 million (10.2%), and LST Summit Inc. (Edison) at US$0.1 million (6.5%) in 2021. Meanwhile, over the year, small mammal/reptile food company (brand) in the Philippines was Bio Research Inc. (Bio-Min) at US$3.0 thousand (7.9%) in its category.
| Category | Company | Brand(s) | Retail sales (US$ million) | Market share in 2021 (%) |
|---|---|---|---|---|
| Dog food | Mars Inc. | Pedigree, Royal Canin, Cesar, Eukanuba | 111.3 | 37.0 |
| Charoen Pokphand Group | SmartHeart, Jerhigh | 43.6 | 14.5 | |
| Consumer Care Products Inc. | Vitality | 37.6 | 12.5 | |
| Monge & C SpA | Monge | 26.2 | 8.7 | |
| San Miguel Corporation | Nutri Chunks | 18.1 | 6.0 | |
| Private label | Private label | 3.0 | 1.0 | |
| Others | Others | 46.6 | 15.5 | |
| Total - market share | 301.0 | 100.0 | ||
| Cat food | Mars Inc. | Whiskas, Sheba, Temptations, Royal Canin | 37.4 | 68.7 |
| Monge & C SpA | Monge | 5.8 | 10.6 | |
| Inaba Pet Food Co. Ltd. | Ciao | 1.2 | 2.2 | |
| Nestlé SA | Fancy Feast/Gourmet, Friskies | 0.9 | 1.6 | |
| Kit Cat International Pte Ltd. | Kit Cat | 0.3 | 0.6 | |
| Others | Others | 8.5 | 15.6 | |
| Total - market share | 54.5 | 100.0 | ||
| Bird food | Bio Research Inc. | Bio-Min | 0.2 | 14.6 |
| Versele-Laga NV | Nutribird | 0.1 | 10.2 | |
| LST Summit Inc. | Edison | 0.1 | 6.5 | |
| Others | Others | 0.8 | 68.7 | |
| Total - market share | 1.1 | 100.0 | ||
| Fish food | Spectrum Brands Holdings Inc. | Tetra | 0.7 | 22.2 |
| Sera GmbH | Sera | 0.3 | 9.2 | |
| Bio Research Inc. | Bio-Gold | 0.2 | 6.5 | |
| Others | Others | 1.9 | 62.2 | |
| Total - market share | 3.0 | 100.0 | ||
| Small mammal / reptile food | Bio Research Inc. | Bio-Min | 0.003 | 7.9 |
| Others | Others | 0.027 | 92.1 | |
| Total - market share | 0.030 | 100.0 | ||
|
Source: Euromonitor, 2022 *CAGR: Compound Annual Growth Rate |
||||
Retail distribution channels of pet food (off-trade)
In the Philippines, distribution of pet food products within store-based retailer outlets had the largest sales - more specifically within grocery retailers at a value of US$194.4 million in 2021 (up 5.4 percentage points), followed by non-grocery specialists at US$106.4 million (down 10.4 percentage points) since 2016. Within grocery retailer outlets that held a market share of 54.1%, modern supermarkets (34.5%) and hypermarkets (9.3%) combined were more popular channels for pet food sales over traditional grocery retailers (10.3%) in 2021. Last year, pet shops held the majority of the sales (26.2%) over home improvement & gardening stores (2.7%) within non-grocery specialist outlets totalling a market share of 29.6%.
In 2021, non-store e-commerce retailing registered a sales value of US$40.1 million, accounting for 11.2% (up 5.7 percentage points) since 2016. Meanwhile, non-retail veterinary clinics had sales of US$18.7 million (5.2%) in 2021 (down 0.7 percentage points) over the same period (2016 versus 2021).
| Outlet Type | 2016 | 2021 | ||
|---|---|---|---|---|
| Value | Share (%) | Value | Share (%) | |
| Total - retail channels | 109.7 | 100.0 | 359.6 | 100.0 |
| Store-based retail | 97.2 | 88.6 | 300.8 | 83.6 |
| Total - grocery retailers | 53.4 | 48.7 | 194.4 | 54.1 |
| Subtotal - modern grocery retailers | 41.1 | 37.5 | 157.4 | 43.8 |
| Hypermarkets | 7.9 | 7.2 | 33.4 | 9.3 |
| Supermarkets | 33.2 | 30.3 | 124.1 | 34.5 |
| Subtotal - traditional grocery retailers | 12.3 | 11.2 | 37.0 | 10.3 |
| Total - non-grocery specialists | 43.8 | 40.0 | 106.4 | 29.6 |
| Pet shops | 39.6 | 36.1 | 94.2 | 26.2 |
| Home improvement and gardening stores | 3.2 | 2.9 | 9.8 | 2.7 |
| Other non-grocery specialists | 1.0 | 0.9 | 2.5 | 0.7 |
| Non-store retailing (E-commerce) | 6.0 | 5.5 | 40.1 | 11.2 |
| Non-retail channels (veterinary clinics) | 6.5 | 5.9 | 18.7 | 5.2 |
| Source: Euromonitor International, 2022 | ||||
Product launch and trends analysis: dog and cat food
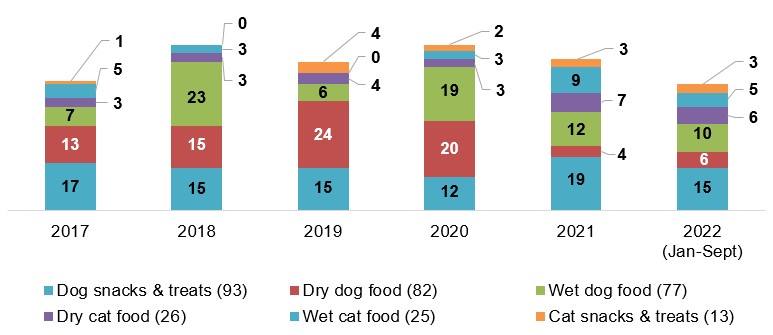
Mintel's Global New Products Database (GNPD) indicates that there were 316 new cat & dog food or treat products launched (including new variety/range extension, packaging, formulation or relaunched) in the Philippines between January 2017 and September 28, 2022.
The number of yearly product launches by category have generally remained stable with dry dog food products varying the most between 2017 and 2021 - starting at 13 new launches in 2017, peaking at 24 products in 2019, and ending at 4 new products in 2021. Overall, dog snacks & treats (93) were the largest dog/cat food/treat category to launch new products, followed by dry dog food (82), wet dog food (77), dry cat food (26), wet cat food (25), and cat snacks & treats at 13 new products (Jan. 2017 - Sept. 2022).
Description of above image
| Category | 2017 | 2018 | 2019 | 2020 | 2021 | 2022 (January-September) | Total |
|---|---|---|---|---|---|---|---|
| Dog snacks and treats | 17 | 15 | 15 | 12 | 19 | 15 | 93 |
| Dry dog food | 13 | 15 | 24 | 20 | 4 | 6 | 82 |
| Wet dog food | 7 | 23 | 6 | 19 | 12 | 10 | 77 |
| Dry cat food | 3 | 3 | 4 | 3 | 7 | 6 | 26 |
| Wet cat food | 5 | 3 | 0 | 3 | 9 | 5 | 25 |
| Cat snacks and treats | 1 | 0 | 4 | 2 | 3 | 3 | 13 |
Source: Mintel, 2022
Top parent companies launching cat/dog food products in the Philippines between 2017 and 2022 (Jan. - Sept.) were Nestlé - Purina Petcare (49), Mars Inc. (47), Mars Petcare (39), Dairy Farm International (29), and Rustan Supercenters (23). More recently between Q4-2021 vs. Q4-2022, top companies launching a total of 61 new products were Mars (11), Nestlé (9), Foshan Phoenix Pet Products (5), Inaba Foods (4), Perfect Companion Group (3) and Costco Wholesale (2).
Top pet food brands (Jan. 2017 - Sept. 2022) included VitaPet (19), PCG SmartHeart (12), Pet One (11), SureBuy (9), and DoggyMan (8). Recent new brands launched into the Philippean market (Aug.-Oct. 2022) were Nutri Chunks Maintenance (beef flavour adult dog food), Vita Bone (small multi-flavour treats for dogs of all sizes), Purina Friskies Surfin' Favourites (adult cat food), and Cesar Home Delights (beef stew canine cuisine).
Leading locations of manufacture for new cat/dog food products over the last 5.9 year period (2017-2022) were Thailand (41), the United States (17), China (15), Australia (8) and the Italy (8). Canada manufactured only two new wet dog food variety/range extension products over this period, which consisted of one brand in 2019 (Petcurean Go! Sensitivity + Shine) and the other brand (Nutram Total Grain-Free) in 2020.
Popular or top growing flavours (including blends) were beef (+600%), salmon (+100%), chicken (+33%), and tuna [Q4-2020 and Q4-2022]. Declining flavours during this period, were prawn/shrimp (-100%) and unflavoured/plain (-67%). New ingredients within the last 12 months included magnesium proteinate, Annatto, sardine flavour, zinc chelate of hydroxyl analogue of Methionine, Oregon grape root, feed additives, Lutein, cranberry extract, calcium ascorbate, and eyebright extract. Top packaging materials/types for these dog or cat products from the last 2 years (Q3-2021 vs. Q3-2022) were plastic unspecified (+200%) with declining packaging combinations of can/metal steel (-100%) and flexible in a stand-up pouch or multi laminate (-50%).
Meanwhile, top claim combinations associated with these new cat/dog food products used the most during the last three months were anti-tarter/tooth pet (63.6%), skin & coat health pet (54.6%), vitamins/mineral plus (54.6%), pet adult (45.5%), immune system support pet (45.4%), joint/bone/muscle pet (36.7%), ethical - recycling (18.2%), weight & muscle gain - functional pet (18.2%), breath-freshening (18.2%), and functional pet - digestion (18.2%). Trending claims were joints, bones & muscles (+400%), skin & coat (+200%), weight & muscle gain (+200%), and gluten free (+100%); with declining claims by 100% were ethical - toxins free, sugar free, pet - junior, low/no/reduced calorie, and premium between Q3-2021 and Q3-2022.
| Product attributes | Yearly launch counts | ||||||
|---|---|---|---|---|---|---|---|
| 2017 | 2018 | 2019 | 2020 | 2021 | 2022 | Total | |
| Yearly product launches | 46 | 59 | 53 | 59 | 54 | 45 | 316 |
| Top launch types | |||||||
| New variety/range extension | 26 | 31 | 25 | 26 | 25 | 21 | 154 |
| New product | 10 | 15 | 13 | 19 | 19 | 13 | 89 |
| New packaging | 4 | 8 | 12 | 11 | 5 | 10 | 50 |
| Relaunch | 3 | 4 | 3 | 2 | 2 | 1 | 15 |
| New formulation | 3 | 1 | 0 | 1 | 3 | 0 | 8 |
| Top sub-categories | |||||||
| Dog snacks & treats | 17 | 15 | 15 | 12 | 19 | 15 | 93 |
| Dog food - dry | 13 | 15 | 24 | 20 | 4 | 6 | 82 |
| Dog food - wet | 7 | 23 | 6 | 19 | 12 | 10 | 77 |
| Cat food - dry | 3 | 3 | 4 | 3 | 7 | 6 | 26 |
| Cat food - wet | 5 | 3 | 0 | 3 | 9 | 5 | 25 |
| Cat snacks & treats | 1 | 0 | 4 | 2 | 3 | 3 | 13 |
| Top five companies / parent | |||||||
| Nestlé - Purina PetCare | 20 | 3 | 4 | 4 | 8 | 10 | 49 |
| Mars | 8 | 6 | 7 | 7 | 10 | 9 | 47 |
| Mars Petcare | 7 | 5 | 5 | 5 | 10 | 7 | 39 |
| Dairy Farm International | 1 | 10 | 6 | 5 | 4 | 3 | 29 |
| Rustan Supercenters | 1 | 7 | 4 | 4 | 4 | 3 | 23 |
| Top five brands | |||||||
| VitaPet | 0 | 8 | 2 | 2 | 4 | 3 | 19 |
| PCG SmartHeart | 1 | 0 | 1 | 5 | 3 | 2 | 12 |
| Pet One | 1 | 2 | 4 | 2 | 1 | 1 | 11 |
| SureBuy | 0 | 4 | 3 | 2 | 0 | 0 | 9 |
| DoggyMan | 4 | 2 | 0 | 1 | 0 | 1 | 8 |
| Import status (if reported) | |||||||
| Imported | 21 | 20 | 17 | 22 | 17 | 16 | 113 |
| Not imported | 1 | 1 | 0 | 1 | 1 | 2 | 6 |
| Top five claims | |||||||
| Vitamin/mineral fortified | 9 | 29 | 27 | 25 | 19 | 23 | 132 |
| Pet - adult | 13 | 23 | 30 | 25 | 19 | 18 | 128 |
| Skin & coat (functional pet) | 16 | 23 | 24 | 25 | 11 | 16 | 115 |
| Joints, bones & muscles (functional pet) | 16 | 23 | 17 | 24 | 10 | 12 | 102 |
| Teeth & tartar prevention (functional pet) | 17 | 19 | 13 | 18 | 12 | 15 | 94 |
| Top five flavours (including blend) | |||||||
| Unflavoured/plain | 5 | 11 | 12 | 7 | 4 | 2 | 41 |
| Chicken | 4 | 3 | 4 | 6 | 9 | 7 | 33 |
| Beef | 2 | 2 | 4 | 3 | 3 | 6 | 20 |
| Lamb or lamb & rice | 3 | 6 | 4 | 6 | 4 | 1 | 24 |
| Tuna | 1 | 0 | 1 | 2 | 6 | 2 | 12 |
| Top package types | |||||||
| Flexible (stand-up pouch/sachet, stick-pack) | 39 | 30 | 42 | 45 | 36 | 30 | 222 |
| Can | 5 | 17 | 3 | 6 | 11 | 5 | 47 |
| Tray | 0 | 4 | 3 | 1 | 0 | 5 | 13 |
| Bag | 1 | 5 | 4 | 1 | 1 | 1 | 13 |
| Tub | 1 | 2 | 1 | 2 | 2 | 2 | 10 |
| Source: Mintel; Global New Product Database, 2022 | |||||||
Product examples
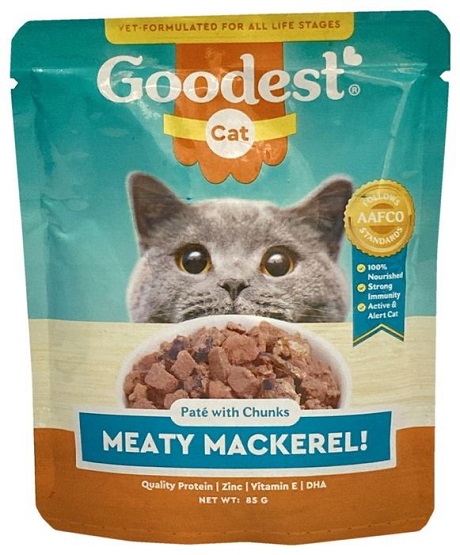
Meaty Mackerel! Paté with Chunks
Source: Mintel, 2022
| Company | General Odyssey |
|---|---|
| Brand | Goodest Cat |
| Sub-category | Cat food, wet |
| Country | Manufactured in Philippines, not imported |
| Related ingredients | Sardine, tuna, chicken by-products, wheat gluten, white fish |
| Claims | Vitamin / mineral fortified, functional pet – brain and nervous, immune system |
| Store name / type | Robinsons, supermarket |
| Store location | Fairview, Quezon City 1118 |
| Launch type | New product |
| Date published | February 2022 |
| Price in US dollars | 0.51 |
This cat food is made with real ocean fish, and is enriched with vitamins and minerals for complete nourishment and to meet the nutritional levels established by the Association of America Feed Control Officials Cat Food Nutrient Profiles for All Life Stages. The product provides quality protein, zinc, vitamin E and DHA for a 100% nourished, strong immunity and active and alert cats. The product retails in an 85 gram pack.
Calamari Flavour and Homestyle Broth Flavour Cat Treat

Source: Mintel, 2022
| Company | Thai Inaba Foods, Mikendre Corporation |
|---|---|
| Brand | Inaba Juicy Bites |
| Sub-category | Cat food, snacks and treats |
| Country | Manufactured in Thailand, market Philippines |
| Related ingredients | Chicken meat, tuna, natural kelp and calamari flavour, Cassava |
| Claims | No additives/preservatives, vitamin/mineral fortified, low/no/reduced allergens |
| Store name / type | Robinsons Handyman, mass merchandise / hypermarket |
| Store location | Quezon City 1118 |
| Launch type | New product |
| Date published | January 2021 |
| Price in US dollars | 2.18 |
This cat treat is 70% moist and features two flavours in one pack. The product with added vitamin E contains no artificial preservatives or grains. It retails in a 33.9 gram pack containing three 11.3 gram sachets.
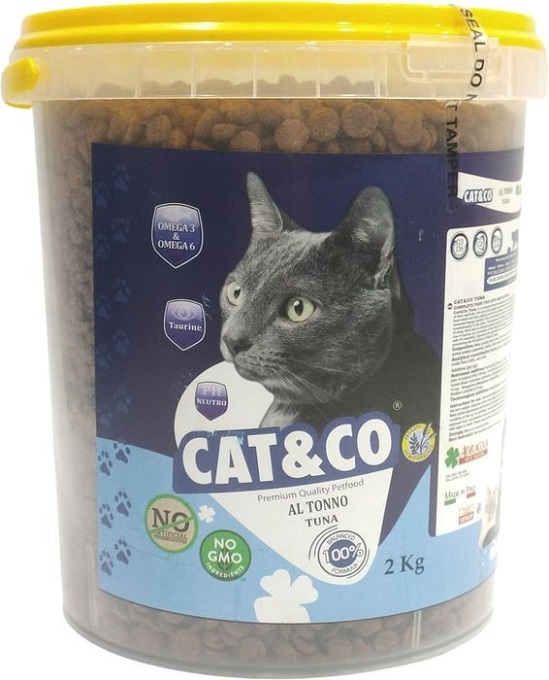
Tuna Flavour Cat Food
Source: Mintel, 2022
| Company | Adragna Pet Food |
|---|---|
| Brand | Cat&Co |
| Sub-category | Cat food, dry |
| Market | Manufactured in Italy, market Philippines |
| Related ingredients | Corn, poultry meal, wheat, fish meal, animal fat, meat meal, beet pulp |
| Claims | No additives / preservatives, premium, vitamin / mineral fortified, functional pet – eyesight, heart and cardiovascular, immune system, skin and coat, urinary tract |
| Store name / type | Waltermart, supermarket |
| Store location | North EDSA, Quezon City 1105 |
| Launch type | New product |
| Date published | May 2022 |
| Price in US dollars | 7.18 |
This cat food is said to feature a balanced formula tha contains omega 3 and 6 that contribute to the maintenance of shiny hair and an efficient immune system with vitamin E; taurine for the protection of the heart, eyesight; and pH neutrality for the good functioning of the urinary system and preventing the formation of kidney stones. The premium quality product is free from artificial preservatives and GMO ingredients, suitable for feeding cats on their early months of life to the end of their adult life, and retails in a 2 kilogram pack.
Mix Flavour Small Bone Dog Snacks

Source: Mintel, 2022
| Company | Foshan Phoenix Pet Products |
|---|---|
| Brand | Howbone |
| Sub-category | Dog snacks and treats |
| Country | Manufactured in China, market Philippines |
| Related ingredients | Wheat flour, oat fibre |
| Claims | No additives / preservatives, all natural, low / no / reduced sodium, vitamin / mineral fortified, no added sugar |
| Store name / type | Furry Tails-SM North Edsa, specialist retailer |
| Store location | SM Fairview, Quezon City 1108 |
| Launch type | New product |
| Date published | July 2022 |
| Price in US dollars | 4.44 |
This dog treat is said to be made with all natural ingredients and added vitamins, minerals, nutrient of chondroitin sulphate, and glucosamine to support a healthy life, without adding salt, sugar or artificial preservatives. The product is suitable for petite size dogs aged less than six months, and retails in a 270 gram pack containing 30 pieces.
T23 Chicken & Turkey Recipe Dog Food

Source: Mintel, 2022
| Company | Nutram Pet Products |
|---|---|
| Brand | Nutram Total Grain-Free |
| Sub-category | Dog food, wet |
| Country | Manufactured in Canada, market Philippines |
| Related ingredients | Chicken meat, turkey, peas, liver, pulses, chickpea, quinoa, kale, blue / black / cranberry, apple |
| Claims | Vitamin / mineral fortified, low / no / reduced allergen |
| Store name / type | Pet Express, specialist retailer |
| Store location | Taguig 1634 |
| Launch type | New variety / range extension |
| Date published | November 2020 |
| Price in US dollars | 3.11 |
This chicken and turkey recipe dog food is prepared for all life stages. The product is said to have optimum combination of a majority of natural components, with added vitamins, minerals and other trace nutrients. It retails in a 369 gram BPA-free can.
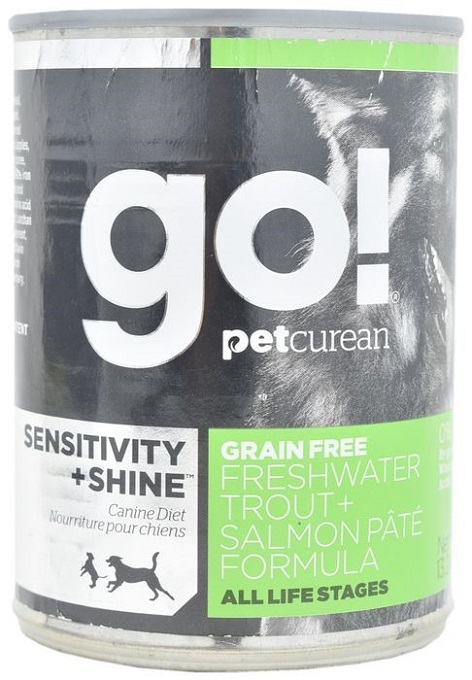
Grain Free Freshwater Trout + Salmon Paté Formula Dog Food
Source: Mintel, 2022
| Company | Petcurean Pet Nutrition |
|---|---|
| Brand | Petcurean Go! Sensitivity + Shine |
| Sub-category | Dog food, wet |
| Country | Manufactured by Canada, market Philippines |
| Related ingredients | Trout, salmon, herring meal, potato, peas, carrot, red pepper, spinach, apple, blueberry, cranberry, alfalfa sprouts, pumpkin purée, broccoli, banana |
| Claims | No additives / preservatives, low / no / reduced allergen |
| Store name / type | Dogs & The City, specialist retailer |
| Store location | Taguig 1634 |
| Launch type | New variety / range extension |
| Date published | January 2019 |
| Price in US dollars | 3.02 |
This grain free freshwater trout and salmon pâté formula dog food is suitable for all life stages and is ideal for dogs with sensitivities. This canine diet food contain 0% by-product meals, wheat, corn, beef, soy or artificial preservatives, and retails in a 374 gram pack.
For more information
The Canadian Trade Commissioner Service:
International Trade Commissioners can provide Canadian industry with on-the-ground expertise regarding market potential, current conditions and local business contacts, and are an excellent point of contact for export advice.
More agri-food market intelligence:
International agri-food market intelligence
Discover global agriculture and food opportunities, the complete library of Global Analysis reports, market trends and forecasts, and information on Canada's free trade agreements.
Agri-food market intelligence service
Canadian agri-food and seafood businesses can take advantage of a customized service of reports and analysis, and join our email subscription service to have the latest reports delivered directly to their inbox.
More on Canada's agriculture and agri-food sectors:
Canada's agriculture sectors
Information on the agriculture industry by sector. Data on international markets. Initiatives to support awareness of the industry in Canada. How the department engages with the industry.
For additional information on the upcoming India International Pet Trade Fair, please contact the Trade Commissioner Services in Mumbai – Agriculture and processed foods.
Resources
- Euromonitor, 2022. Data statistics (2016-2026)
- Euromonitor | May 2022. Country report: Pet Products in the Philippines
- Global Trade Tracker, 2022
- Mintel Global New Products Database, 2022
Sector Trend Analysis – Pet food in the Philippines
Global Analysis Report
Prepared by: Erin-Ann Chauvin, Senior Market Analyst
© His Majesty the King in Right of Canada, represented by the Minister of Agriculture and Agri-Food (2023).
Photo credits
All photographs reproduced in this publication are used by permission of the rights holders.
All images, unless otherwise noted, are copyright His Majesty the King in Right of Canada.
To join our distribution list or to suggest additional report topics or markets, please contact:
Agriculture and Agri-Food Canada, Global Analysis1341 Baseline Rd, Tower 5, 3rd floor
Ottawa ON K1A 0C5
Canada
Email: aafc.mas-sam.aac@agr.gc.ca
The Government of Canada has prepared this report based on primary and secondary sources of information. Although every effort has been made to ensure that the information is accurate, Agriculture and Agri-Food Canada (AAFC) assumes no liability for any actions taken based on the information contained herein.
Reproduction or redistribution of this document, in whole or in part, must include acknowledgement of agriculture and agri-food Canada as the owner of the copyright in the document, through a reference citing AAFC, the title of the document and the year. Where the reproduction or redistribution includes data from this document, it must also include an acknowledgement of the specific data source(s), as noted in this document.
Agriculture and Agri-Food Canada provides this document and other report services to agriculture and food industry clients free of charge.