

Note: This report includes forecasting data that is based on baseline historical data.
Executive summary
In 2023, Canada exported a total of Can$2.4 billion (423.7 thousand tonnes) of plant-based and animal protein ingredients from the world. The top global import markets for these protein ingredients from Canada were the United States (77.4%), South Korea (4.1%), and China (2.4%) in 2023.
The market size in terms of volume sales for non-animal derived proteins in Canada accounted for 43.6 thousand tonnes (market share: ~75%) in 2023, while animal derived proteins totaled 13.3 thousand tonnes (~23%). Demand for plant-based protein products with the highest market share was for soy protein concentrate (51.9%), followed by gluten (31.1%), soy protein isolate (10.4%), pea protein (5.6%), and vegetable proteins (1.0%). In general, these plant-based protein ingredients with the highest volume sales and consumed the most were found within the staple food category, especially for protein found in processed meat and seafood substitutes (including tofu and derivatives) and baked goods. Snacks were the second highest category in demand for non-animal derived protein ingredient sales, specifically protein found in plant-based cereal and protein energy bars; followed by dairy products and alternatives (plant-based soy drinks, yoghurt and cheese) and the cooking ingredients and meals category (plant-based ready meals, pizza, and food kits) in 2023.
Products in Canada with a high source of protein ingredients (animal or non-animal derived) registered total packaged food sales of Can$1.3 billion and plant-based products (Can$1.6 billion) in 2022. High in protein food sub-categories that had the highest sales included dairy and plant-based products (including cheese, milk drinks, dairy desserts) at a sales value of Can$375.5 million, followed by ready meals (Can$338.9 million), and processed meat, seafood and alternatives to meat (including tofu and derivatives) at a sales value of Can$233.8 million. Top plant-based product sub-categories included plant-based milk (Can$519.1 million), plant-based butter and spreads (Can$198.8 million), and meat and seafood substitutes (Can$160 million) in 2022.
In the Americas region, meat substitute brands are tapping into consumer demand for meatier (animal-protein-like) options with meat-like flavours and textures. Natural claims have declined in meat substitutes even though consumers continue to be concerned about the highly processed nature of these meat-less recipes (Mintel: A year of innovation in meat substitutes and eggs, 2023).
Global consumer trends – proteinFootnote 1
Globally, consumers link protein with various health benefits. Although, consuming meat is still the most natural way to obtain the proteins necessary for a balanced nutritional diet: taste, texture and cost are key barriers why consumers are moving towards choosing alternative proteins. The willingness to consume plant-based eating and alternative proteins have seen high growth, however, the category also faces similiar barriers - especially in taste, sensory and nutritional-related factors. The introduction of new technologies is helping to overcome these barriers for alternative proteins, making the category more attractive. Yet, protein produced via precision fermentation may disrupt the alternative protein category as its sensory and nutritional profiles are a closer match to that of the equivalent animal product.
Furthermore, plant-based protein offerings are now available beyond the usual soy options, where innovative technologies for the extraction of protein from algae, fungi and insects (fungi-based meat) have also, helped to grow the category in various markets - in China 50% are more attracted to fungus-based meat, 78% of Thai consumers are interested in seaweed instead of meat protein and 21% of United Kingdom (UK) consumers are willing to try high-protein products made with insect proteins. Between 2013 and 2023, China (23%) had the highest number of granted patents related to alternative protein, followed by the United States (7%), Japan (5%), France (5%), and South Korea (5%).
Consumers also, understand the importance of sustainability. In the US, 83% say they try to act in a way that is not harmful to the environment, 64% of German consumers prefer companies that reduce their CO2 emissions, and 73% of Indian consumers agree that vegan foods are better for the environment over animal-based food (including meat and dairy). There still is a need to educate consumers about the health, environmental and economic benefits of consuming insect protein, to boost its global interest.
Global consumer protein intake preferences and key consumer health-related trends include the following:Footnote 1
- Globally, 79% of consumers surveyed (n=1,605) who eat plant-based proteins like to eat any beans/legumes that are natural with the highest preference being grains like quinoa and millet (42%), other beans like black or cannellini (40%), lentils (38%), Garbanzo beans (35%), seeds like hemp and chia or soy (30%) and pea protein (22%). Those consumed less often (between 10-15%) were fava beans, algae like spirulina, fungus-based options like mycoprotein in Quorn, Seitan like wheat gluten, leaving none of these options for protein intake at 12%. Soy (38%) remains the most common alternative protein discussed in patents with other options being pea/chickpea (16%), rice (12%), legume (8%), potatoe (3%), oats (3%), maize (2%), rapeseed (2%) and others - including hemp, marine plants, algae, fungi, insects and protein via precision fermentation (17%).
- Almost half of Canadian consumers (40%) surveyed (n=2,000), believe that building/maintaining muscle mass is the most important reason to get enough protein in your diet. Comparably, 53% of consumers surveyed (n=3,000) in India place importance on the fact that protein helps in improving immunity health, while 42% of German male consumers (n=2,000) agree that high-protein foods help to keep them fuller for longer (satiety).
- Plant proteins are used in a large variety of food and drink categories such as high-protein vegan balls by Planta Food Factory - the Future of Food (Kenya), high-protein BBQ 3 bean wrap from MYPROTEIN (UK), and pumpkin protein drink by Chimpanzee - Le Natural (Germany). Chinese consumers (44%) are interested in plant-based protein-rich tea with almond, sesame, soybean ingredients, while UK consumers (31%) agree that high-protein products with plant proteins are more appealing over those made with animal protein and US consumers (16%) who eat plant-based proteins agree that they eat them for animal welfare reasons. Mimicking sensory qualities of meat matters: Thai consumers (51%) would be motivated to eat more plant-based meat if they tasted similar to meat, 37% of German meat substitute shoppers are more likely to purchase meat that closely resembles a meaty texture, and 55% of US consumers say they would eat more alternatives if they have the same nutritional profile as meat.
In the Americas region, consumers are keen for an animal-protein-like eating experience. The majority of consumers in the US describe themselves as having an omnivore or carnivore diet, with meat-free lifestyles remaining a niche market. Nevertheless, just under a third of consumers are keen to reduce their meat intake yet are not ready to forego the taste and texture of animal protein. In fact, not only do approximately 36% of American adults say that they would buy more meat substitutes if they tasted indistinguishable from meat, but over two-thirds (~67%) of meat substitute consumers in the US, also say that they prefer a meatier-like product over a vegetable forward alternative. Therefore, meat substitute brands are tapping into consumer demand with the largest surge of innovation in the last few years in North America being poultry with a fauna flavour by 49%, followed by meat (39%), and fish flavours (12%) that remain a more niche subgroup.Footnote 2
Although, natural claims are on the decline in meat substitute launches over the last five years, consumers in North America are increasingly scrutinising product labels and ingredient lists. As many as 25% of adults in the US are looking for less-processed meat substitutes. Particularly within the meat substitute category, the overly processed image is creating a barrier to buyers to adopt such products. Thus, importance still lies on focusing on clean and natural ingredient labels to attract those who prioritize health and clean eating.Footnote 2
Export trade overview – Canada
In 2023, Canada exported a total of Can$2.4 billion (423.7 thousand tonnes) of plant-based and animal protein ingredients from the world (mainly consisting of 73.4% of other food preparations - that could include plant-based burgers, patties, sausages; along with peptones and their derivatives, protein concentrates/substances, whey proteins, wheat gluten, pea/bean/lentil or vegetable powder, casein and other casein derivatives, and milk and egg or other albumins/albuminates). This export value has been increasing at a CAGR of 8.0%, especially for protein concentrates and textured protein substances (+37.6%), wheat gluten (+27.2%), caseinates and its derivatives (+25.5%) and egg albumin, excluding dried (+24.3%) between 2019 and 2023. During the same period, dried egg albumin registered a decline of 36%, followed by casein (−12.7%), and milk albumin including concentrates of two or more whey proteins (−9.2%).
The top global export markets in terms of value for plant-based and protein ingredients from Canada were the United States (77.4%), South Korea (4.1%), China (2.4%), the Philippines (1.2%), and Hong Kong (1.0%) in 2023. Although, Belgium places only as the 44th largest export market from Canada in volume terms of these protein ingredients, Canadian exports to Belgium have been growing by a value CAGR of 32.3% (2019 to 2023). Value exports to Japan have also shown healthy growth at a CAGR of 36.7% over the same period.
| Country | 2019 | 2020 | 2021 | 2022 | 2023 | CAGR* % 2019-2023 |
|---|---|---|---|---|---|---|
| Total - global exports | 1,737.6 | 1,916.5 | 2,129.8 | 2,423.3 | 2,365.1 | 8.0 |
| 1. United States | 1,309.2 | 1,402.2 | 1,568.8 | 1,807.9 | 1,829.9 | 8.7 |
| 2. South Korea | 94.5 | 132.7 | 133.2 | 121.8 | 98.0 | 0.9 |
| 3. China | 47.9 | 56.3 | 54.7 | 54.6 | 57.4 | 4.6 |
| 4. Philippines | 23.6 | 29.9 | 43.7 | 34.9 | 28.3 | 4.6 |
| 5. Hong Kong | 18.1 | 20.5 | 20.5 | 21.2 | 23.7 | 6.9 |
| 6. Netherlands | 38.3 | 31.4 | 36.9 | 38.0 | 22.8 | −12.2 |
| 7. Belgium | 6.9 | 1.6 | 15.1 | 26.9 | 21.0 | 32.3 |
| 8. Taiwan | 19.5 | 18.9 | 23.6 | 25.8 | 19.2 | −0.4 |
| 9. United Kingdom | 16.5 | 15.7 | 17.0 | 19.0 | 17.5 | 1.6 |
| 10. Japan | 4.9 | 13.1 | 13.9 | 20.6 | 17.1 | 36.7 |
| Subtotal - top 10 markets | 1,579.4 | 1,722.3 | 1,927.3 | 2,170.9 | 2,135.0 | 5.5 |
|
Source: Global trade tracker, 2024 *CAGR: Compound Annual Growth Rate |
||||||
| Country | 2019 | 2020 | 2021 | 2022 | 2023 | CAGR* % 2019-2023 |
|---|---|---|---|---|---|---|
| Total - global exports | 306,656 | 323,662 | 399,671 | 445,603 | 423,652 | 7.0 |
| 1. United States | 244,930 | 253,722 | 333,058 | 376,727 | 370,437 | 9.9 |
| 2. South Korea | 8,555 | 10,889 | 12,166 | 10,856 | 8,595 | −5.7 |
| 3. Philippines | 7,305 | 6,683 | 9,174 | 7,751 | 5,941 | −2.9 |
| 4. China | 15,611 | 7,862 | 4,025 | 4,171 | 4,402 | −13.5 |
| 5. Vietnam | 387 | 5,269 | 4,848 | 5,128 | 3,893 | −7.3 |
| 6. Japan | 457 | 1,726 | 2,153 | 4,568 | 2,702 | 11.9 |
| 7. United Kingdom Belgium | 1,698 | 2,217 | 2,169 | 2,204 | 2,024 | −2.2 |
| 8. Netherlands | 6,362 | 2,237 | 1,860 | 2,751 | 1,799 | −5.3 |
| 9. Peru | 631 | 1,896 | 1,586 | 1,733 | 1,391 | −7.5 |
| 10. Germany | 602 | 689 | 2,179 | 1,391 | 1,367 | 18.7 |
| Subtotal - top 10 markets | 286,539 | 293,190 | 373,217 | 417,280 | 402,550 | 8.2 |
| Hong Kong (16th) | 812 | 502 | 670 | 1,037 | 775 | 11.4 |
| Taiwan (26th) | 787 | 1,004 | 1,157 | 819 | 479 | −16.9 |
| Belgium (44th) | 1,932 | 173 | 950 | 1,468 | 179 | 0.9 |
|
Source: Global trade tracker, 2024 *CAGR: Compound Annual Growth Rate |
||||||
| HS Code | Description | 2019 | 2020 | 2021 | 2022 | 2023 | CAGR* % 2019-2023 |
|---|---|---|---|---|---|---|---|
| Total - exports to the world | 1,737.6 | 1,916.5 | 2,129.8 | 2,423.3 | 2,365.1 | 8.0 | |
| 21069090 | Other food preparations, nowhere else specified[1] | 1,365.2 | 1,466.1 | 1,560.1 | 1,711.2 | 1,735.1 | 6.2 |
| 350400 | Peptones and other protein substances and its derivatives, nowhere else specified (including hide powder) | 89.3 | 99.7 | 117.6 | 195.0 | 188.2 | 20.5 |
| 210610 | Protein concentrates and textured protein substances | 40.0 | 125.9 | 184.2 | 207.3 | 143.5 | 37.6 |
| 040410 | Whey and modified whey proteins | 60.8 | 64.3 | 63.9 | 84.7 | 60.8 | 0.0 |
| 110900 | Wheat gluten, whether or not dried | 21.3 | 31.5 | 43.6 | 41.4 | 55.8 | 27.2 |
| 110610 | Flour, meal and powder of peas, beans, lentils and other dried leguminous vegetables of heading 0713 | 28.8 | 21.6 | 36.4 | 51.0 | 34.4 | 4.5 |
| 350110 | Casein | 3.6 | 9.3 | 7.6 | 4.8 | 2.1 | −12.7 |
| 350219 | Egg albumin, excluding dried | 0.652 | 0.696 | 1.3 | 2.9 | 1.6 | 24.3 |
| 350220 | Milk albumin, by weight >80% whey proteins (including concentrates of 2 or more whey proteins) | 1.6 | 1.3 | 0.946 | 2.0 | 1.1 | −9.2 |
| 350190 | Caseinates and other casein derivatives (including glues) | 0.311 | 0.375 | 0.365 | 0.754 | 0.771 | 25.5 |
| 350290 | Other albumins, albuminates and its derivatives (excluding egg and milk albumins) | 0.307 | 0.069 | 0.087 | 0.199 | 0.445 | 9.7 |
| 350211 | Egg albumin, dried (for example; sheets, scales, flakes, powders) | 0.987 | 0.354 | 0.399 | 0.542 | 0.166 | −36.0 |
|
Source: Global trade tracker, 2024 *CAGR: Compound Annual Growth Rate 1: Other food preparations, nowhere else specified - All plant-based meat products would be classified under HS 210690, that is, burgers, patties, sausages, yet also includes other various food preparations, nowhere else specified. The other food preparations of hydrolyzed vegetable protein (HS:210690296) sub-category seems to best fit the description that would track these plant-based products. |
|||||||
| HS Code | Description | 2019 | 2020 | 2021 | 2022 | 2023 | CAGR* % 2019-2023 |
|---|---|---|---|---|---|---|---|
| Total - exports to the world | 306,657 | 323,663 | 399,669 | 445,603 | 423,651 | 7.0 | |
| 21069090 | Other food preparations, nowhere else specified | 131,503 | 146,892 | 186,902 | 216,034 | 225,547 | 11.3 |
| 040410 | Whey and modified whey proteins | 64,175 | 73,436 | 65,590 | 70,012 | 57,974 | −5.7 |
| 210610 | Protein concentrates and textured protein substances | 5,725 | 18,390 | 33,676 | 41,734 | 25,846 | 8.9 |
| 110610 | Flour, meal and powder of peas, beans, lentils and other dried leguminous vegetables of heading 0713 | 29,833 | 17,499 | 28,970 | 33,640 | 23,109 | 7.2 |
| 350400 | Peptones and other protein substances and its derivatives, nowhere else specified (including hide powder) | 12,267 | 10,174 | 13,157 | 20,138 | 20,005 | 18.4 |
| 110900 | Wheat gluten, whether or not dried | 7,112 | 10,794 | 15,413 | 11,817 | 11,657 | 1.9 |
| 350110 | Casein | 1,350 | 3,483 | 846 | 608 | 756 | −31.7 |
| 350219 | Egg albumin, excluding dried | 306 | 340 | 608 | 1,006 | 392 | 3.6 |
| 350220 | Milk albumin, by weight >80% whey proteins (including concentrates of 2 or more whey proteins) | 573 | 443 | 94 | 328 | 258 | −12.6 |
| 350190 | Caseinates and other casein derivatives (including glues) | 23 | 25 | 34 | 104 | 165 | 60.3 |
| 350211 | Egg albumin, dried (for example, sheets, scales, flakes, powders) | 156 | 80 | 100 | 117 | 35 | −18.7 |
| 350290 | Other albumins, albuminates and its derivatives (excluding egg and milk albumins) | 78 | 18 | 19 | 26 | 19 | 1.4 |
|
Source: Global trade tracker, 2024 *CAGR: Compound Annual Growth Rate |
|||||||
Market sizes
In 2023, the market size of animal derived protein ingredients in Canada registered a volume sales of 13.3 thousand tonnes (total proteins share: 22.9%), equivalent to an historical volume sales CAGR of 1.1% (2018-2023) and a forecast CAGR of 2.0% (2023-2028) set to reach 14.7 thousand tonnes by 2028. In 2023, the majority of the animal derived protein market consisted of 41.8% of caseinates (5.6 thousand tonnes), followed by 18.4% of whey protein concentrate (2.5 thousand tonnes), 18.1% of gelatin (2.4 thousand tonnes), 13.2% of egg whites (1.8 thousand tonnes); with smaller market sizes consisting of 5.2% of milk protein concentrates (696.4 tonnes), 1.5% of caseins (199.7 tonnes), 1.1% of whey protein isolate (151.3 tonnes), albumin (50.9 tonnes), hydrolysed keratins (27.6 tonnes), and milk protein isolates (13.8 tonnes). Historically, volume sales of most animal derived protein ingredients in Canada registered either low growth or slight declines with CAGRs falling between −0.1% up to 1.9%, at the exception of casein and milk protein concentrate, which grew at respective CAGRs of 4.3% and 7.4% (2018-2023).
| Category | 2018 | 2023 | CAGR* % 2018-2023 | 2024 | 2028 | CAGR* % 2023-2028 |
|---|---|---|---|---|---|---|
| Total - proteins | 52,638.1 | 58,267.9 | 2.1 | 59,432.5 | 63,851.3 | 1.8 |
| Subtotal - animal derived proteins | 12,618.0 | 13,322.3 | 1.1 | 13,624.8 | 14,721.7 | 2.0 |
| Albumin | 46.3 | 50.9 | 1.9 | 51.5 | 53.1 | 0.8 |
| Casein | 162.0 | 199.7 | 4.3 | 214.1 | 269.6 | 6.2 |
| Caseinates | 5,321.4 | 5,574.8 | 0.9 | 5,693.2 | 6,132.2 | 1.9 |
| Egg white | 1,688.1 | 1,763.8 | 0.9 | 1,808.6 | 1,961.9 | 2.2 |
| Gelatin | 2,396.8 | 2,417.9 | 0.2 | 2,425.9 | 2,451.3 | 0.3 |
| Milk protein concentrate | 487.8 | 696.4 | 7.4 | 758.3 | 993.8 | 7.4 |
| Milk protein isolate | 13.6 | 13.8 | 0.3 | 14.0 | 15.1 | 1.8 |
| Whey protein concentrate | 2,354.2 | 2,453.7 | 0.8 | 2,504.5 | 2,675.6 | 1.7 |
| Whey protein isolate | 147.6 | 151.3 | 0.5 | 154.7 | 169.1 | 2.2 |
| Hydrolysed keratins | 27.8 | 27.6 | −0.1 | 28.0 | 30.4 | 2.0 |
|
Source: Euromonitor International, 2024 *CAGR: Compound Annual Growth Rate |
||||||
In 2023, packaged food proteins (animal derived and plant based) totalled a volume sales of 32.4 thousand tonnes, which have been growing by a CAGR of 2.4% (2018-2023) and is forecast to grow by 2.3% (2023 to 2028). Demand in Canada for animal derived protein ingredients in terms of volume sales (containing a total animal derived protein breakdown in ingredients of 97.0% at 12.9 thousand tonnes) were highest within the dairy products packaged food category at a breakdown of 49.2% (6.3 thousand tonnes), especially for protein found in yogurt and sour milk at 69.5% within its category in 2023. Snacks were the second highest category in demand for animal derived protein ingredients at sales of 20.9% (2.7 thousand tonnes), mostly within confectionery products at 58.2% within the snack category in 2023. Staple foods were the next in demand over the year at sales of 18.2% (2.4 thousand tonnes) mostly within the baked goods sub-category at 77.6%, followed by the cooking ingredients and meals category at a total of 11.7% in sales (1.5 thousand tonnes) mostly for sauces, dips and condiments accounting for 64.4% of animal derived protein ingredients in its category and ready meals, pizza, food kits (35.6%) in 2023.
Sales of ready-to-drink (RTDs) coffee products and other malt-based hot drinks totalled a volume of 161.6 tonnes in 2023. The drink category overall grew by a CAGR of 8.4% (2018 to 2023), which is expected to grow by a CAGR of 6.0% (2023 to 2028) to reach sales of 216.1 tonnes by 2028.
| Category | Data type | 2018 | 2023 | CAGR* % 2018-2023 | 2024 | 2028 | CAGR* % 2023-2028 |
|---|---|---|---|---|---|---|---|
| Total - packaged food proteins | Total volume | 28,783.0 | 32,439.1 | 2.4 | 33,294.6 | 36,334.9 | 2.3 |
| % breakdown | 54.7 | 55.7 | 0.4 | 56.0 | 56.9 | 0.4 | |
| Total - animal derived protein ingredients | Total volume | 12,132.8 | 12,475.7 | 0.6 | 12,719.2 | 13,881.7 | 2.2 |
| % breakdown | 96.5 | 95.0 | −0.3 | 94.7 | 92.9 | −0.4 | |
| Snacks : | Total volume | 2,607.7 | 2,841.3 | 1.7 | 2,899.4 | 3,217.0 | 2.5 |
| % breakdown | 20.7 | 21.6 | 0.9 | 21.6 | 21.5 | −0.1 | |
| Confectionery | Total volume | 1,527.6 | 1,736.4 | 2.6 | 1,766.2 | 1,909.4 | 1.9 |
| % breakdown | 12.2 | 13.2 | 1.6 | 13.2 | 12.8 | −0.6 | |
| Ice cream and frozen yogurt | Total volume | 205.2 | 198.2 | −0.7 | 200.8 | 219.2 | 2.0 |
| % breakdown | 1.6 | 1.5 | −1.3 | 1.5 | 1.5 | 0.0 | |
| Savoury: biscuits, seafood, trail mixes and salty snacks | Total volume | 310.9 | 324.2 | 0.8 | 328.4 | 356.6 | 1.9 |
| % breakdown | 2.5 | 2.5 | 0.0 | 2.5 | 2.4 | −0.8 | |
| Sweet biscuits, cereal and protein/energy bars | Total volume | 564.1 | 582.4 | 0.6 | 604.0 | 731.8 | 4.7 |
| % breakdown | 4.5 | 4.4 | −0.4 | 4.5 | 4.9 | 2.2 | |
| Dairy products : | Total volume | 6,143.5 | 6,240.1 | 0.3 | 6,397.2 | 7,050.9 | 2.5 |
| % breakdown | 48.9 | 47.5 | −0.6 | 47.6 | 47.2 | −0.1 | |
| Baby food and milk formula | Total volume | 51.3 | 48.3 | −1.2 | 48.7 | 52.3 | 1.6 |
| % breakdown | 0.4 | 0.4 | 0.0 | 0.4 | 0.4 | 0.0 | |
| Cheese | Total volume | 784.3 | 702.2 | −2.2 | 709.8 | 739.6 | 1.0 |
| % breakdown | 6.2 | 5.3 | −3.1 | 5.3 | 5.0 | −1.2 | |
| Yogurt and sour milk | Total volume | 4,162.3 | 4,312.6 | 0.7 | 4,439.7 | 4,957.9 | 2.8 |
| % breakdown | 33.1 | 32.8 | −0.2 | 33.1 | 33.2 | 0.2 | |
| Other dairy (desserts, coffee whiteners, condensed/evaporated milk, fresh cheese and quark) | Total volume | 1,145.6 | 1,176.9 | 0.5 | 1,199.0 | 1,301.1 | 2.0 |
| % breakdown | 9.1 | 9.0 | −0.2 | 8.9 | 8.7 | −0.7 | |
| Cooking ingredients and meals : | Total volume | 1,022.1 | 1,135.2 | 2.1 | 1,160.5 | 1,274.4 | 2.3 |
| % breakdown | 8.1 | 8.6 | 1.2 | 8.6 | 8.5 | −0.2 | |
| Ready meals, pizza, food kits | Total volume | 170.4 | 175.2 | 0.6 | 176.4 | 190.8 | 1.7 |
| % breakdown | 1.4 | 1.3 | −1.5 | 1.3 | 1.3 | 0.0 | |
| Sauces, dips and condiments | Total volume | 851.7 | 960.0 | 2.4 | 984.1 | 1,083.6 | 2.5 |
| % breakdown | 6.8 | 7.3 | 1.4 | 7.3 | 7.3 | 0.0 | |
| Staple foods : | Total volume | 2,359.5 | 2,259.2 | −0.9 | 2,262.0 | 2,339.4 | 0.7 |
| % breakdown | 18.8 | 17.2 | −1.8 | 16.8 | 15.7 | −1.8 | |
| Baked goods (cakes,dessert mixes, pies, tarts, pastries) | Total volume | 1,884.6 | 1,755.4 | −1.4 | 1,733.9 | 1,725.2 | −0.3 |
| % breakdown | 15.0 | 13.4 | −2.2 | 12.9 | 11.5 | −3.0 | |
| Frozen processed potatoes | Total volume | 171.4 | 167.7 | −0.4 | 174.1 | 200.2 | 3.6 |
| % breakdown | 1.4 | 1.3 | −1.5 | 1.3 | 1.3 | 0.0 | |
| Processed meat and alternatives to meat and seafood substitutes | Total volume | 303.6 | 336.1 | 2.1 | 354.1 | 414.0 | 4.3 |
| % breakdown | 2.4 | 2.6 | 1.6 | 2.6 | 2.8 | 1.5 | |
| Ready-to-drink coffee and other malt-based hot drinks : | Total volume | 108.0 | 162.0 | 8.4 | 173.7 | 219.8 | 6.3 |
| % breakdown | 0.9 | 1.3 | 7.6 | 1.3 | 1.4 | 1.5 | |
|
Source: Euromonitor, 2024 *CAGR: Compound Annual Growth Rate |
|||||||
In 2023, the market size of plant-based protein ingredients (non-animal derived) in Canada registered sales of 43.6 thousand tonnes (total proteins share: 74.8%), equivalent to an historical volume sales CAGR of 2.4% (2018 to 2023) and a forecast CAGR of 1.8% (2023 to 2028) set to reach 47.7 thousand tonnes by 2028. In 2023, 51.9% of non-animal derived protein ingredients consisted of soy protein concentrate (22.6 thousand tonnes), followed by 31.1% of gluten (13.5 thousand tonnes), 10.4% of soy protein isolate (4.5 thousand tonnes), 5.6% pea protein (2.4 thousand tonnes), and 1.0% of vegetable proteins (435.6 tonnes). Noting that protein hydrolysates (616.0 tonnes) and other proteins (723.4 tonnes) were not included in the protein total share since these categories may not necessarily contain all inclusively non-animal derived ingredients. However, typically these proteins do come from plant, pulse or cereal sources.
Historically, volume sales of vegetable proteins and pea protein have been growing by the highest rates at CAGRs of 11.2% and 8.4%, respectively between 2018 and 2023. In the forecast period (2023 to 2028), vegetable proteins are expected to continue to gain momentum at a CAGR of 12.7%, while pea protein ingredients are expected to decline by a CAGR of 2.6%.
| Category | 2018 | 2023 | CAGR* % 2018-2023 | 2024 | 2028 | CAGR* % 2023-2028 |
|---|---|---|---|---|---|---|
| Total - proteins | 52,638.1 | 58,267.9 | 2.1 | 59,432.5 | 63,851.3 | 1.8 |
| Subtotal - non- animal derived proteins[1] | 38,799.9 | 43,578.6 | 2.4 | 44,416.2 | 47,652.3 | 1.8 |
| Gluten | 12,247.7 | 13,534.0 | 2.0 | 13,756.7 | 14,652.6 | 1.6 |
| Pea protein | 1,632.0 | 2,442.9 | 8.4 | 2,515.5 | 2,778.7 | 2.6 |
| Soy protein concentrate | 20,433.1 | 22,624.0 | 2.1 | 23,010.2 | 24,485.6 | 1.6 |
| Soy protein isolate | 4,231.0 | 4,542.0 | 1.4 | 4,636.4 | 4,945.1 | 1.7 |
| Vegetable proteins | 256.1 | 435.6 | 11.2 | 497.4 | 790.4 | 12.7 |
| Protein hydrolysates[1] | 574.0 | 616.0 | 1.4 | 627.7 | 661.1 | 1.4 |
| Other proteins[1] | 618.5 | 723.4 | 3.2 | 735.7 | 785.7 | 1.7 |
|
Source: Euromonitor International, 2024 *CAGR: Compound Annual Growth Rate 1: Non-animal derived proteins - Note that this category is not all inclusive since non-animal derived proteins may be used in the more ambiguous categories 'Hydrolysed Keratins,' 'Protein Hydrolysates' and 'Other Proteins' (not including in total volume). Typically, however, these proteins come from plant, pulse or cereal sources. |
||||||
In 2023, demand in Canada for plant-based protein ingredients in terms of volume sales (containing a total plant-based protein breakdown in ingredients of 42.2% at 18.4 thousand tonnes) was highest within the staple food products packaged food category at a protein breakdown sales of 69.9% (12.9 thousand tonnes), especially for protein found in processed meat and seafood substitutes (including tofu and derivatives) at 77.1% and baked goods (21.3%) within its category. Snacks were the second highest category in demand for non-animal derived protein ingredients at sales of 13.8% (2.5 thousand tonnes), specifically protein found in cereal and protein energy bars (89.4%) in 2023. Dairy products and alternatives were next in demand at sales of 10.3% (1.9 thousand tonnes), mostly for plant-based dairy products such as soy drinks, yoghurt and cheese (66.3%) within its category. Lastly, was the cooking ingredients and meals category at 6% sales (1.1 thousand tonnes) mostly for protein found in plant-based ready meals, pizza, and food kits (99.4%) in 2023.
| Category | Data type | 2018 | 2023 | CAGR* % 2018-2023 | 2024 | 2028 | CAGR* % 2023-2028 |
|---|---|---|---|---|---|---|---|
| Total - packaged food proteins | Total volume | 28,783.0 | 32,439.1 | 2.4 | 33,294.6 | 36,334.9 | 2.3 |
| % breakdown | 54.7 | 55.7 | 0.4 | 56.0 | 56.9 | 0.4 | |
| Total - plant-based derived protein ingredients | Total volume | 15,541.0 | 18,410.9 | 3.4 | 18,953.6 | 20,888.8 | 2.6 |
| % breakdown | 40.1 | 42.2 | 1.0 | 42.7 | 43.8 | 0.7 | |
| Snacks: | Total volume | 2,378.3 | 2,533.8 | 1.3 | 2,605.5 | 2,856.7 | 2.4 |
| % breakdown | 6.1 | 5.8 | −1.0 | 5.9 | 6.0 | 0.7 | |
| Ice cream | Total volume | 56.1 | 111.6 | 14.7 | 117.4 | 138.4 | 4.4 |
| % breakdown | 0.1 | 0.3 | 24.6 | 0.3 | 0.3 | 0.0 | |
| Savoury: salty, meat and seafood, other similiar snacks | Total volume | 138.6 | 157.2 | 2.6 | 162.3 | 177.4 | 2.4 |
| % breakdown | 0.4 | 0.4 | 0.0 | 0.4 | 0.4 | 0.0 | |
| Cereal and protein/energy bars | Total volume | 2,183.6 | 2,265.0 | 0.7 | 2,325.8 | 2,541.0 | 2.3 |
| % breakdown | 5.6 | 5.2 | −1.5 | 5.2 | 5.3 | 0.4 | |
| Dairy products and alternatives: | Total volume | 1,532.0 | 1,895.7 | 4.4 | 1,920.7 | 2,024.0 | 1.3 |
| % breakdown | 3.9 | 4.3 | 2.0 | 4.3 | 4.2 | −0.5 | |
| Baby milk formula | Total volume | 278.9 | 269.6 | −0.7 | 261.3 | 233.0 | −2.9 |
| % breakdown | 0.7 | 0.6 | −3.0 | 0.6 | 0.5 | −3.6 | |
| Cheese | Total volume | 145.6 | 199.6 | 6.5 | 204.0 | 219.7 | 1.9 |
| % breakdown | 0.4 | 0.5 | 4.6 | 0.5 | 0.5 | 0.0 | |
| Drinking powder milk | Total volume | 0.7 | 0.6 | −3.0 | 0.6 | 0.6 | 0.0 |
| % breakdown | 0.0 | 0.0 | 0.0 | 0.0 | 0.0 | 0.0 | |
| Yoghurt | Total volume | 130.4 | 168.2 | 5.2 | 171.2 | 181.2 | 1.5 |
| % breakdown | 0.3 | 0.4 | 5.9 | 0.4 | 0.4 | 0.0 | |
| Plant-based dairy - soy drinks, yoghurt and cheese, other milk | Total volume | 976.5 | 1,257.7 | 5.2 | 1,283.6 | 1,389.5 | 2.0 |
| % breakdown | 2.5 | 2.9 | 3.0 | 2.9 | 2.9 | 0.0 | |
| Cooking ingredients and meals: | Total volume | 988.1 | 1,107.4 | 2.3 | 1,120.3 | 1,166.1 | 1.0 |
| % breakdown | 2.5 | 2.5 | 0.0 | 2.5 | 2.4 | −0.8 | |
| Ready meals, pizza, food kits | Total volume | 981.9 | 1,101.2 | 2.3 | 1,114.0 | 1,159.6 | 1.0 |
| % breakdown | 2.5 | 2.5 | 0.0 | 2.5 | 2.4 | −0.8 | |
| Mayonnaise | Total volume | 6.1 | 6.2 | 0.3 | 6.3 | 6.5 | 0.9 |
| % breakdown | 0.0 | 0.0 | 0.0 | 0.0 | 0.0 | 0.0 | |
| Staple foods: | Total volume | 10,642.5 | 12,874.0 | 3.9 | 13,307.0 | 14,842.0 | 2.9 |
| % breakdown | 27.4 | 29.5 | 1.5 | 30.0 | 31.1 | 1.1 | |
| Baked goods (bread, cakes, dessert pies and tarts) | Total volume | 2,464.9 | 2,737.0 | 2.1 | 2,767.1 | 2,835.0 | 0.7 |
| % breakdown | 6.4 | 6.3 | −0.3 | 6.2 | 5.9 | −1.3 | |
| Breakfast hot/cold cereals | Total volume | 176.9 | 161.9 | −1.8 | 156.6 | 139.4 | −2.9 |
| % breakdown | 0.5 | 0.4 | −4.4 | 0.4 | 0.3 | −5.6 | |
| Processed meat and seafood substitutes, tofu and derivatives | Total volume | 7,956.7 | 9,925.9 | 4.5 | 10,333.1 | 11,813.6 | 3.5 |
| % breakdown | 20.5 | 22.8 | 2.1 | 23.3 | 24.8 | 1.7 | |
| Instant noodle cups | Total volume | 43.9 | 49.3 | 2.3 | 50.3 | 54.0 | 1.8 |
| % breakdown | 0.1 | 0.1 | 0.0 | 0.1 | 0.1 | 0.0 | |
|
Source: Euromonitor, 2024 *CAGR: Compound Annual Growth Rate |
|||||||
In 2023, demand in Canada for packaged food products containing pea protein ingredients totalled sales of 2.4 thousand tonnes. The packaged food category with the highest volume of pea protein ingredients was found in dairy and alternatives products at a pea protein sales breakdown of 52.3% (1.3 thousand tonnes), especially for pea protein found in plant-based dairy such as milk and yoghurt at sales of 73.7% within its category. Staple foods were the second highest category in demand for pea protein ingredients at sales of 30.9% (755.4 tonnes), specifically for pea protein found in baked goods such as bread and hot cereals (71.1%) in 2023. Snacks were next in demand at 16.5% (403.0 tonnes), for cereal and protein or energy bars (72.4%) and ice cream (27.6%) within its category. Lastly, was the cooking ingredients and meals category at 0.3% (6.2 tonnes) with all sales for pea protein found in mayonnaise (100%) in 2023.
| Category | Data type | 2018 | 2023 | CAGR* % 2018-2023 | 2024 | 2028 | CAGR* % 2023-2028 |
|---|---|---|---|---|---|---|---|
| Total - packaged food containing pea protein ingredients | Total volume | 1,632.0 | 2,442.9 | 8.4 | 2,515.5 | 2,778.7 | 2.6 |
| % breakdown | 100.0 | 100.0 | 0.0 | 100.0 | 100.0 | 0.0 | |
| Snacks: | Total volume | 340.3 | 403.0 | 3.4 | 415.1 | 455.6 | 2.5 |
| % breakdown | 20.9 | 16.5 | −4.6 | 16.5 | 16.4 | −0.1 | |
| Ice cream | Total volume | 55.9 | 111.4 | 14.8 | 117.2 | 138.1 | 4.4 |
| % breakdown | 3.4 | 4.6 | 6.2 | 4.7 | 5.0 | 1.7 | |
| Cereal and protein/energy bars | Total volume | 284.4 | 291.6 | 0.5 | 297.9 | 317.5 | 1.7 |
| % breakdown | 17.4 | 11.9 | −7.3 | 11.8 | 11.4 | −0.9 | |
| Dairy products and alternatives: | Total volume | 821.2 | 1,278.3 | 9.3 | 1,322.6 | 1,488.1 | 3.1 |
| % breakdown | 50.3 | 52.3 | 0.8 | 52.6 | 53.6 | 0.5 | |
| Cheese | Total volume | 122.7 | 168.5 | 6.5 | 172.3 | 185.6 | 2.0 |
| % breakdown | 7.5 | 6.9 | −1.7 | 6.8 | 6.7 | −0.6 | |
| Yoghurt | Total volume | 130.4 | 168.2 | 5.2 | 171.2 | 181.2 | 1.5 |
| % breakdown | 8.0 | 6.9 | −2.9 | 6.8 | 6.5 | −1.2 | |
| Plant-based dairy - milk and yoghurt | Total volume | 568.1 | 941.6 | 10.6 | 979.0 | 1,121.3 | 3.6 |
| % breakdown | 34.8 | 38.5 | 2.0 | 38.9 | 40.4 | 1.0 | |
| Cooking ingredients and meals (mayonnaise): | Total volume | 6.1 | 6.2 | 0.3 | 6.3 | 6.5 | 0.9 |
| % breakdown | 0.4 | 0.3 | −5.6 | 0.3 | 0.2 | −7.8 | |
| Staple foods: | Total volume | 464.4 | 755.4 | 10.2 | 771.6 | 828.5 | 1.9 |
| % breakdown | 28.5 | 30.9 | 1.6 | 30.7 | 29.8 | −0.7 | |
| Baked goods (bread, hot cereals) | Total volume | 419.1 | 536.8 | 5.1 | 530.5 | 515.5 | −0.8 |
| % breakdown | 25.7 | 22.0 | −3.1 | 21.1 | 18.6 | −3.3 | |
| Processed meat and seafood substitutes | Total volume | 41.2 | 214.3 | 39.1 | 236.8 | 308.6 | 7.6 |
| % breakdown | 2.5 | 8.8 | 28.6 | 9.4 | 11.1 | 4.8 | |
|
Source: Euromonitor, 2024 *CAGR: Compound Annual Growth Rate |
|||||||
Retail sales
The processed meat, seafood and alternatives to meat category in Canada has grown by 3% in current terms over the historic period, reaching Can$8.5 billion in 2023. Despite this growth, processed meat, seafood and alternatives continues to experience slowdown in growth amid the relentless surge in food prices driven by hyperinflation in 2022 and 2023. Furthermore, there is a growing concern about the adverse health effects of processed foods that includes the processed meat and seafood category (especially with cosnumers being told to lower the consumption of red meat - as recommended by the Canadian Cancer Society). As a result, Canadians are reshaping their shopping habits and lowering their meat intake, which sets the overall category to see little change in growth over the forecast period to reach a current retail sales value of Can$9.9 billion by 2028 (year-over-year growth of 3.2% between 2009-2028).Footnote 3
Meat and seafood substitutes was the best performing category in Canada in 2023, which represented the sole subcategory in the meat category to exhibit positive volume growth with retail value sales rising by 12% in current terms to reach Can$421 million. Driven by health awareness to processed products, a plant-based diet has gained significant momentum across the country. Manufacturers are actively focusing on innovation, as evidenced by recent product launches in brands such as Impossible chicken nuggets and NotCo's NotChicken nuggets. Alternatively, the Schneider Corporation was the leading player in 2023 in the real meat category, with a retail value share of 13%. Schneiders is an example of a manufacturer who are aiming to promote the importance of health claims for their processed meat and seafood products with the labelling of messaging such as "Authentic recipes and premium meats, since 1890" on its packing.Footnote 3
High in protein food products
Products with a high source of protein ingredients (animal or non-animal derived) registered total sales of Can$1.3 billion in 2022. High protein dairy products and alternatives registered the largest retail at a total of Can$386.4 million (30.4%) mainly for its sales of dairy and plant-based products such as cheese, milk drinks, dairy desserts (97.2%) in its category. Staple foods was the 2nd largest category at Can$366.2 million (28.8%), accounting for 83.8% in sales of high in protein processed meat, seafood and alternatives to meat products (including tofu and derivatives) in 2022. Meanwhile, sales in the cooking ingredients and meals category totalled Can$354.9 million (27.9%) - mostly for its sales of high in protein ready meals (95.5%) in its category; followed by high protein snacks at sales of 163.4 million (12.9%) - mostly for its high protein savoury snacks (57.8%) and sweet biscuits, snack bars and fruit snacks (33.6%) in 2022. High protein juices registered sales of Can$4.9 million over the year.
| Category | 2019 | 2020 | 2021 | 2022 |
|---|---|---|---|---|
| High protein snacks | 161.2 | 147.6 | 156.3 | 163.4 |
| Confectionery | 18.9 | 14.9 | 15.8 | 14.1 |
| Savoury snacks: salty, nut and seeds (trail mixes), meat, seafood | 84.1 | 84.0 | 89.1 | 94.4 |
| Sweet biscuits, snack bars and fruit snacks | 58.2 | 48.7 | 51.3 | 54.9 |
| High protein dairy products and alternatives | 233.3 | 330.8 | 380.7 | 386.4 |
| Baby milk formula | 8.9 | 7.0 | 7.0 | 7.1 |
| Prepared baby food | 3.0 | 3.7 | 3.9 | 3.8 |
| Dairy and plant-based products (including cheese, milk drinks, dairy desserts) | 221.4 | 320.1 | 369.8 | 375.5 |
| High protein cooking ingredients and meals | 143.4 | 237.7 | 332.7 | 354.9 |
| Edible oils | 0.8 | 1.2 | 1.4 | 1.8 |
| Food kits | 6.4 | 7.1 | 6.9 | 7.3 |
| Nut and seed based spreads | 2.4 | 3.2 | 2.3 | 2.6 |
| Ready meals | 130.3 | 221.2 | 316.8 | 338.9 |
| Sauces, dips and condiments | 1.6 | 2.0 | 3.7 | 3.1 |
| Soup | 1.9 | 3.1 | 1.7 | 1.2 |
| High protein staple foods | 308.0 | 360.1 | 346.0 | 366.2 |
| Baked goods (bread) | 43.7 | 66.6 | 51.7 | 41.6 |
| Breakfast cereals | 64.0 | 73.0 | 70.5 | 72.0 |
| Processed fruit and vegetables | 12.5 | 7.4 | 8.0 | 7.3 |
| Processed meat, seafood and alternatives to meat (including tofu and derivatives) | 172.8 | 197.8 | 200.0 | 233.8 |
| Pasta | 12.8 | 11.4 | 13.1 | 10.6 |
| Rice | 2.2 | 3.9 | 2.7 | 1.0 |
| Total - high protein packaged food products | 845.9 | 1,076.2 | 1,215.7 | 1,270.9 |
| High in protein juice | 5.0 | 5.7 | 4.1 | 4.9 |
| Source: Euromonitor International, 2024 | ||||
Over the historical period (2019 to 2022), high in protein packaged food products grew by a moderately high CAGR of 14.5%. High protein ready meals grew the most at a CAGR of 37.5%, followed by high protein edible oils (31.0%), high protein sauces, dips and condiments (24.7%), and high protein dairy and plant-based products (19.3%). During the same time, the highest drops in sales value were found within high in protein rice at a CAGR of −23.1%; along with high protein processed fruit and vegetables (−16.4%), and high protein soup (−14.2%).
| Category | Annual growth % 2022/2021 | CAGR* % 2019-2022 | Total growth % 2019-2022 |
|---|---|---|---|
| High protein snacks | 4.5 | 0.5 | 1.4 |
| Confectionery | −10.8 | −9.3 | −25.4 |
| Savoury, salty, nut and seeds (trail mixes), meat or seafood snacks | 5.9 | 3.9 | 12.2 |
| Sweet biscuits, snack bars and fruit snacks | 7.0 | −1.9 | −5.7 |
| High protein dairy products and alternatives | 1.5 | 18.3 | 65.6 |
| Baby milk formula | 1.4 | −7.3 | −20.2 |
| Prepared baby food | −2.6 | 8.2 | 26.7 |
| Dairy and plant-based products (including cheese, milk drinks, dairy desserts) | 1.5 | 19.3 | 69.6 |
| High protein cooking ingredients and meals | 6.7 | 35.3 | 147.5 |
| Edible oils | 28.6 | 31.0 | 125.0 |
| Food kits | 5.8 | 4.5 | 14.1 |
| Nut and seed based spreads | 13.0 | 2.7 | 8.3 |
| Ready meals | 7.0 | 37.5 | 160.1 |
| Sauces, dips and condiments | −16.2 | 24.7 | 93.8 |
| Soup | −29.4 | −14.2 | −36.8 |
| High protein staple foods | 5.8 | 5.9 | 18.9 |
| Baked goods (bread) | −19.5 | −1.6 | −4.8 |
| Breakfast cereals | 2.1 | 4.0 | 12.5 |
| Processed fruit and vegetables | −8.8 | −16.4 | −41.6 |
| Processed meat, seafood and alternatives to meat (including tofu and derivatives) | 16.9 | 10.6 | 35.3 |
| Pasta | −19.1 | −6.1 | −17.2 |
| Rice | −63.0 | −23.1 | −54.5 |
| Total - high protein packaged food products | 4.5 | 14.5 | 50.2 |
| High in protein juice | 19.5 | −0.7 | −2.0 |
|
Source: Euromonitor International, 2024 *CAGR: Compound Annual Growth Rate |
|||
| Category | 2022 | 2023 | 2024 | 2025 | 2026 | 2027 |
|---|---|---|---|---|---|---|
| High protein snacks | 163.4 | 181.2 | 188.5 | 210.1 | 231.6 | 251.6 |
| Confectionery | 14.1 | 15.7 | 15.9 | 18.4 | 20.8 | 23.0 |
| Savoury, salty, nut and seeds (trail mixes), meat or seafood snacks | 94.4 | 106.8 | 115.8 | 129.4 | 143.3 | 155.8 |
| Sweet biscuits, snack bars and fruit snacks | 54.9 | 58.8 | 56.9 | 62.3 | 67.5 | 72.7 |
| High protein dairy products and alternatives | 386.4 | 400.0 | 397.3 | 420.0 | 442.8 | 465.7 |
| Baby milk formula | 7.1 | 6.3 | 5.3 | 5.6 | 5.7 | 5.8 |
| Prepared baby food | 3.8 | 4.0 | 4.3 | 4.6 | 4.9 | 5.2 |
| Dairy and plant-based products (including cheese, milk drinks, dairy desserts) | 375.5 | 389.7 | 387.7 | 409.9 | 432.3 | 454.7 |
| High protein cooking ingredients and meals | 354.9 | 376.6 | 396.1 | 418.6 | 438.9 | 458.0 |
| Edible oils | 1.8 | 1.9 | 1.9 | 1.9 | 1.9 | 1.9 |
| Food kits | 7.3 | 8.2 | 8.3 | 10.1 | 11.5 | 12.7 |
| Nut and seed based spreads | 2.6 | 2.3 | 1.2 | 1.4 | 1.6 | 1.7 |
| Ready meals | 338.9 | 359.7 | 379.8 | 400.0 | 418.5 | 436.4 |
| Sauces, dips and condiments | 3.1 | 3.3 | 3.7 | 4.0 | 4.1 | 4.0 |
| Soup | 1.2 | 1.3 | 1.2 | 1.3 | 1.3 | 1.3 |
| High protein staple foods | 366.2 | 390.5 | 404.5 | 427.9 | 443.7 | 455.2 |
| Baked goods (bread) | 41.6 | 43.7 | 41.5 | 41.7 | 39.2 | 35.1 |
| Breakfast cereals | 72.0 | 73.8 | 75.1 | 77.8 | 80.4 | 83.1 |
| Processed fruit and vegetables | 7.3 | 8.0 | 8.5 | 10.1 | 11.4 | 12.8 |
| Processed meat, seafood and alternatives to meat (including tofu and derivatives) | 233.8 | 252.8 | 267.4 | 285.3 | 298.6 | 309.5 |
| Pasta | 10.6 | 11.3 | 10.8 | 11.4 | 11.9 | 12.0 |
| Rice | 1.0 | 1.0 | 1.3 | 1.7 | 2.2 | 2.7 |
| Total - high protein packaged food products | 1,270.9 | 1,348.3 | 1,386.4 | 1,476.6 | 1,557.0 | 1,630.5 |
| High in protein juice | 4.9 | 4.8 | 4.4 | 4.1 | 3.7 | 3.3 |
| Source: Euromonitor International, 2024 | ||||||
| Category | Annual growth % 2023/2022 | CAGR* % 2022-2027 | Total growth % 2022-2027 |
|---|---|---|---|
| High protein snacks | 9.0 | 10.9 | 54.0 |
| Confectionery | 10.3 | 11.3 | 63.1 |
| Savoury, salty, nut and seeds (trail mixes), meat or seafood snacks | 10.5 | 13.1 | 65.0 |
| Sweet biscuits, snack bars and fruit snacks | 5.8 | 7.1 | 32.4 |
| High protein dairy products and alternatives | 3.8 | 3.5 | 20.5 |
| Baby milk formula | −4.0 | −11.3 | −18.3 |
| Prepared baby food | 6.5 | 5.3 | 36.8 |
| Dairy and plant-based products (including cheese, milk drinks, dairy desserts) | 3.9 | 3.8 | 21.1 |
| High protein cooking ingredients and meals | 5.2 | 6.1 | 29.1 |
| Edible oils | 1.1 | 5.6 | 5.6 |
| Food kits | 11.7 | 12.3 | 74.0 |
| Nut and seed based spreads | −8.1 | −11.5 | −34.6 |
| Ready meals | 5.2 | 6.1 | 28.8 |
| Sauces, dips and condiments | 5.2 | 6.5 | 29.0 |
| Soup | 1.6 | 8.3 | 8.3 |
| High protein staple foods | 4.4 | 6.6 | 24.3 |
| Baked goods (bread) | −3.3 | 5.0 | −15.6 |
| Breakfast cereals | 2.9 | 2.5 | 15.4 |
| Processed fruit and vegetables | 11.9 | 9.6 | 75.3 |
| Processed meat, seafood and alternatives to meat (including tofu and derivatives) | 5.8 | 8.1 | 32.4 |
| Pasta | 2.5 | 6.6 | 13.2 |
| Rice | 22.0 | 0.0 | 170.0 |
| Total - high protein packaged food products | 5.1 | 6.1 | 28.3 |
| High in protein juice | −7.6 | −2.0 | −32.7 |
|
Source: Euromonitor International, 2024 *CAGR: Compound Annual Growth Rate |
|||
Plant-based food products
Plant-based food products registered total sales of Can$1.6 billion in 2022. Plant-based dairy was the category that registered the highest sales value in Canada at a total of Can$653.4 million - consisting of plant-based milk (79.4%), plant-based cheese (10.6%), and plant-based yogurt (10%). Plant-based staple foods brought sales of Can$321.2 million - mostly for its meat and seafood substitutes (49.8%) and processed fruit and vegetables (17.6%) food categories in 2022. Plant-based snacks registered the third largest sales at a value of Can$269.4 million, with sales spread out evenly across all snack categories such as plant-based ice cream, sweet biscuits, snack bars and fruit snacks, confectionery, and savoury snacks; followed by other plant-based dairy products and alternatives (Can$232.2 million) - mostly for its butter and spreads (85.6%) and lastly plant-based cooking ingredients and meals (Can$165.8 million) with ready meals (69.8%) being its top seller in 2022.
| Category | 2019 | 2020 | 2021 | 2022 |
|---|---|---|---|---|
| Plant-based snacks | 168.0 | 195.9 | 244.8 | 269.4 |
| Confectionery | 51.2 | 49.3 | 53.2 | 52.4 |
| Ice cream | 28.3 | 46.9 | 76.5 | 86.8 |
| Savoury snacks: salty, nut and seeds (trail mixes), meat, seafood | 29.5 | 43.4 | 50.2 | 52.1 |
| Sweet biscuits, snack bars and fruit snacks | 59.0 | 56.3 | 64.9 | 78.1 |
| Plant-based dairy | 473.0 | 545.9 | 593.7 | 653.4 |
| Milk | 406.1 | 464.3 | 487.1 | 519.1 |
| Yogurt | 35.9 | 41.0 | 54.2 | 65.1 |
| Cheese | 31.1 | 40.5 | 52.4 | 69.1 |
| Other plant-based dairy products and alternatives | 96.7 | 162.7 | 210.2 | 232.2 |
| Butter and spreads | 87.2 | 147.3 | 181.1 | 198.8 |
| Drinking milk products | 8.8 | 14.4 | 27.6 | 31.7 |
| Prepared baby food | 0.7 | 0.9 | 1.4 | 1.6 |
| Plant-based cooking ingredients and meals | 68.4 | 99.7 | 139.3 | 165.8 |
| Nut and seed based spreads | 1.0 | 1.4 | 1.3 | 2.5 |
| Ready meals | 53.1 | 78.3 | 100.8 | 115.7 |
| Sauces, dips and condiments | 12.6 | 17.1 | 32.8 | 41.4 |
| Soups | 1.7 | 2.9 | 4.3 | 6.2 |
| Plant-based staple foods | 137.9 | 216.2 | 265.2 | 321.2 |
| Breakfast cereals | 38.7 | 42.5 | 45.5 | 42.7 |
| Dessert mixes | 0.2 | 0.2 | 0.9 | 1.4 |
| Meat and seafood substitutes | 31.9 | 85.6 | 121.7 | 160.0 |
| Noodles | 3.7 | 4.0 | 8.8 | 9.5 |
| Pasta | 8.1 | 12.8 | 15.3 | 15.2 |
| Processed fruit and vegetables | 28.1 | 34.3 | 37.9 | 56.5 |
| Rice | 6.6 | 9.0 | 7.2 | 3.7 |
| Tofu and derivatives | 20.6 | 27.7 | 28.0 | 32.2 |
| Total - plant-based packaged food products | 944.0 | 1,220.4 | 1,453.2 | 1,642.0 |
| Plant-based fresh coffee | 1.5 | 5.0 | 17.5 | 18.8 |
| Source: Euromonitor International, 2024 | ||||
Over the historical period, all plant-based main food categories have been growing at a high rate (CAGR: 11.4% up to 34.3%) with plant-based packaged food products growing at an overall total CAGR of 20.3% (2019-2022). Plant-based fresh coffee has increased at a CAGR of 132.3% from Can$1.5 million in 2019 to Can$18.8 million. The highest growth in food sales were within the plant-based cooking ingredients and meal cateogry at a CAGR of 34.3%, followed by other plant-based dairy products such as cheese, yogurt, and milk (+33.9%), and plant-based staple foods (+32.6%). More specifically, plant-based foods such as dessert mixes, meat and seafood substitutes, soups, drinking milk products, and sauces, dips and condiments grew the most over the historical period. Plant-based rice is the only sub-category that decreased by a CAGR of 17.5% between 2019 and 2022.
| Category | Annual growth % 2022/2021 | CAGR* % 2019-2022 | Total growth % 2019-2022 |
|---|---|---|---|
| Plant-based snacks | 10.0 | 17.0 | 60.4 |
| Confectionery | −1.5 | 0.8 | 2.3 |
| Ice cream | 13.5 | 45.3 | 206.7 |
| Savoury snacks: salty, nut and seeds (trail mixes), meat, seafood | 3.8 | 20.9 | 76.6 |
| Sweet biscuits, snack bars and fruit snacks | 20.3 | 9.8 | 32.4 |
| Plant-based dairy | 10.1 | 11.4 | 38.1 |
| Milk | 6.6 | 8.5 | 27.8 |
| Yogurt | 20.1 | 21.9 | 81.3 |
| Cheese | 31.9 | 30.5 | 122.2 |
| Other plant-based dairy products and alternatives | 10.5 | 33.9 | 140.1 |
| Butter and spreads | 9.8 | 31.6 | 128.0 |
| Drinking milk products | 14.9 | 53.3 | 260.2 |
| Prepared baby food | 14.3 | 31.7 | 128.6 |
| Plant-based cooking ingredients and meals | 19.0 | 34.3 | 142.4 |
| Nut and seed based spreads | 92.3 | 35.7 | 150.0 |
| Ready meals | 14.8 | 29.6 | 117.9 |
| Sauces, dips and condiments | 26.2 | 48.7 | 228.6 |
| Soups | 44.2 | 53.9 | 264.7 |
| Plant-based staple foods | 21.1 | 32.6 | 132.9 |
| Breakfast cereals | −6.2 | 3.3 | 10.3 |
| Dessert mixes | 55.6 | 91.3 | 600.0 |
| Meat and seafood substitutes | 31.5 | 71.2 | 401.6 |
| Noodles | 8.0 | 36.9 | 156.8 |
| Pasta | −0.7 | 23.3 | 87.7 |
| Processed fruit and vegetables | 49.1 | 26.2 | 101.1 |
| Rice | −48.6 | −17.5 | −43.9 |
| Tofu and derivatives | 15.0 | 16.1 | 56.3 |
| Total - plant-based packaged food products | 13.0 | 20.3 | 73.9 |
| Plant-based fresh coffee | 7.4 | 132.3 | 1,153.3 |
|
Source: Euromonitor International, 2024 *CAGR: Compound Annual Growth Rate |
|||
Over the forecast period, all plant-based main food categories are expected to return to lower to moderate growth rates with plant-based packaged food products growing at an overall total CAGR of 6.8% (2022-2027). Plant-based fresh coffee will also slow down to a CAGR of 6.8% over the same period. Specific plant-based foods such as nut and seed based spreads, meat and seafood substitutes, ice cream, yogurt and cheese are expected to grow the most over the forecast period. Plant-based sub-categories expected to decline over the forecast period include plant-based soup, rice, noodles, and breakfast cereals.
| Category | 2022 | 2023 | 2024 | 2025 | 2026 | 2027 |
|---|---|---|---|---|---|---|
| Plant-based snacks | 269.4 | 298.5 | 320.2 | 346.5 | 371.4 | 397.9 |
| Confectionery | 52.4 | 56.0 | 59.9 | 64.5 | 68.7 | 73.7 |
| Ice cream | 86.8 | 102.8 | 112.7 | 122.6 | 132.3 | 142.1 |
| Savoury snacks: salty, nut and seeds (trail mixes), meat, seafood | 52.1 | 56.4 | 60.8 | 67.1 | 73.5 | 80.4 |
| Sweet biscuits, snack bars and fruit snacks | 78.1 | 83.3 | 86.7 | 92.2 | 97.0 | 101.7 |
| Plant-based dairy | 653.4 | 709.3 | 760.8 | 817.8 | 880.7 | 945.4 |
| Milk | 519.1 | 554.8 | 591.2 | 633.4 | 681.3 | 730.5 |
| Yogurt | 65.1 | 74.8 | 82.7 | 90.1 | 97.5 | 104.9 |
| Cheese | 69.1 | 79.6 | 86.9 | 94.2 | 101.9 | 110.0 |
| Other plant-based dairy products and alternatives | 232.2 | 237.8 | 248.9 | 257.5 | 265.7 | 267.6 |
| Butter and spreads | 198.8 | 201.9 | 211.1 | 217.6 | 223.6 | 223.1 |
| Drinking milk products | 31.7 | 34.2 | 36.1 | 38.1 | 40.2 | 42.5 |
| Prepared baby food | 1.6 | 1.7 | 1.6 | 1.7 | 1.9 | 2.0 |
| Plant-based cooking ingredients and meals | 165.8 | 164.7 | 168.0 | 179.2 | 190.1 | 201.1 |
| Nut and seed based spreads | 2.5 | 1.7 | 3.3 | 4.4 | 5.3 | 6.5 |
| Ready meals | 115.7 | 121.1 | 120.7 | 124.0 | 126.8 | 129.3 |
| Sauces, dips and condiments | 41.4 | 37.9 | 41.7 | 48.0 | 54.7 | 61.7 |
| Soups | 6.2 | 4.0 | 2.3 | 2.9 | 3.3 | 3.6 |
| Plant-based staple foods | 321.2 | 343.2 | 360.0 | 395.0 | 431.4 | 468.6 |
| Breakfast cereals | 42.7 | 42.2 | 41.0 | 40.6 | 40.3 | 39.7 |
| Dessert mixes | 1.4 | 1.6 | 1.7 | 1.8 | 1.9 | 1.9 |
| Meat and seafood substitutes | 160.0 | 177.7 | 190.0 | 216.0 | 242.7 | 270.1 |
| Noodles | 9.5 | 10.1 | 6.1 | 6.7 | 7.4 | 8.0 |
| Pasta | 15.2 | 16.8 | 17.9 | 18.7 | 19.3 | 20.0 |
| Processed fruit and vegetables | 56.5 | 56.3 | 61.2 | 66.0 | 71.1 | 76.7 |
| Rice | 3.7 | 3.9 | 3.7 | 3.7 | 3.5 | 3.1 |
| Tofu and derivatives | 32.2 | 34.6 | 38.4 | 41.6 | 45.2 | 49.2 |
| Total - plant-based packaged food products | 1,642.0 | 1,753.5 | 1,857.9 | 1,996.0 | 2,139.3 | 2,280.6 |
| Plant-based fresh coffee | 18.8 | 21.7 | 21.9 | 23.7 | 24.9 | 26.8 |
| Source: Euromonitor International, 2024 | ||||||
| Category | Annual growth % 2023/2022 | CAGR* % 2022-2027 | Total growth % 2022-2027 |
|---|---|---|---|
| Plant-based snacks | 10.8 | 8.1 | 47.7 |
| Confectionery | 6.9 | 7.1 | 40.6 |
| Ice cream | 18.4 | 10.4 | 63.7 |
| Savoury snacks: salty, nut and seeds (trail mixes), meat, seafood | 8.3 | 9.1 | 54.3 |
| Sweet biscuits, snack bars and fruit snacks | 6.7 | 5.4 | 30.2 |
| Plant-based dairy | 8.6 | 7.7 | 44.7 |
| Milk | 6.9 | 7.1 | 40.7 |
| Yogurt | 14.9 | 10.0 | 61.1 |
| Cheese | 15.2 | 9.7 | 59.2 |
| Other plant-based dairy products and alternatives | 2.4 | 2.9 | 15.2 |
| Butter and spreads | 1.6 | 2.3 | 12.2 |
| Drinking milk products | 7.9 | 6.0 | 34.1 |
| Prepared baby food | 6.2 | 4.6 | 25.0 |
| Plant-based cooking ingredients and meals | −0.7 | 3.9 | 21.3 |
| Nut and seed based spreads | −32.0 | 21.1 | 160.0 |
| Ready meals | 4.7 | 2.2 | 11.8 |
| Sauces, dips and condiments | −8.5 | 8.3 | 49.0 |
| Soups | −35.5 | −10.3 | −41.9 |
| Plant-based staple foods | 6.8 | 7.8 | 45.9 |
| Breakfast cereals | −1.2 | −1.4 | −7.0 |
| Dessert mixes | 14.3 | 6.3 | 35.7 |
| Meat and seafood substitutes | 11.1 | 11.0 | 68.8 |
| Noodles | 6.3 | −3.4 | −15.8 |
| Pasta | 10.5 | 5.6 | 31.6 |
| Processed fruit and vegetables | −0.4 | 6.3 | 35.8 |
| Rice | 5.4 | −3.5 | −16.2 |
| Tofu and derivatives | 7.5 | 8.8 | 52.8 |
| Total - plant-based packaged food products | 6.8 | 6.8 | 38.9 |
| Plant-based fresh coffee | 15.4 | 7.3 | 42.6 |
|
Source: Euromonitor International, 2024 *CAGR: Compound Annual Growth Rate |
|||
Competitive landscape
In 2022, top packaged food companies (brands) per main food category for animal/non-animal derived high in protein ingredients products in Canada included Link Snacks Inc. (Jack Link's) at a market share of 38.4% (Can$62.7 million) in the snacks category; Kraft Heinz Company (Kraft) at 46.1% (Can$178.2 million) in the dairy products and alternatives category; Nestlé (Stouffer's, Lean Cuisine) at 88.4% (Can$313.8 million) in the cooking ingredients and meals category; and Maple Leaf Foods Inc. (Maple Leaf, Lightlife) at 23.7% (Can$86.6 million) in the staple foods category. The leading company (brand) with the highest drink sales (Can$1.6 million) for high in protein juice products was the Hero Group GmbH (Baby Gourmet) at a share of 32.3%.
| Category | Company | Top brand(s) | Retail sales (Can$ million) | Market share in 2022 |
|---|---|---|---|---|
| Snacks | Link Snacks Inc. | Jack Link's | 62.7 | 38.4 |
| Mondelez International Inc. | Clif | 16.7 | 10.2 | |
| The Simply Good Foods Co. | Quest, Atkins | 7.2 | 4.4 | |
| Total - high in protein snacks | 163.4 | 100.0 | ||
| Dairy products and alternatives | Kraft Heinz Company | Kraft | 178.2 | 46.1 |
| Groupe Lactalis | Black Diamond, Lactantia, Iögo | 54.0 | 14.0 | |
| General Mills Inc. | Liberté | 48.7 | 12.6 | |
| Total - high in protein dairy products and alternatives | 386.4 | 100.0 | ||
| Cooking ingredients and meals | Nestlé SA | Stouffer's, Lean Cuisine | 313.8 | 88.4 |
| FCF Co Ltd. | Clover Leaf | 11.6 | 3.3 | |
| George Weston Ltd. | PC Blue Menu | 7.8 | 2.2 | |
| Total - high in protein cooking ingredients and meals | 354.9 | 100.0 | ||
| Staple foods | Maple Leaf Foods Inc. | Maple Leaf, Lightlife | 86.6 | 23.7 |
| FCF Co Ltd. | Clover Leaf, Brunswick | 56.3 | 15.4 | |
| The Bolton Group | Rio Mare | 33.6 | 9.2 | |
| Total - high in protein staple foods | 366.2 | 100.0 | ||
| Drinks | Hero Group GmbH | Baby Gourmet | 1.6 | 32.3 |
| OKF Corp. | OKF | 0.6 | 12.9 | |
| Tropicana Brands Group | Naked | 0.6 | 12.9 | |
| Total - high protein juice | 4.9 | 100.0 | ||
| Source: Euromonitor International, 2024 | ||||
In 2022, top packaged food companies (brands) for plant-based products in Canada included Groupe Danone (So Delicious) at a market share of 12.2% (Can$32.9 million) in the snacks category; Upfield Holdings BV (Becel) at 85.6% (Can$198.8 million) in the dairy products and alternatives category; ConAgra Brands Inc. (Gardein, Healthy Choice) at 22.9% (Can$38 million) in the cooking ingredients and meals category; and Beyond Meat Inc. (Beyond Meat) at 23.2% (Can$74.4 million) in the staple foods category. The leading company (brand) with the highest drink sales (Can$13.6 million) for plant-based hot drink products was the Kraft Heinz Company (Maxwell House) at a share of 72.4%.
| Category | Company | Top brand(s) | Retail sales (Can$ million) | Market share in 2022 |
|---|---|---|---|---|
| Snacks | Groupe Danone | So Delicious | 32.9 | 12.2 |
| Mondelez International Inc. | Clif, Green & Black's | 22.7 | 8.4 | |
| Dare Foods Ltd. | RealFruit, Dare | 22.4 | 8.3 | |
| Total - plant-based protein snacks | 269.4 | 100.0 | ||
| Dairy products and alternatives | Upfield Holdings BV | Becel | 198.8 | 85.6 |
| Groupe Danone | Silk, So Delicious | 11.1 | 4.8 | |
| Earth's Own Food Co Inc. | Earth's Own | 8.0 | 3.4 | |
| Total - plant-based dairy products and alternatives | 232.2 | 100.0 | ||
| Cooking ingredients and meals | ConAgra Brands Inc. | Gardein, Healthy Choice | 38.0 | 22.9 |
| George Weston Ltd. | President's Choice, PC Blue Menu | 28.8 | 17.4 | |
| Unilever Group | Best Foods/Hellmann's | 13.9 | 8.4 | |
| Total -plant-based cooking ingredients and meals | 165.8 | 100.0 | ||
| Staple foods | Beyond Meat Inc. | Beyond Meat | 74.4 | 23.2 |
| Bush Bros Inc. | Bush's Best | 44.6 | 13.9 | |
| Maple Leaf Foods Inc. | Lightlife | 43.2 | 13.5 | |
| Total - plant-based staple foods | 321.2 | 100.0 | ||
| Hot drinks | Kraft Heinz Co | Maxwell House | 13.6 | 72.4 |
| Illycaffè SpA | Illy | 0.8 | 4.1 | |
| Total - plant-based fresh coffee | 18.8 | 100.0 | ||
| Source: Euromonitor International, 2024 | ||||
New product launches in Canada
Mintel indicated that there were 3,292 new high in protein and/or plant-based products: packaged food (2,589), drink (566), pet food (119), and health (18) products launched in Canada's grocery retailer outlets (including new variety/range extension, packaging, formulation or relaunched) between the period of January 2019 and May 14th, 2024. These product launches consisted of 63.8% claims suitable for plant-based (2,099) and 45.9% of high/added protein (2,091) products.
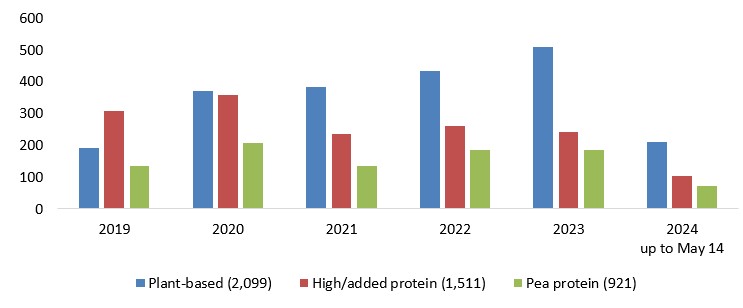
Description of above image
| 2019 | 2020 | 2021 | 2022 | 2023 | 2024 up to May 14 | |
|---|---|---|---|---|---|---|
| Plant-based (2,099) | 193 | 372 | 382 | 434 | 508 | 210 |
| High/added protein (1,511) | 308 | 359 | 236 | 262 | 243 | 103 |
| Pea protein (921) | 135 | 206 | 134 | 187 | 187 | 72 |
Note: each product can contain more than one of these claims
Source: Mintel, 2024
Leading parent companies launching plant-based or high/added protein food and drink products (3,155) in Canada between Q2-2023 and Q2-2024 were Prana Biovegan (39), Groupe Danone (18), ConAgra Foods (18), Pattison Food Group (15), and Groupe Lactalis (13). New brands appearing for the first time launched in the Canadian market within the last 6 months, included Patience Sour Cran (cherry flavoured sour dried plant-based cranberries), Krono Lytes (lemon and lime sport plant-based drink mix), Drizzilicious (cinnamon swirl plant-based bites), Base Vegetale (original pumpkin seed tofu - plant-based and 18g of protein), Reign Storm (Valencia orange energy drink), and Silk Oat (Dairy-free fortified oat beverage).
Top categories for plant-based or high/added protein claims in Canada were sauces and seasonings (+333%), bakery (+140%), Dairy (+100%), processed fish, meat and egg products (+30%), and nutritional drinks and other beverages (+5%) between Q2-2023 and Q2-2024. While declining categories included breakfast cereals (−100%) chocolate confectionery (−64%), sugar and gum confectionery (−50%), and meals and meal centers (−50%). New food ingredients appearing within the last 12 months included tapioca fibre syrup, Huito juice concentrate, rice milk, red Fife wheat, raisin syrup, and blackcurrant extract. The fastest growing flavours in these products were Quinoa, smoked, vegetable, lemon, mint, cocoa/cacao, roasted/toasted, cabbage/kale, beetroot/red beat (each at +200%) between Q2-2022 and Q2-2024.
Top claims and claim combinations used most often in the last three months for high/added and/or plant-based protein food and beverage (not including pet food) product launches included plant-based (68%), low/no/reduced allergen (66%), gluten free (57%), GMO free (50%), environmental friendly product (40%), vegan/no animal ingredients (40%), and high/added protein (39%). Top growing plant-based and high in protein claims were low/no/reduced saturated fat (+500%), hormone free (+275%), ethical - animal (+267%), functional - digestive (+250%), and low/no/reduced calorie (+200%) between Q1-2023 and Q1-2024. Meanwhile during the same period, declining claims by were ethical - upcycled ingredients (−100%), children, 5-12 (−100%), ethical - biodegradable (−80%), palm oil free (−75%), and premium (−75%).
Between the historic period (2019-2024), there were 921: new food (651), drink (190), pet food (73), and health (7) products launched in the Canadian grocery market. Which consisted of the following pea protein ingredients: 77.2% were labelled as being a pea protein food (711) mainly consisting of 17.6% of pea protein isolate (162), followed by 9% of pea protein concentrate (83) and 1% of textured pea protein (9).
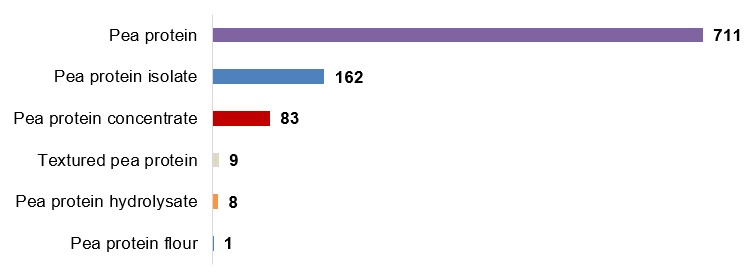
Description of above image
- Pea protein: 711
- Pea protein isolate: 162
- Pea protein concentrate: 83
- Textured pea protein: 9
- Pea protein hydrolysate: 8
- Pea protein flour: 1
Note: each product can contain more than one of these claims
Total item count: 921
Source: Mintel, 2024
In North America, the majority of US yogurt consumers say that private label yogurt is just as good as branded, where the share of private label launch activity is rising - especially in spoonable yogurt launches. Retailers are more aggressively positioning their store brand offerings as a 'zero-compromise' alternative next to big brands, while private label yogurts such as Tops, ShopRite and Sprouts Farmers Market are focusing attention around its products nutritional benefits (high in protein) and 'clean' ingredients (natural, organic, grade-A pasteurized skim milk) - which seems to work well to entice consumers in the Americas region.Footnote 4
| Product attributes | Yearly launch - item count | ||||||
|---|---|---|---|---|---|---|---|
| 2019 | 2020 | 2021 | 2022 | 2023 | 2024 | Total | |
| Yearly product launches | 193 | 372 | 382 | 434 | 508 | 210 | 2,099 |
| Top launch types | |||||||
| New packaging | 58 | 135 | 119 | 151 | 215 | 93 | 771 |
| New product | 50 | 103 | 133 | 115 | 135 | 48 | 584 |
| New variety/range extension | 73 | 91 | 89 | 135 | 103 | 41 | 532 |
| Relaunch | 11 | 43 | 41 | 33 | 52 | 27 | 207 |
| New formulation | 1 | 0 | 0 | 0 | 3 | 1 | 5 |
| Top sub-categories | |||||||
| Meat substitutes | 42 | 76 | 53 | 47 | 72 | 30 | 320 |
| Nutritional and meal replacement drinks | 40 | 66 | 22 | 31 | 24 | 11 | 194 |
| Snack/cereal/energy bars | 21 | 48 | 23 | 20 | 45 | 13 | 170 |
| Processed cheese | 13 | 8 | 22 | 31 | 33 | 29 | 136 |
| Plant based drinks (dairy alternatives) | 10 | 24 | 31 | 32 | 32 | 3 | 132 |
| Top five companies | |||||||
| Daiya Foods | 9 | 2 | 18 | 18 | 7 | 12 | 66 |
| Prana Biovegan | 0 | 2 | 5 | 17 | 20 | 20 | 64 |
| Sequel Natural | 10 | 41 | 3 | 7 | 2 | 0 | 63 |
| Loblaws | 6 | 15 | 14 | 14 | 11 | 0 | 60 |
| Cie 2 Ameriks | 3 | 14 | 16 | 13 | 3 | 2 | 51 |
| Top five brands | |||||||
| Daiya | 7 | 2 | 15 | 17 | 7 | 12 | 60 |
| PC President's Choice | 6 | 15 | 14 | 12 | 11 | 0 | 58 |
| Yves Veggie Cuisine | 15 | 21 | 8 | 1 | 2 | 3 | 50 |
| Prana Organic | 0 | 0 | 2 | 12 | 16 | 19 | 49 |
| GoGo Quinoa | 3 | 11 | 15 | 9 | 3 | 2 | 43 |
| Import status (if reported) | |||||||
| Not imported | 89 | 141 | 125 | 156 | 179 | 69 | 759 |
| Imported | 44 | 72 | 71 | 103 | 100 | 52 | 442 |
| Location of manufacture | |||||||
| Canada | 89 | 141 | 125 | 156 | 179 | 69 | 759 |
| USA | 28 | 53 | 37 | 60 | 48 | 39 | 265 |
| Italy | 5 | 7 | 2 | 2 | 6 | 0 | 22 |
| China | 4 | 4 | 0 | 5 | 8 | 0 | 21 |
| Greece | 1 | 2 | 3 | 2 | 12 | 0 | 20 |
| Top five flavours (including blend) | |||||||
| Unflavoured/plain | 52 | 90 | 119 | 129 | 147 | 51 | 588 |
| Chocolate | 13 | 27 | 15 | 25 | 20 | 10 | 110 |
| Vanilla - Bourbon/Madagascar | 11 | 16 | 16 | 14 | 24 | 3 | 84 |
| Berry | 4 | 9 | 3 | 4 | 4 | 4 | 28 |
| Chicken | 0 | 7 | 0 | 2 | 9 | 4 | 22 |
| Top claim category | |||||||
| Suitable for | 193 | 372 | 382 | 434 | 508 | 210 | 2,099 |
| Natural | 173 | 316 | 322 | 383 | 395 | 167 | 1,756 |
| Ethical and environmental | 94 | 242 | 210 | 219 | 277 | 112 | 1,154 |
| Positioning | 72 | 181 | 139 | 179 | 213 | 94 | 878 |
| Minus | 66 | 115 | 123 | 141 | 137 | 61 | 643 |
| Source: Mintel; Global New Product Database, 2024 | |||||||
| Product attributes | Yearly launch - item count | ||||||
|---|---|---|---|---|---|---|---|
| 2019 | 2020 | 2021 | 2022 | 2023 | 2024 | Total | |
| Yearly product launches | 308 | 359 | 236 | 262 | 243 | 103 | 1,511 |
| Top launch types | |||||||
| New packaging | 85 | 132 | 76 | 98 | 62 | 36 | 489 |
| New variety/range extension | 104 | 98 | 62 | 76 | 83 | 42 | 465 |
| New product | 98 | 74 | 82 | 67 | 84 | 18 | 423 |
| Relaunch | 19 | 55 | 13 | 21 | 13 | 6 | 127 |
| New formulation | 2 | 0 | 3 | 0 | 1 | 1 | 7 |
| Top sub-categories | |||||||
| Nutritional and meal replacement drinks | 73 | 84 | 61 | 64 | 64 | 25 | 371 |
| Snack/cereal/energy bars | 59 | 63 | 24 | 22 | 23 | 22 | 213 |
| Hard/semi-hard cheese | 8 | 26 | 13 | 19 | 14 | 3 | 83 |
| Meat substitutes | 27 | 15 | 12 | 11 | 10 | 1 | 76 |
| Spoonable yogurt | 10 | 5 | 13 | 3 | 10 | 6 | 47 |
| Top five companies | |||||||
| Walmart | 8 | 12 | 10 | 12 | 5 | 4 | 51 |
| Sequel Natural | 10 | 22 | 3 | 4 | 2 | 0 | 41 |
| Lactalis | 0 | 6 | 7 | 8 | 11 | 3 | 35 |
| Save-on-Foods | 0 | 11 | 6 | 9 | 9 | 0 | 35 |
| Genuine Health | 8 | 9 | 0 | 0 | 0 | 7 | 24 |
| Top five brands | |||||||
| Great Value | 4 | 12 | 8 | 12 | 5 | 3 | 44 |
| Western Family | 1 | 10 | 5 | 7 | 3 | 2 | 28 |
| Black Diamond | 5 | 7 | 5 | 4 | 7 | 0 | 28 |
| Yves Veggie Cuisine | 10 | 11 | 3 | 1 | 1 | 0 | 26 |
| SimplyProtein | 7 | 2 | 0 | 6 | 2 | 0 | 17 |
| Import status (if reported) | |||||||
| Not imported | 109 | 117 | 94 | 114 | 94 | 49 | 577 |
| Imported | 70 | 86 | 49 | 55 | 50 | 16 | 326 |
| Location of manufacture | |||||||
| Canada | 109 | 117 | 94 | 114 | 94 | 49 | 577 |
| USA | 48 | 59 | 32 | 38 | 27 | 9 | 213 |
| China | 9 | 11 | 3 | 0 | 6 | 0 | 29 |
| Thailand | 2 | 3 | 2 | 2 | 3 | 5 | 17 |
| Italy | 1 | 1 | 4 | 5 | 4 | 1 | 16 |
| Top five flavours (including blend) | |||||||
| Unflavoured/plain | 83 | 103 | 68 | 77 | 65 | 20 | 416 |
| Chocolate | 29 | 36 | 16 | 18 | 21 | 9 | 129 |
| Vanilla - Bourbon/Madagascar | 24 | 28 | 17 | 8 | 26 | 8 | 111 |
| Chocolate and peanut butter | 7 | 5 | 3 | 4 | 3 | 3 | 25 |
| Chicken | 4 | 3 | 2 | 5 | 6 | 4 | 24 |
| Top claim category | |||||||
| Plus | 308 | 359 | 236 | 262 | 243 | 103 | 1,511 |
| Suitable for | 246 | 239 | 152 | 190 | 179 | 81 | 1,087 |
| Natural | 216 | 221 | 140 | 172 | 159 | 55 | 963 |
| Ethical and environmental | 106 | 156 | 115 | 97 | 80 | 56 | 610 |
| Positioning | 103 | 140 | 100 | 128 | 100 | 38 | 609 |
| Source: Mintel; Global New Product Database, 2024 | |||||||
| Product attributes | Yearly launch - item count | ||||||
|---|---|---|---|---|---|---|---|
| 2019 | 2020 | 2021 | 2022 | 2023 | 2024 | Total | |
| Yearly product launches | 135 | 206 | 134 | 187 | 187 | 72 | 921 |
| Top launch types | |||||||
| New product | 43 | 54 | 40 | 59 | 75 | 11 | 282 |
| New packaging | 43 | 64 | 41 | 51 | 48 | 24 | 271 |
| New variety/range extension | 39 | 62 | 41 | 58 | 46 | 24 | 270 |
| Relaunch | 9 | 25 | 11 | 19 | 16 | 13 | 93 |
| New formulation | 1 | 1 | 1 | 0 | 2 | 0 | 5 |
| Top sub-categories | |||||||
| Nutritional and meal replacement drinks | 30 | 46 | 24 | 28 | 36 | 9 | 173 |
| Meat substitutes | 20 | 36 | 25 | 27 | 29 | 10 | 147 |
| Snack/cereal/energy bars | 25 | 29 | 11 | 16 | 26 | 12 | 119 |
| Plant based drinks (dairy alternatives) | 4 | 9 | 5 | 11 | 18 | 1 | 48 |
| Processed cheese | 5 | 9 | 7 | 9 | 5 | 11 | 46 |
| Top five companies | |||||||
| Daiya Foods | 9 | 9 | 10 | 9 | 4 | 11 | 52 |
| Sequel Natural | 12 | 28 | 3 | 4 | 2 | 0 | 49 |
| Loblaws | 3 | 12 | 8 | 8 | 1 | 0 | 32 |
| Beyond Meat | 1 | 5 | 4 | 6 | 4 | 3 | 23 |
| Genuine Health | 8 | 5 | 0 | 0 | 0 | 7 | 20 |
| Top five brands | |||||||
| Daiya | 9 | 9 | 10 | 9 | 4 | 11 | 52 |
| PC President's Choice | 3 | 9 | 8 | 8 | 1 | 0 | 29 |
| Wholly Veggie! | 0 | 5 | 2 | 6 | 3 | 0 | 16 |
| Genuine Health | 8 | 1 | 0 | 0 | 0 | 5 | 14 |
| Maison Riviera | 5 | 0 | 0 | 3 | 6 | 0 | 14 |
| Import status (if reported) | |||||||
| Not imported | 27 | 59 | 36 | 75 | 76 | 33 | 306 |
| Imported | 47 | 46 | 30 | 45 | 32 | 13 | 213 |
| Location of manufacture | |||||||
| Canada | 27 | 59 | 36 | 75 | 76 | 33 | 306 |
| USA | 37 | 33 | 23 | 30 | 22 | 12 | 157 |
| Italy | 3 | 4 | 0 | 5 | 4 | 0 | 16 |
| Belgium | 0 | 6 | 3 | 0 | 1 | 0 | 10 |
| France | 0 | 0 | 2 | 2 | 0 | 1 | 5 |
| Top five flavours (including blend) | |||||||
| Unflavoured/plain | 23 | 54 | 34 | 49 | 36 | 15 | 211 |
| Vanilla - Bourbon/Madagascar | 11 | 13 | 6 | 7 | 25 | 4 | 66 |
| Chocolate | 11 | 13 | 7 | 13 | 16 | 3 | 63 |
| Chicken | 1 | 2 | 1 | 6 | 11 | 2 | 23 |
| Chocolate and peanut butter | 2 | 2 | 3 | 3 | 4 | 1 | 15 |
| Top claim category | |||||||
| Suitable for | 133 | 193 | 120 | 170 | 170 | 71 | 857 |
| Natural | 101 | 167 | 106 | 156 | 123 | 57 | 710 |
| Ethical and environmental | 42 | 118 | 68 | 93 | 80 | 32 | 433 |
| Positioning | 55 | 93 | 46 | 74 | 78 | 24 | 370 |
| Plus | 68 | 78 | 45 | 75 | 76 | 24 | 366 |
| Source: Mintel; Global New Product Database, 2024 | |||||||
Examples of new products
Original Pumpkin Seed Tofu

Source: Mintel, 2024
| Company / manufacturer | Base Végétale |
|---|---|
| Brand | Base Végétale |
| Sub-category | Processed meat substitutes |
| Market | Canada |
| Related claims | Organic, gluten free, low / no / reduced allergen, vegan / no animal ingredients, plant based |
| Store name | Avril Supermarché Santé |
| Store location | Repentigny J6A 5N4 |
| Store type | Natural / health food store |
| Date published | May 2024 |
| Launch type | New product |
| Price in Canadian dollars | 4.00 |
This product retails in a 300 gram pack. Provides 18 grams of protein. Vegan. Made with organic pumpkin seeds. Free from soy, gluten, nut.
Summer Berries Plant Protein Whole Food Energy Bar
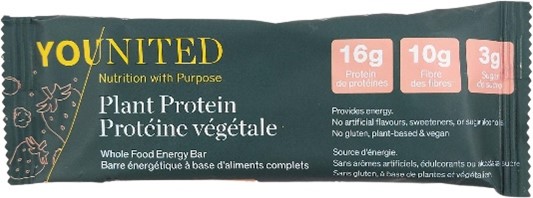
Source: Mintel, 2024
| Company / manufacturer | Younited |
|---|---|
| Brand | Younited |
| Sub-category | Snack / cereal / energy bars |
| Market | Canada, not imported |
| Related claims | Gluten free, high / added protein, vegan / no animal ingredients, functional – energy, plant based |
| Related ingredients | Pea protein isolate, Stevia extract |
| Store name | Avril Supermarché Santé |
| Store location | Repentigny J6A 5N4 |
| Store type | Natural / health food store |
| Date published | May 2024 |
| Launch type | New product |
| Price in Canadian dollars | 3.99 |
This product retails in a 60 gram pack. Nutrition with purpose. Contains 16 grams protein, 10 grams fibre, 3 grams sugar. Provides energy. No gluten, artificial flavours, sweeteners, or sugar alcohol.- Plant-based and vegan. Made in Canada from domestic and imported ingredients. Comes in crunchy peanut butter cup and chocolate plant protein flavours.
Vanilla Flavour Organic Drink Mix Powder
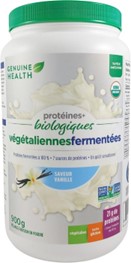
Source: Mintel, 2024
| Company / importer | Genuine Health |
|---|---|
| Brand | Genuine Health Fermented VeganProteins+ |
| Category | Nutritional drinks and other meal replacement beverages |
| Market | Canada, not imported |
| Related claims | No additives / preservatives, organic, gluten free, low / no / reduced allergen, ethical – environmentally friendly product / human, vegan/no animal ingredients, GMO free |
| Related ingredients | Organic, blended proteins (including pea protein, fermented brown rice protein and vegan protein blend) |
| Store name | Avril Supermarché Santé |
| Store location | Montreal-Laval H7S 1Y8 |
| Store type | Natural / health food store |
| Date published | May 2024 |
| Launch type | Relaunch |
| Price in Canadian dollars | 69.99 |
This product features an improved flavour, and has been repackaged in a 900 gram pack. 100% fermented protein with Seven protein sources. Taste great. Vegan, gluten-free and free from artificial colour or flavour. Contains 21 grams of protein. Logos and certifications: Non-GMO Project Verified, USDA Organic, Certified B Corporation, Proudly Canadian
Key Lime Protein Greek Style Plant-Based Yogurt

Source: Mintel, 2024
| Company / manufacturer | Danone |
|---|---|
| Brand | Silk |
| Category | Dairy, plant-based spoonable yogurt (dairy alternatives) |
| Market | Canada |
| Related claims | Ethical – environmentally friendly product / human, high / added protein, vegan / no animal ingredients, plant based |
| Related ingredients | Pea protein |
| Store name | Metro (Canada) |
| Store location | Montréal H2X 3P9 |
| Store type | Internet / mail order |
| Date published | April 2024 |
| Launch type | New variety / range extension |
| Price in Canadian dollars | 6.99 |
This product retails in a 500 gram pack. Coconut base. 12 grams protein per 175 grams. Canadian pea protein. Vegan. Prepared in Canada. Logos and certifications: Certified B Corporation, How2Recycle
Plant-based Smoked Salmon

Source: Mintel, 2024
| Company / manufacturer | By2048 |
|---|---|
| Brand | By2048 |
| Category | Processed fish, egg, meat subsitutes |
| Market | Canada |
| Related claims | Ethical – environmentally friendly package / charity / biodegradeable / recycling / sustainable, plant based |
| Related ingredients | Organic: carrot, extra olive virgin oil, cider vinegar, natural smoke flavouring |
| Store name | Avril Supermarché Santé |
| Store location | Montréal-Laval H7S 1Y8 |
| Store type | Natural / health food store |
| Date published | October 2022 |
| Launch type | New product |
| Price in Canadian dollars | 7.99 |
This product retails in a 105 gram pack. Made of five simple ingredients. Made from fresh carrots. 5% of the profit go toward ocean preservation. Carrot-based salmon alternative. Partially biodegradable pack made from recycled materials. Logos and certifications: Certified Plastic Negative Product, Instagram, TikTok
Smooth & Fluffy Original Tofu Scramble with Okara
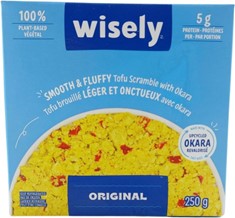
Source: Mintel, 2024
| Company / manufacturer | Wisely Foods |
|---|---|
| Brand | Wisely |
| Sub-category | Processed fish, egg, meat subsitutes |
| Market | Canada, not imported |
| Related claims | Ethical – environmentally friendly package/product/recycling/upcycled ingredients/sustainable, plant based |
| Related ingredients | Soybean curd, tofu, soy beverage, Okara (organic non-GMO soy pulp) |
| Store name | Avril Supermarché Santé |
| Store location | Montréal-Laval H7S 1Y8 |
| Store type | Natural / health food store |
| Date published | October 2022 |
| Launch type | New product |
| Price in Canadian dollars | 7.99 |
This product retails in a 250 gram pack. - 100% plant-based - 5 grams of protein - Made with upcycled okara- Microwavable- Reduces food waste by turning okara into delicious and sustainable products- Okara is the leftover pulp generated in the process of tofu manufacturing, and yet very nutritious- Rescued and upcycled okara from Soya Distinction- Logos and certifications: Facebook, Instagram, FSC Recycled
For more information
The Canadian Trade Commissioner Service:
International Trade Commissioners can provide Canadian industry with on-the-ground expertise regarding market potential, current conditions and local business contacts, and are an excellent point of contact for export advice.
More agri-food market intelligence:
International agri-food market intelligence
Discover global agriculture and food opportunities, the complete library of Global Analysis reports, market trends and forecasts, and information on Canada's free trade agreements.
Agri-food market intelligence service
Canadian agri-food and seafood businesses can take advantage of a customized service of reports and analysis, and join our email subscription service to have the latest reports delivered directly to their inbox.
More on Canada's agriculture and agri-food sectors:
Canada's agriculture sectors
Information on the agriculture industry by sector. Data on international markets. Initiatives to support awareness of the industry in Canada. How the department engages with the industry.
For additional information on flagship International trade show events, please contact:
Ben Berry, Deputy Director
Trade Show Strategy and Delivery
Agriculture and agri-food Canada
ben.berry@agr.gc.ca
Resources
- Euromonitor International | November 2023. Country Report: Processed meat, seafood and alternatives to meat in Canada
- Mintel Global New Products Database, 2024
- Mintel | October 2023. A year of innovation in meat substitutes and eggs, 2023
- Srivastava, Neha. Mintel | August 8, 2023. Patent insights: alternative proteins for the future
- Srivastava, Neha. Mintel | March 2024. A year of innovation in dairy and plant-based yogurt, 2024
Sector Trend Analysis – Plant-based protein food and drink trends in Canada
Global Analysis Report
Prepared by: Erin-Ann Chauvin, Senior Market Analyst
© His Majesty the King in Right of Canada, represented by the Minister of Agriculture and Agri-Food (2024).
Photo credits
All photographs reproduced in this publication are used by permission of the rights holders.
All images, unless otherwise noted, are copyright His Majesty the King in Right of Canada.
To join our distribution list or to suggest additional report topics or markets, please contact:
Agriculture and Agri-Food Canada, Global Analysis1341 Baseline Rd, Tower 5, 3rd floor
Ottawa ON K1A 0C5
Canada
Email: aafc.mas-sam.aac@agr.gc.ca
The Government of Canada has prepared this report based on primary and secondary sources of information. Although every effort has been made to ensure that the information is accurate, Agriculture and Agri-Food Canada (AAFC) assumes no liability for any actions taken based on the information contained herein.
Reproduction or redistribution of this document, in whole or in part, must include acknowledgement of agriculture and agri-food Canada as the owner of the copyright in the document, through a reference citing AAFC, the title of the document and the year. Where the reproduction or redistribution includes data from this document, it must also include an acknowledgement of the specific data source(s), as noted in this document.
Agriculture and Agri-Food Canada provides this document and other report services to agriculture and food industry clients free of charge.