
Authors: E. Pattey, T. Martin, D. MacDonald, S. Hamalainen, X. Li
Summary
Particulate matter (PM) is considered a type of air pollution due to its adverse effects on human health and the environment. PM decreases visibility and has climatic effects since it alters the amount of solar energy reaching the Earth’s surface and the amount of energy radiating back into space. It contributes to stratospheric ozone depletion, acid rain and smog. The emission of PM from agricultural operations is an emerging air quality issue with important implications for the health of agricultural workers and animals. The Agricultural Particulate Matter Emissions Indicator (APMEI) has been developed to estimate the PM emissions from agriculture and to assess emission-reduction measures. The APMEI estimates emissions of primary PM from wind erosion, land preparation, crop harvesting, fertilizer and chemical application, crop residue burning, pollen, animal feeding operations and animal carcass burning for the Census years 1981 to 2016. The Particulate Matter Indicator assesses both the state and the trend of emissions of primary PM resulting from Canadian agricultural activities.
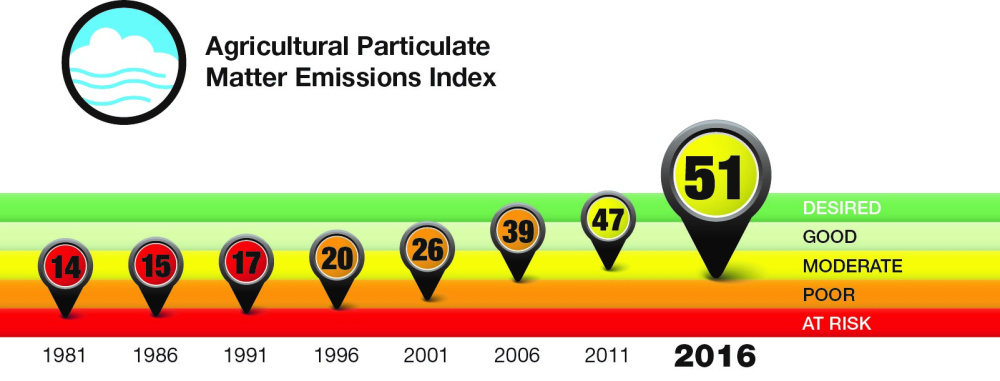
Total PM emissions from agricultural sources in Canada decreased from 1981 to 2016, with a decline of 70% for total suspended particulate (TSP), 68% for PM10 and 63% for PM2.5 (refer to Figure 2 in the text box “Particulate Matter Explained” for an explanation of PM size classes). In 2016, emissions were 1889 kilotonnes (kt) for TSP, 605 kt for PM10 and 206 kt for PM2.5. The greatest improvements have occurred in the Prairie Provinces, and can mainly be attributed to a reduction in summerfallow, along with a shift to reduced tillage and no-till practices in this region, which has reduced the quantity of particulates produced during land preparation and harvesting.
Description of image above
The Particulate Matter Index covers the years 1981 to 2016 in five-year increments. The index value ranges from 0 to 100 in twenty-point increments with each increment assigned a qualitative rating: 0-19 is At risk; 20-39 is Poor; 40-59 is Moderate; 60-79 is Good; 80-100 is Desired.
| Year | Index Value | Index rating |
|---|---|---|
|
1981 |
14 |
At Risk |
|
1986 |
15 |
At Risk |
|
1991 |
17 |
At Risk |
|
1996 |
20 |
Poor |
|
2001 |
26 |
Poor |
|
2006 |
39 |
Poor |
|
2011 |
47 |
Moderate |
|
2016 |
51 |
Moderate |
The issue and why it matters
Particulate matter (PM) is a mixture of solid particles and liquid droplets of varying size and chemical composition that are suspended in the air. It is classified as either primary particles emitted directly into the air or as secondary particles formed in the air by chemical or physical processes. Epidemiological studies show that increases in PM concentrations, especially the concentrations of fine particulate matter (PM2.5), are associated with adverse health effects such as increased incidence of respiratory diseases and premature death (Donham and Thelin, 2006; Samet and Krewski, 2007; U.S. EPA, 2004). Additionally, PM is recognized as an air pollutant that decreases visibility, contributes to stratospheric ozone depletion, acid rain and smog, and influences climate by altering both the amount of solar energy reaching the earth’s surface and the amount of energy radiating back into space.
Agriculture has long been recognized as a significant contributor of atmospheric PM emissions (Saxton, 1996). The main agricultural sources of primary PM include dust from soil and biological material, droplets and particles from agrochemicals, and bacteria that affect both indoor and outdoor air quality. Ammonia emissions are the main agricultural source of secondary PM (that is, those particles that are formed in the air – see Figure 2). Little is known about outdoor air quality in rural environments since monitoring stations are sparse.
Agricultural PM emissions show temporal and spatial variations. For example, emissions from land preparation and crop harvesting tend to be seasonal, and emissions from livestock operations vary by type of livestock and by type of building. Estimates of PM emissions from various agricultural sources can be improved by taking into account these temporal and spatial variations and the impact of mitigation measures such as changes in land use and management practices. It is important to be able to demonstrate how agricultural practices can mitigate PM emissions in various regions and production systems, and the response to these practices over time. For instance, changes and improvements in land management have led to a steady decline in agricultural contributions to PM emissions since 1981.
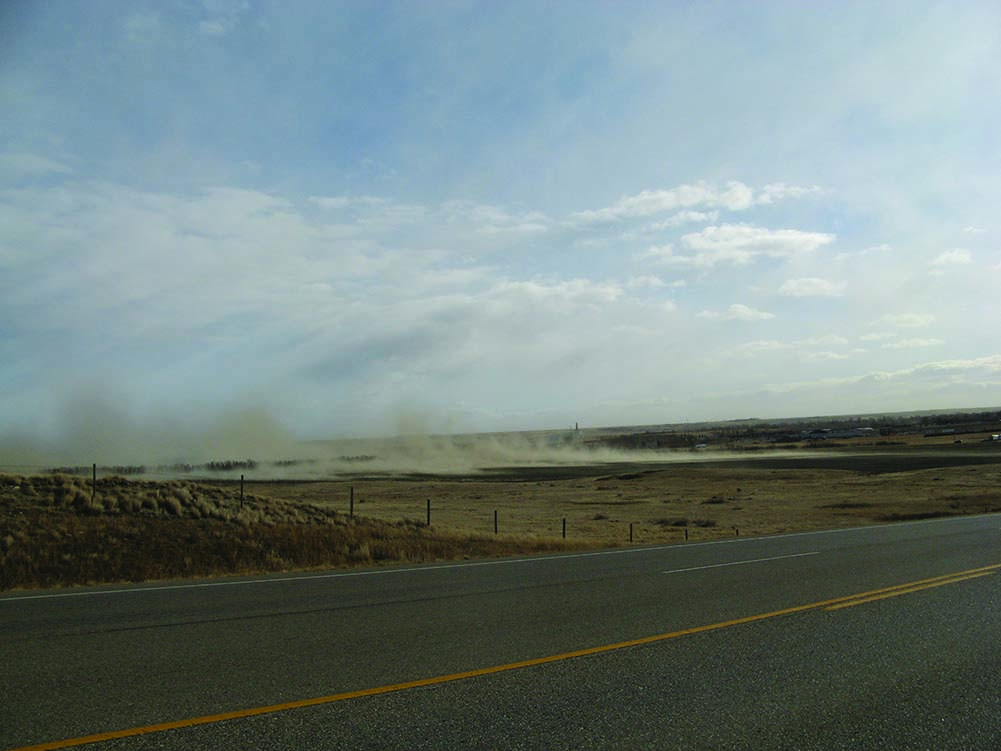
Primary particulate matter resulting from wind erosion
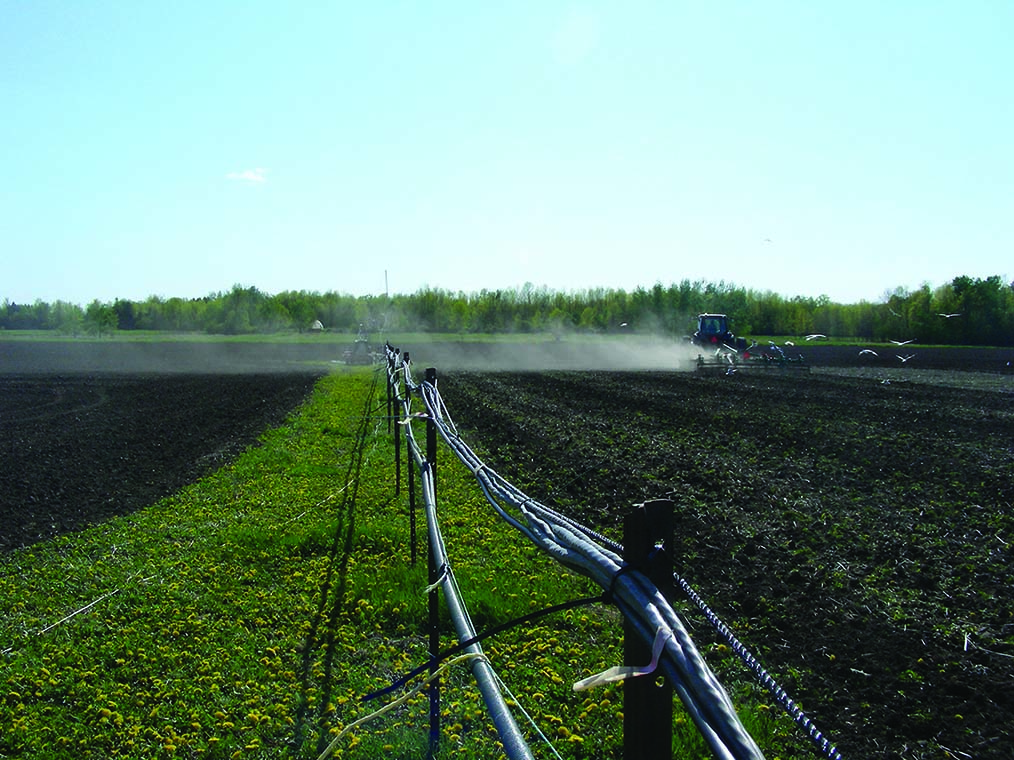
Primary particulate matter resulting from land preparation (tillage)
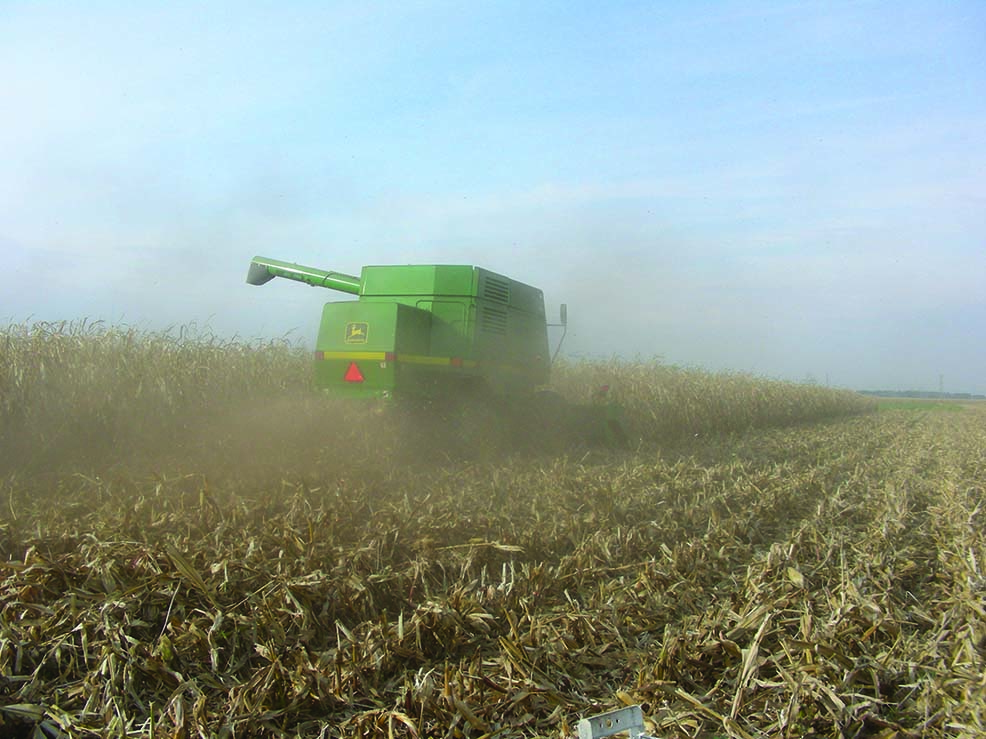
Primary particulate matter resulting from harvest
Particulate matter explained
What is the difference between primary and secondary particulate matter?
Primary PM refers to particles that are released intact into the air. Primary PM results from processes such as wind erosion and tillage (dust), burning (soot), crop harvesting and grain handling (grain dust).
Secondary PM refers to particles that are formed in the air. For example, ammonia may react with other airborne pollutants to form particles that contribute to smog (Figure 1).
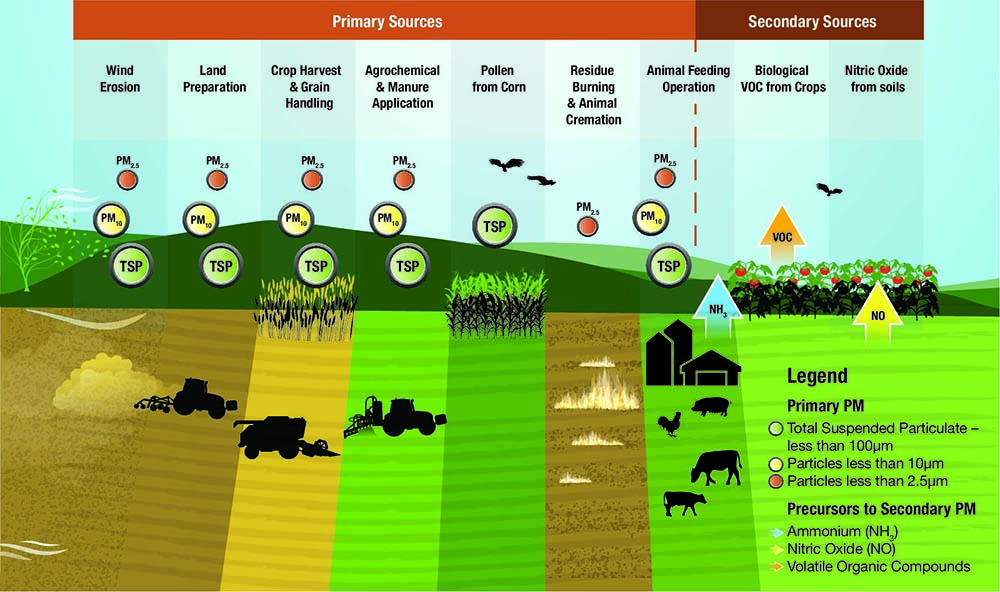
Figure 1. Main activities and factors contributing to primary and second PM emissions in agriculture
Description of image above
The graphic illustrates the on-farm sources of particulate matter and the size of particulate matter associated with each. The following activities and factors generate all three sizes of particulate matter (TSP, PM10 emissions and PM2.5 emissions): wind erosion; land preparation; crop harvest and grain handling, agrochemical and manure application; and animal feeding. Residue burning and animal cremation generates PM2.5 emissions. In addition, the following activities generate chemicals that are precursors to secondary particulate matter: animal feeding (which generates ammonium – NH3); some types of crop produce biological volatile organic compounds (VOCs); and soils can generate nitric oxide (NO).
Particulate matter explained
What do the different size classes of particulate matter represent?
Particulate matter is comprised of millions of different chemical compounds, dust and biological material, including feather fibres, dander and bacteria. These particles are classified according to their aerodynamic diameter and illustrated in Figure 2. They are defined as follows:
- PM2.5
- Particles with an aerodynamic diameter of less than 2.5 micrometers. These particles are easily inhaled into the lower airways (the gas-exchange regions of the lungs) and deposited in the lungs, causing adverse health effects.
- PM10
- Particles with an aerodynamic diameter of less than 10 micrometers, including PM2.5. These particles can be inhaled into and settle in the bronchi and lungs, leading to health problems.
- TSP
- Total suspended particulates consist of all PM suspended in the atmosphere with an aerodynamic diameter of less than 100 micrometers.
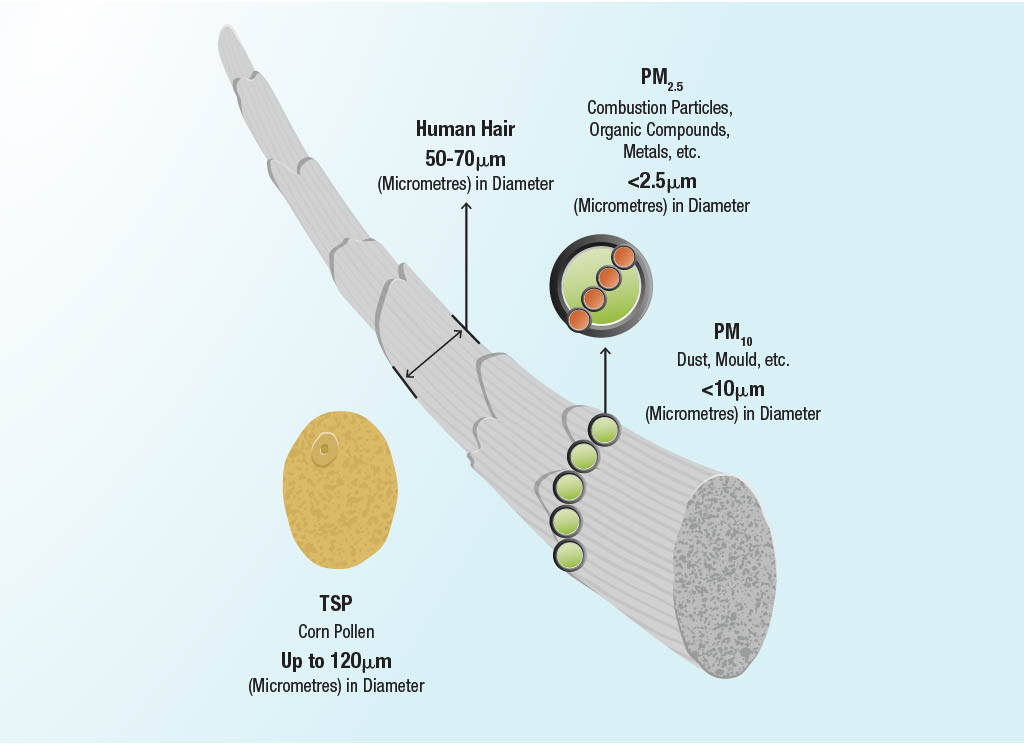
Figure 2. Particle matter size classes
Description of image above
The diagram uses a human hair, between 50 and 70 micrometres in diameter to illustrate the particulate matter size classes.
TSP corn pollen up to 120 micrometres in diameter
PM10 Dust, mould, etc. less than 10 micrometres in diameter
PM2.5 combustion particles, organic compounds, metals, etc. less than 2.5 micrometres in diameter
The indicator
The APMEI model has been modified, and new data, including data from the 2016 Census of Agriculture, have been incorporated into the analysis since the previous Agri-Environmental Indicator report (Clearwater, R.L., T. Martin and T. Hoppe, 2016). To improve inter-model consistency, estimates of PM from wind erosion are now based directly on the Erosion Risk Indicator. This results in a significantly reduced contribution of wind erosion to PM emissions, which is in keeping with recent but as yet unpublished wind erosion validation work (David Lobb, personal communication; and see Soil erosion concerns overblown?). Particulate matter from grain handling has been dropped from the calculations because it is largely an “off-farm” PM source, and therefore outside the scope of the agri-environmental indicator program. Analysis of PM by month is not a part of this implementation of the model. The PM estimates for all previous Census years have been recalculated, resulting in differences in reported values. In the event of a discrepancy between the findings in the two reports, this report should be used.
The APMEI was developed to estimate emissions of primary PM from agricultural operations and to assess the effect of practices adopted to mitigate these emissions. The indicator estimates annual agricultural emissions for three classes of PM (TSP, PM10 and PM2.5 in kilotons (kt) per year). Agricultural sources of PM include wind erosion, land preparation, crop harvesting, crop residue burning, pollen emission, fertilizer and chemical application, animal feeding operations and carcass burning.
To calculate the APMEI, activity data are collected for each agricultural source and a corresponding emission factor is applied in order to estimate the total PM emissions. For example, emissions of primary PM from crop harvesting are calculated by multiplying the area of the crop concerned by an emission factor (kg of PM per ha of crop type per year). Most of the activity data stem from the Census of Agriculture and the Farm Environmental Management Survey (FEMS). PM emission calculations were completed for each Census year at the Soil Landscape of Canada (SLC) polygon level, and then the PM emissions for each SLC polygon were summed to estimate emissions at the provincial and national scales. The range of emissions was divided into five relative risk classes, ranging from very low to very high risk, to highlight both the changes within an individual SLC polygon over the time period of interest (1981 to 2016) and the differences between SLC polygons on an annual basis. The classes obtained from each agricultural SLC polygon provide an indication of the size of the contributions of PM, but are not directly related to regional air quality.
Limitations
To provide a comprehensive estimate of emissions of primary PM, the APMEI takes into account the widest possible range of agricultural activities that are likely to generate emissions. There are, however, some limitations, which are mainly related to the quality of the activity data and the corresponding emission factors. Where possible, missing activity data were estimated based on expert opinion or obtained from other government agencies (e.g. data on chemical pesticide applications). Since few emission factors have been derived to date for Canadian agricultural systems, it is necessary to use factors from studies conducted in the United States where conditions may not match those in Canada.
Local and regional air quality is influenced by numerous environmental factors that ultimately control the dispersion and distribution of PM from the original source. The daily variation in PM emissions from most agricultural sources is not discernible in results presented on an annual basis.
Although the indicator focuses on primary PM from agricultural operations, secondary PM is also an important component of agricultural PM emissions. To get a complete picture of PM emissions in the agriculture sector, emissions of secondary PM need to be incorporated into this indicator in the future.
Further research on agricultural PM emissions and emission factors relevant to Canadian conditions could enhance the Agricultural Particulate Matter Emissions Indicator (APMEI) and contribute to better modelling of PM emissions. This could include integrating secondary PM into the APMEI—a step that will require collaboration with atmospheric modelling experts.
Results and Interpretation
In 2016, total agricultural PM emissions in Canada were estimated at 1889 kt for TSP, 605 kt for PM10 and 206 kt for PM2.5 (Table 1). Figures 3, 4 and 5 map the spatial distribution of PM emission rates per hectare of farmland, at the scale of SLC polygons, for TSP, PM10 and PM2.5 respectively, for 2016. For all PM classes, there are areas of High or Very High emissions in the Fraser Valley of British Columbia, the Moist Mixed Grassland, Mixed Grassland, Aspen Parkland and Manitoba Plains regions of the Prairies, and in the Manitoulin-Lake Simcoe, Lake Erie Lowlands and St. Lawrence Lowlands of Ontario and Quebec. Very High emissions are in regions with both intensive livestock production and intensive crop production, such as the Fraser Valley, Southern Alberta, and Manitoba.
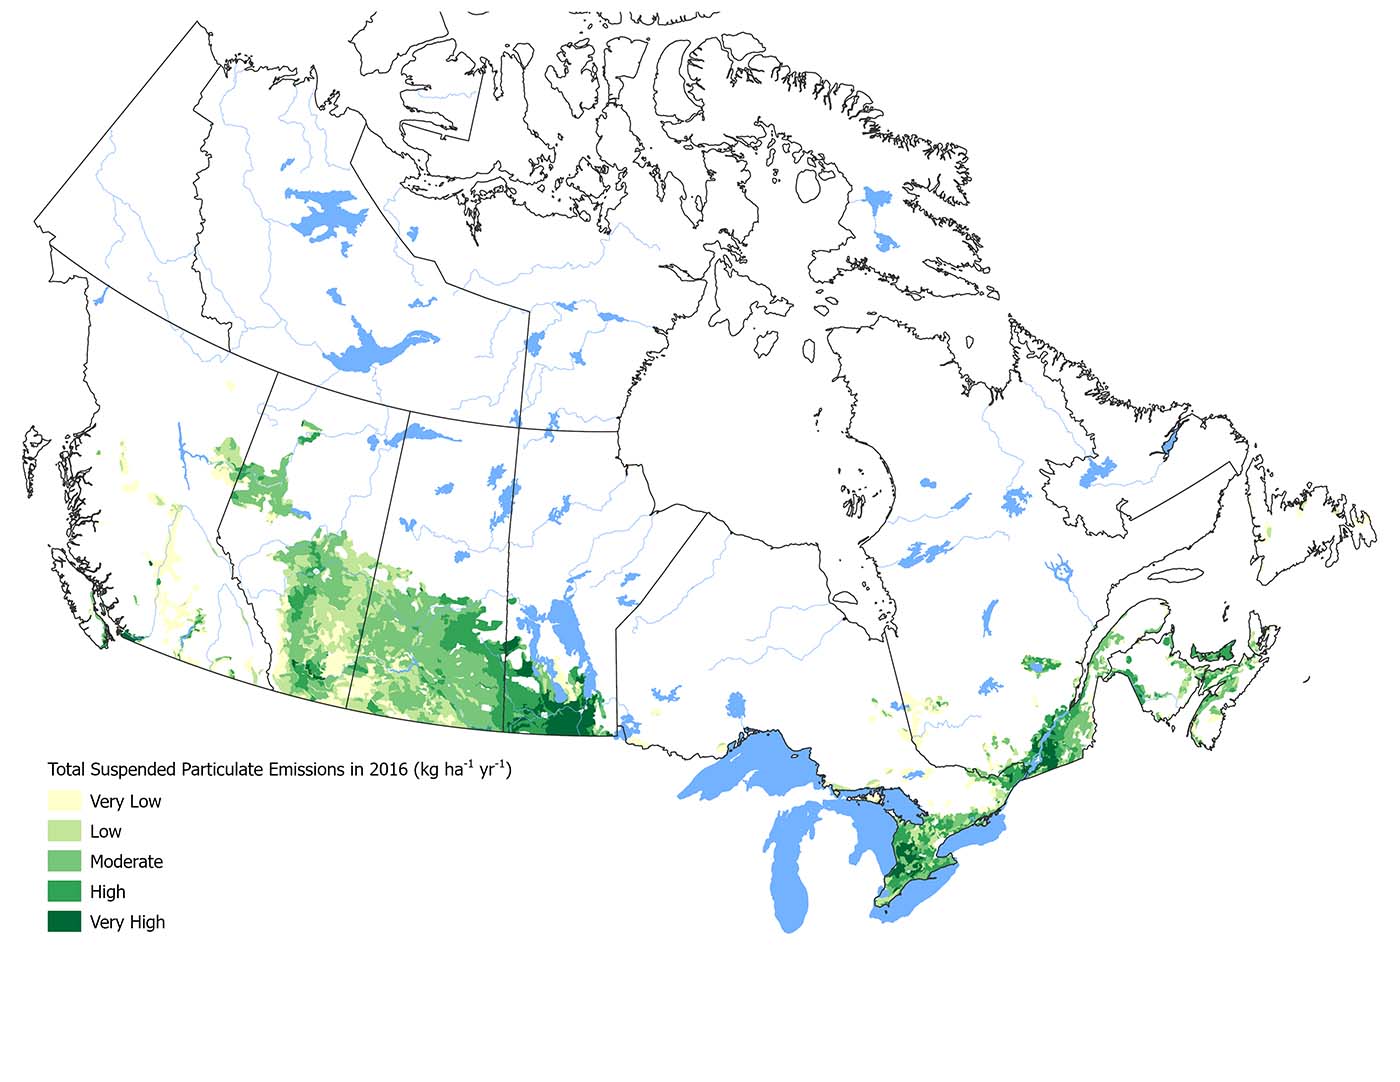
Figure 3. PM TSP Emissions (kg ha-1 yr-1) in 2016
Description of image above
Figure 3 illustrates the total suspended particulate emissions in 2016, across the Canadian agricultural extent, color coded based on the proportion of agricultural land.
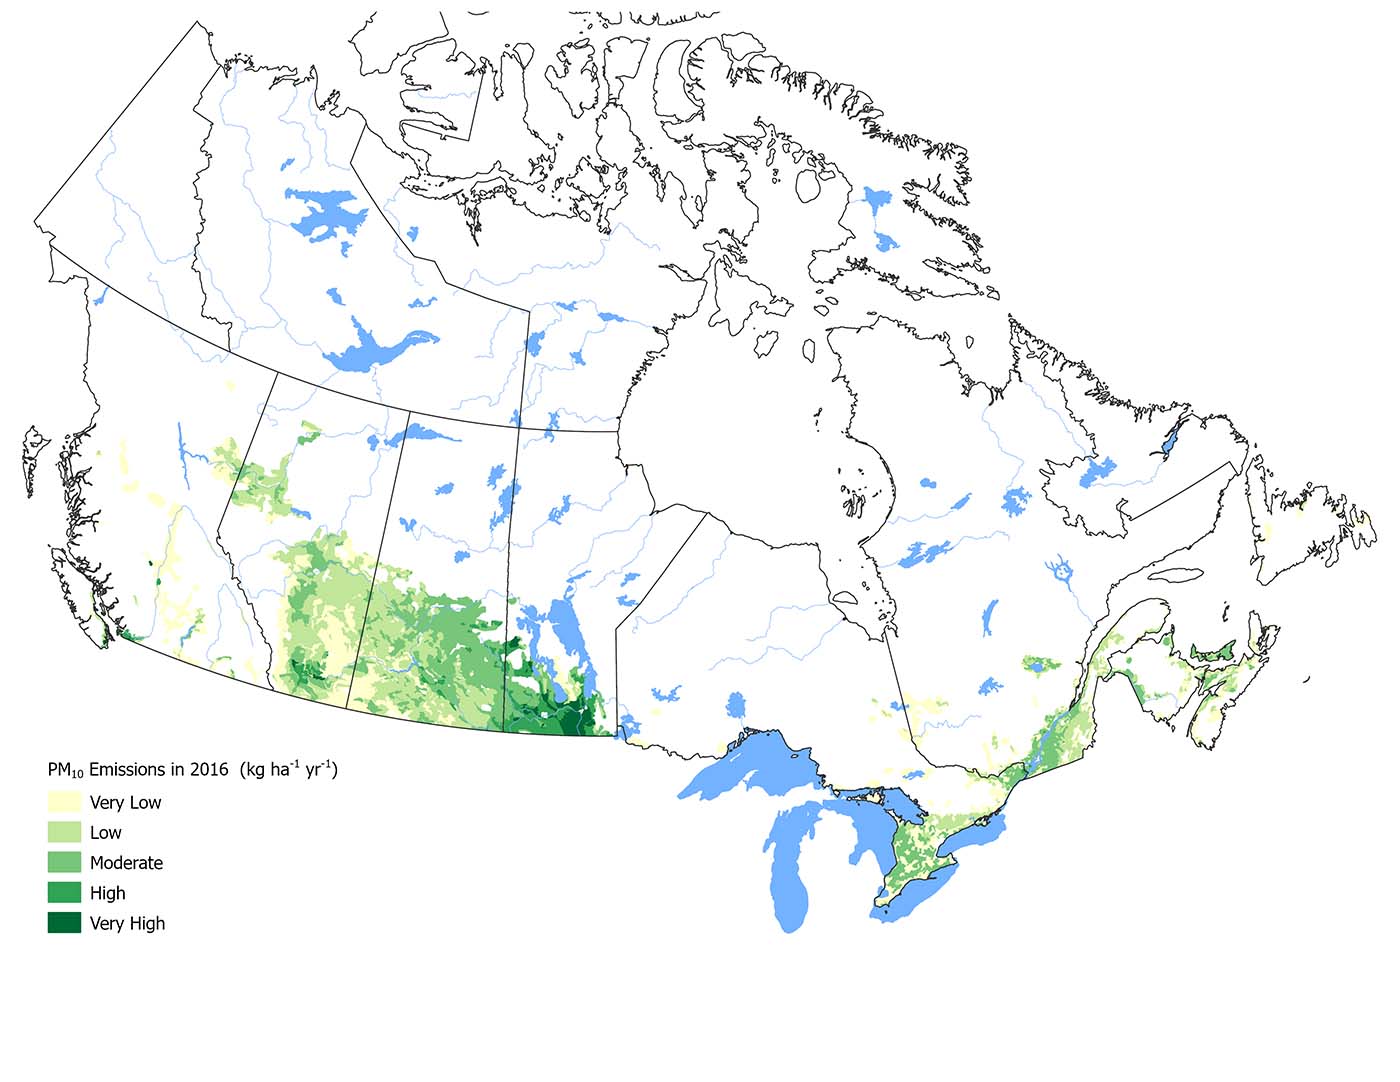
Figure 4. PM10 Emissions (kg ha-1 yr-1) in 2016
Description of image above
Figure 4 illustrates the PM10 suspended particulate emissions in 2016, across the Canadian agricultural extent, color coded based on the proportion of agricultural land.
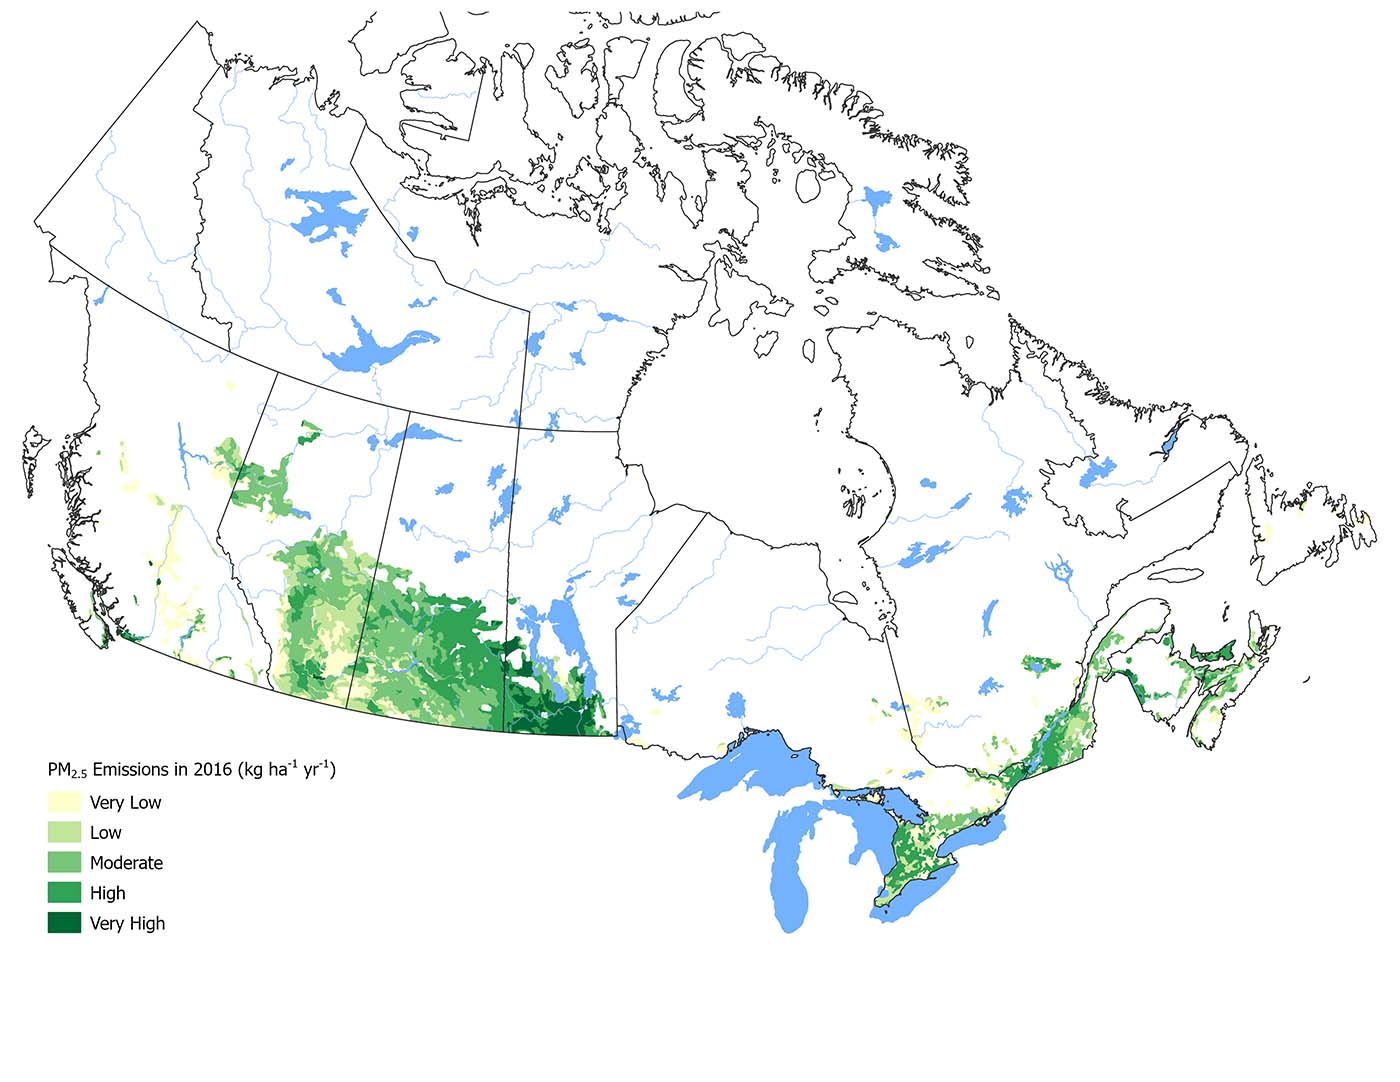
Figure 5. PM2.5 Emissions (kg ha-1 yr-1) in 2016
Description of image above
Figure 5 illustrates the PM2.5 suspended particulate emissions in 2016, across the Canadian agricultural extent, color coded based on the proportion of agricultural land.
Table 1: Particulate Matter Emissions (in kilotons) from Canadian Agricultural Operations (1981 – 2016).
|
TSP Emission (kt yr -1) |
PM10 Emissions (kt yr -1) |
PM2.5 Emissions (kt yr -1) |
||||||||||||||||
|---|---|---|---|---|---|---|---|---|---|---|---|---|---|---|---|---|---|---|
|
Province |
1981 |
1991 |
2001 |
2006 |
2011 |
2016 |
1981 |
1991 |
2001 |
2006 |
2011 |
2016 |
1981 |
1991 |
2001 |
2006 |
2011 |
2016 |
|
B.C. |
55 |
47 |
37 |
28 |
26 |
22 |
13 |
11 |
8 |
6 |
6 |
5 |
5 |
4 |
3 |
3 |
2 |
2 |
|
Alta. |
1507 |
1388 |
873 |
651 |
452 |
405 |
453 |
419 |
260 |
199 |
143 |
132 |
141 |
130 |
83 |
63 |
45 |
40 |
|
Sask. |
3323 |
2980 |
1782 |
1173 |
785 |
631 |
1092 |
986 |
578 |
381 |
264 |
229 |
309 |
281 |
176 |
125 |
91 |
84 |
|
Man. |
756 |
681 |
558 |
451 |
396 |
468 |
250 |
239 |
193 |
163 |
142 |
169 |
70 |
66 |
55 |
48 |
42 |
51 |
|
Ont. |
499 |
416 |
405 |
181 |
192 |
215 |
46 |
42 |
37 |
36 |
36 |
41 |
19 |
17 |
15 |
14 |
14 |
16 |
|
Que. |
150 |
170 |
239 |
125 |
119 |
127 |
20 |
19 |
25 |
24 |
22 |
24 |
8 |
8 |
10 |
10 |
9 |
10 |
|
Atlantic |
25 |
21 |
24 |
20 |
22 |
21 |
5 |
5 |
5 |
5 |
5 |
5 |
2 |
2 |
2 |
2 |
2 |
2 |
|
Can |
6315 |
5704 |
3918 |
2629 |
1992 |
1889 |
1879 |
1721 |
1107 |
814 |
619 |
605 |
555 |
509 |
344 |
264 |
206 |
206 |
Total PM emissions from agricultural sources in Canada show a decreasing trend from 1981 to 2016 (Tables 1 and 2), with a decline of 70% for TSP, 68% for PM10 and 63% for PM2.5. Between 2011 and 2016, the decrease for all three PM classes was about 9%, demonstrating continuous recent improvements in this indicator. Figure 6 illustrates the net change in TSP emission rates between 1981 and 2016, by SLC polygon. (The spatial distribution of results is similar for TSP, PM10 and PM2.5; therefore, only the TSP map is presented here). Improvements are apparent across the country in all regions, with the Prairie region showing the greatest improvement. This can be attributed directly to the implementation of soil management BMPs such as reduced tillage and to the reduction in summerfallow, which have reduced PM emissions resulting from tillage and wind erosion in this region.
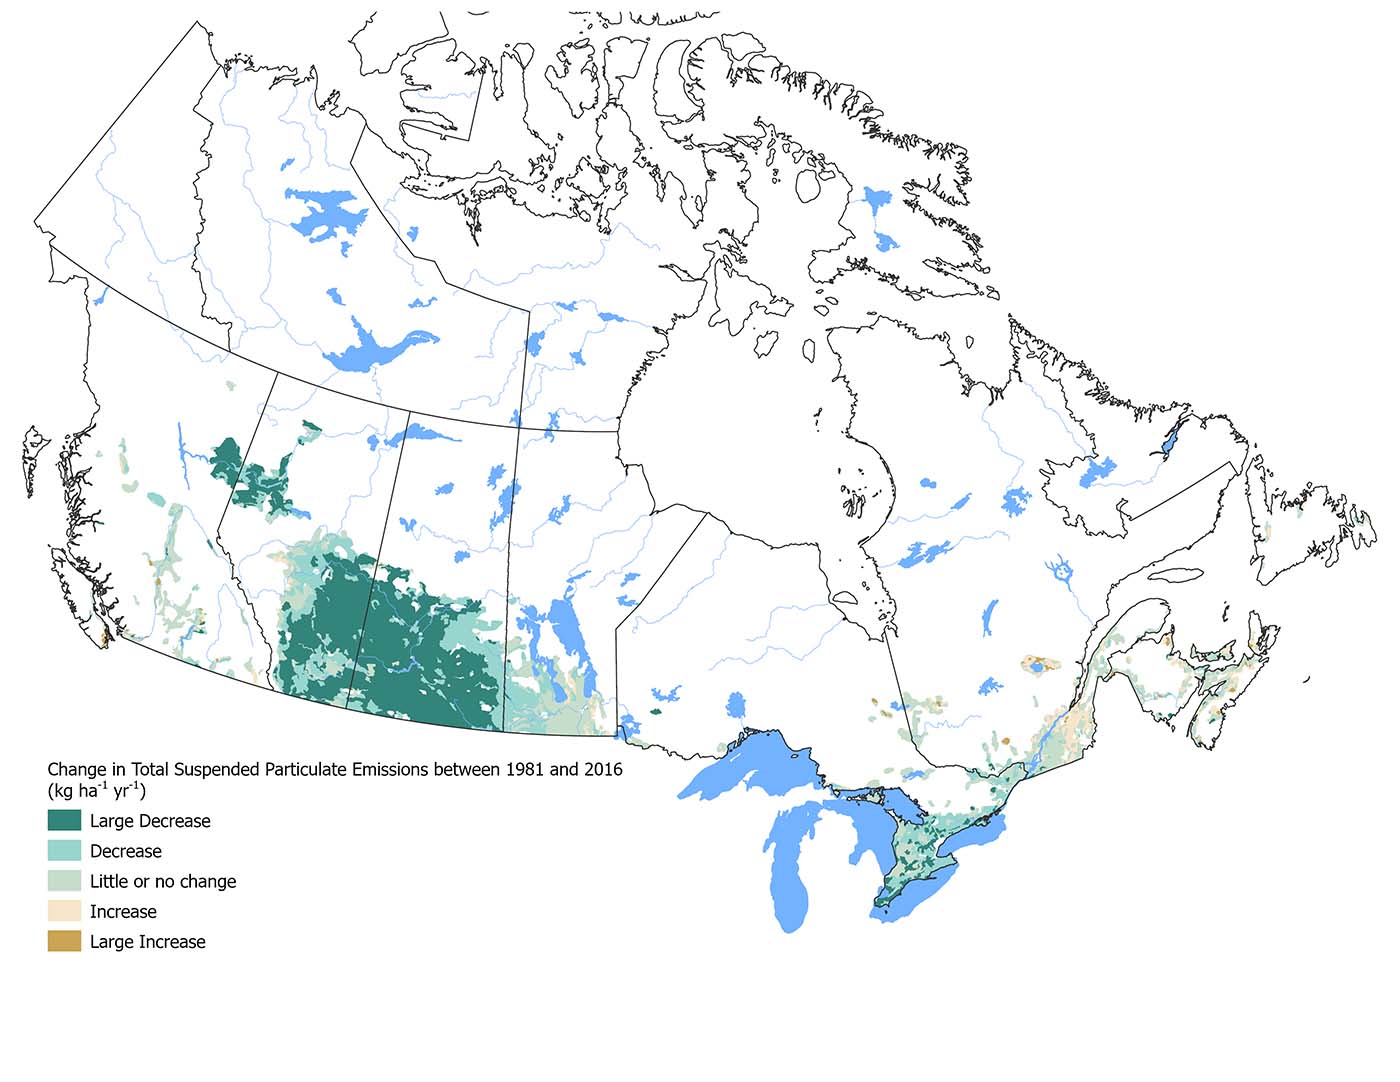
Figure 6. Change in TSP Emissions (kg ha-1 yr-1) between 1981 – 2016 (negative values indicate decreased emissions with time).
Description of image above
Figure 6 illustrates the change in total suspended particulate emissions between 1981 and 2016, across the Canadian agricultural extent, color coded based on the proportion of agricultural land.
Table 2: Percentage of Farmland in each Emission Intensity Class (1981 – 2016)
| Class | Year
|
B.C.
|
Alta.
|
Sask.
|
Man.
|
Ont.
|
Que.
|
N.B.
|
N.S.
|
P.E.I.
|
N.L.
|
Can.
|
|
Very Low |
1981 |
31 |
4 |
1 |
3 |
7 |
10 |
4 |
8 |
0 |
92 |
4 |
|
1991 |
33 |
6 |
2 |
3 |
7 |
9 |
4 |
5 |
0 |
100 |
5 |
|
|
2001 |
39 |
8 |
2 |
3 |
7 |
7 |
2 |
6 |
0 |
65 |
5 |
|
|
2006 |
42 |
10 |
3 |
3 |
14 |
9 |
3 |
8 |
0 |
85 |
7 |
|
|
2011 |
44 |
13 |
4 |
3 |
12 |
10 |
5 |
7 |
0 |
97 |
8 |
|
|
2016 |
46 |
16 |
8 |
2 |
9 |
9 |
4 |
7 |
0 |
94 |
11 |
|
|
Low |
1981 |
11 |
4 |
1 |
1 |
3 |
12 |
36 |
16 |
0 |
8 |
3 |
|
1991 |
14 |
5 |
0 |
2 |
6 |
14 |
33 |
19 |
0 |
0 |
3 |
|
|
2001 |
7 |
8 |
2 |
1 |
5 |
4 |
22 |
12 |
0 |
33 |
4 |
|
|
2006 |
12 |
11 |
4 |
2 |
19 |
6 |
33 |
30 |
0 |
12 |
8 |
|
|
2011 |
15 |
26 |
10 |
1 |
15 |
9 |
23 |
24 |
0 |
3 |
15 |
|
|
2016 |
25 |
29 |
18 |
2 |
17 |
5 |
25 |
16 |
0 |
6 |
19 |
|
|
Moderate |
1981 |
12 |
9 |
3 |
1 |
8 |
32 |
26 |
47 |
32 |
0 |
7 |
|
1991 |
11 |
15 |
5 |
3 |
11 |
28 |
30 |
48 |
42 |
0 |
10 |
|
|
2001 |
17 |
27 |
8 |
4 |
8 |
16 |
37 |
46 |
12 |
3 |
14 |
|
|
2006 |
26 |
44 |
20 |
5 |
26 |
27 |
29 |
40 |
51 |
3 |
27 |
|
|
2011 |
26 |
48 |
52 |
5 |
29 |
23 |
34 |
40 |
20 |
0 |
42 |
|
|
2016 |
13 |
44 |
58 |
4 |
25 |
25 |
28 |
46 |
23 |
0 |
42 |
|
|
High |
1981 |
16 |
30 |
8 |
9 |
33 |
20 |
33 |
18 |
68 |
0 |
18 |
|
1991 |
20 |
29 |
10 |
10 |
29 |
11 |
33 |
16 |
58 |
0 |
18 |
|
|
2001 |
25 |
43 |
47 |
33 |
31 |
25 |
32 |
28 |
88 |
0 |
42 |
|
|
2006 |
12 |
29 |
69 |
50 |
35 |
29 |
35 |
19 |
49 |
0 |
48 |
|
|
2011 |
7 |
12 |
33 |
50 |
37 |
30 |
35 |
25 |
80 |
0 |
28 |
|
|
2016 |
7 |
10 |
16 |
41 |
34 |
32 |
41 |
25 |
77 |
0 |
19 |
|
|
Very High |
1981 |
29 |
52 |
87 |
86 |
49 |
26 |
0 |
10 |
0 |
0 |
68 |
|
1991 |
22 |
45 |
83 |
82 |
46 |
39 |
0 |
13 |
0 |
0 |
64 |
|
|
2001 |
11 |
14 |
41 |
59 |
50 |
49 |
7 |
8 |
0 |
0 |
35 |
|
|
2006 |
8 |
5 |
5 |
40 |
6 |
28 |
0 |
2 |
0 |
0 |
10 |
|
|
2011 |
8 |
2 |
1 |
40 |
8 |
28 |
4 |
4 |
0 |
0 |
7 |
|
|
2016 |
7 |
1 |
0 |
51 |
16 |
30 |
2 |
6 |
0 |
0 |
8 |
The decrease in PM emission rates that occurred between 1981 and 2016 (Figure 7) strongly reflects changes in land use and management practices. Significant reduction in tillage for land preparation, a reduction of summerfallow, and reduced wind erosion risk due to tillage reduction and increased residue cover, all lead to reduced PM emission rates. These more than offset emission rate increases associated with increases in animal populations and fertilizer application.

Figure 7. Change in PM Emissions (TSP) per hectare of Agricultural Land per year Between 1981 and 2016.
Description of image above
TSP emissions by province and year, kg ha-1 y-1
|
Province |
1981 |
1986 |
1991 |
1996 |
2001 |
2006 |
2011 |
2016 |
|
British Columbia |
58.4 |
59.2 |
50.6 |
42.1 |
39.7 |
29.8 |
27.3 |
23.4 |
|
Alberta |
88.4 |
89.4 |
81.4 |
68.8 |
51.2 |
38.2 |
26.5 |
23.8 |
|
Saskatchewan |
146.0 |
137.4 |
131.0 |
104.4 |
78.3 |
51.5 |
34.5 |
27.7 |
|
Manitoba |
137.1 |
133.5 |
123.5 |
111.4 |
101.3 |
81.7 |
71.8 |
84.9 |
|
Ontario |
107.0 |
92.4 |
89.1 |
84.7 |
86.8 |
38.7 |
41.2 |
40.9 |
|
Quebec |
68.2 |
73.1 |
77.1 |
85.4 |
108.1 |
56.8 |
53.9 |
57.5 |
|
Atlantic Canada |
48.2 |
44.2 |
41.2 |
45.2 |
47.4 |
39.3 |
42.0 |
41.5 |
|
Canada |
117.7 |
112.9 |
106.3 |
89.6 |
73.0 |
49.0 |
37.1 |
35.2 |
Land preparation tillage, wind erosion, crop harvesting and fertilizer application are the principal sources of PM emissions from cultivated cropland (Figure 8). About 55% of all PM emissions from cultivated cropland stem from land preparation operations, while wind erosion is the source of another 22%. Ninety percent of these emissions are associated with annual cropland, while summerfallow is the source of approximately 8%, and forage crops 2%. Particulate matter emissions from pasture land are negligible. The remaining main annual agricultural TSP emissions, in decreasing order, are from harvest (12%), fertilizer application (10%). The specific contributions in 2016 of agriculture-related sources of PM emissions, which also includes corn pollen, pesticide application, animal feeding, crop burning and carcass cremation, are shown in Figure 9.
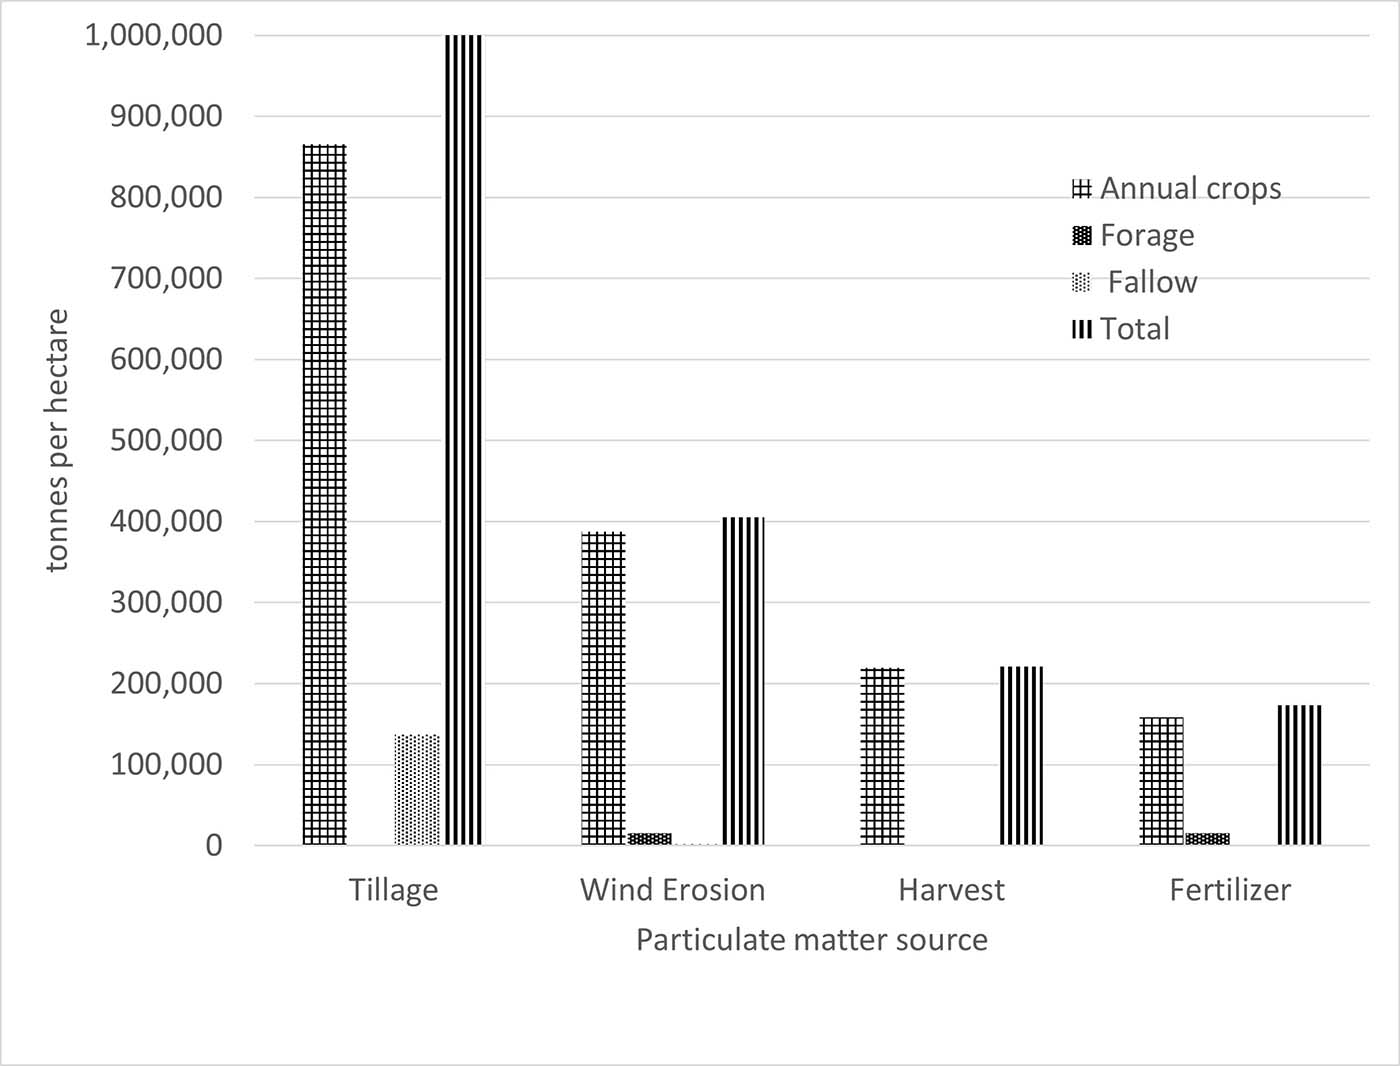
Figure 8. Contribution of land cover to PM emissions in 2016 associated with land preparation, wind erosion, crop harvesting and fertilizer application.
Description of image above
| Tillage | Wind Erosion | Harvest | Fertilizer | Total | |
|---|---|---|---|---|---|
|
Annual crops |
865,210 |
387,670 |
219,599 |
158,189 |
1,630,668 |
|
Forage |
0 |
15,309 |
1,200 |
15,420 |
31,929 |
|
Fallow |
137,264 |
1,965 |
0 |
0 |
139,228 |
|
Total |
1,002,473 |
404,944 |
220,799 |
173,609 |
1,801,825 |
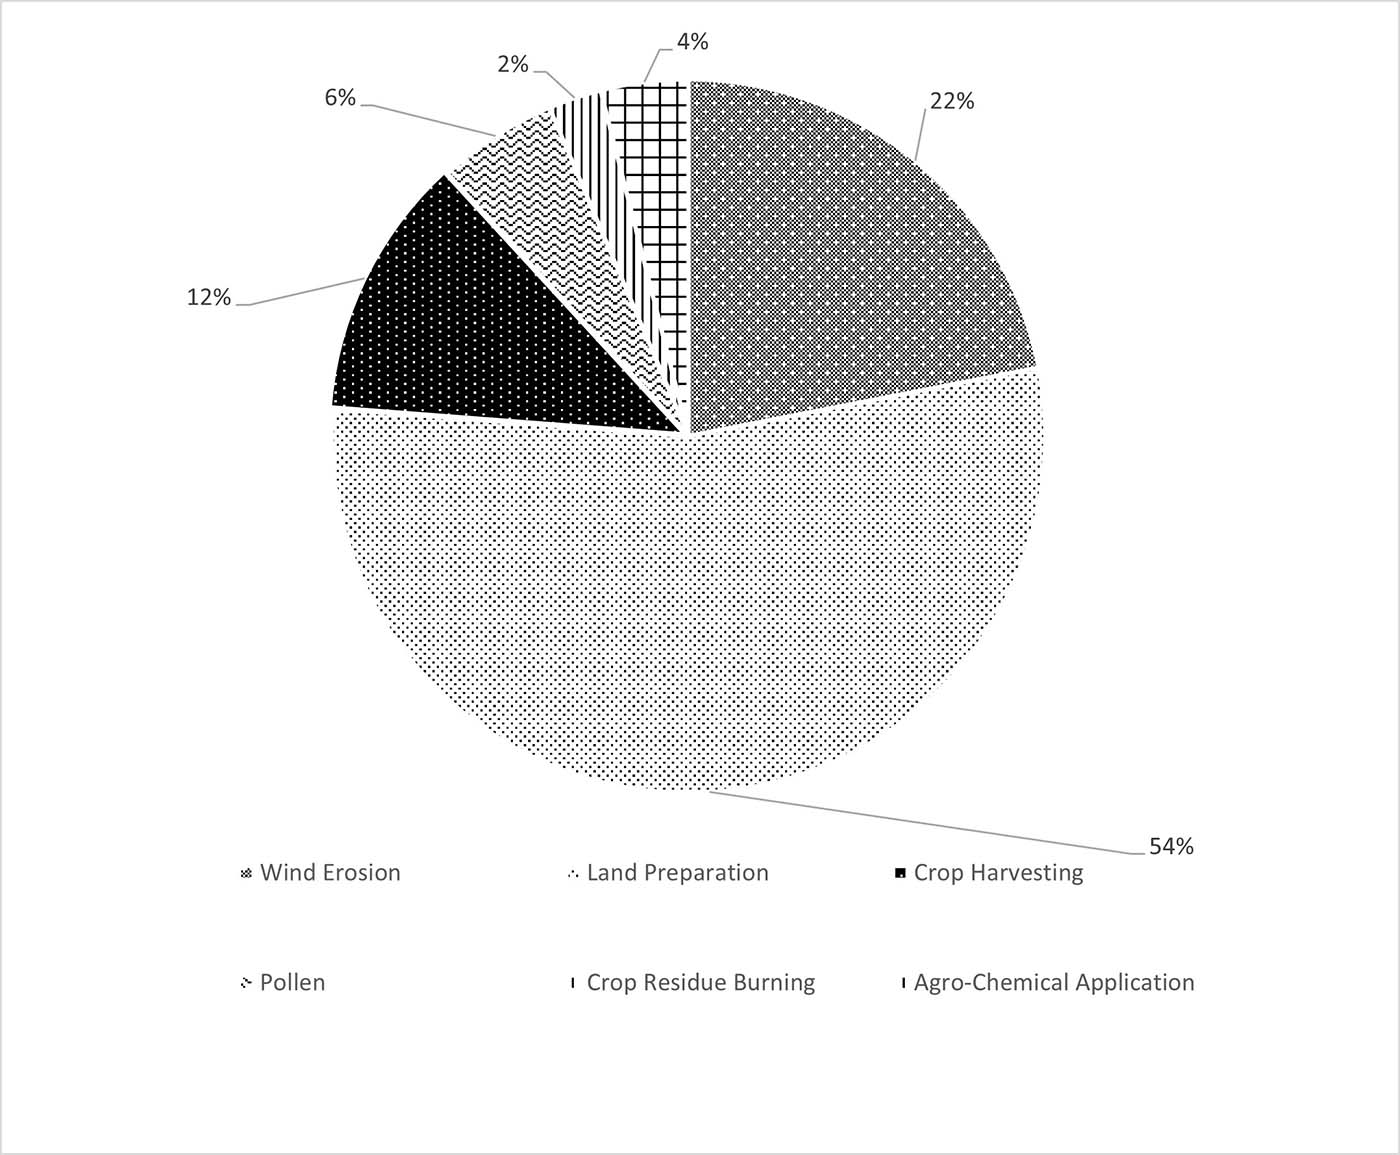
Figure 9a. Contribution of agriculture-related sources to TSP emissions in 2016
Description of image above
|
|
TSP |
% |
|---|---|---|
|
Wind erosion |
404912889 |
21.9 |
|
Land preparation |
1002473115 |
54.3 |
|
Crop harvesting |
220799343 |
12 |
|
Pollen |
100643996 |
5.45 |
|
Crop residue burning |
44458551 |
2.41 |
|
Agro-chemical application |
73256890 |
3.97 |
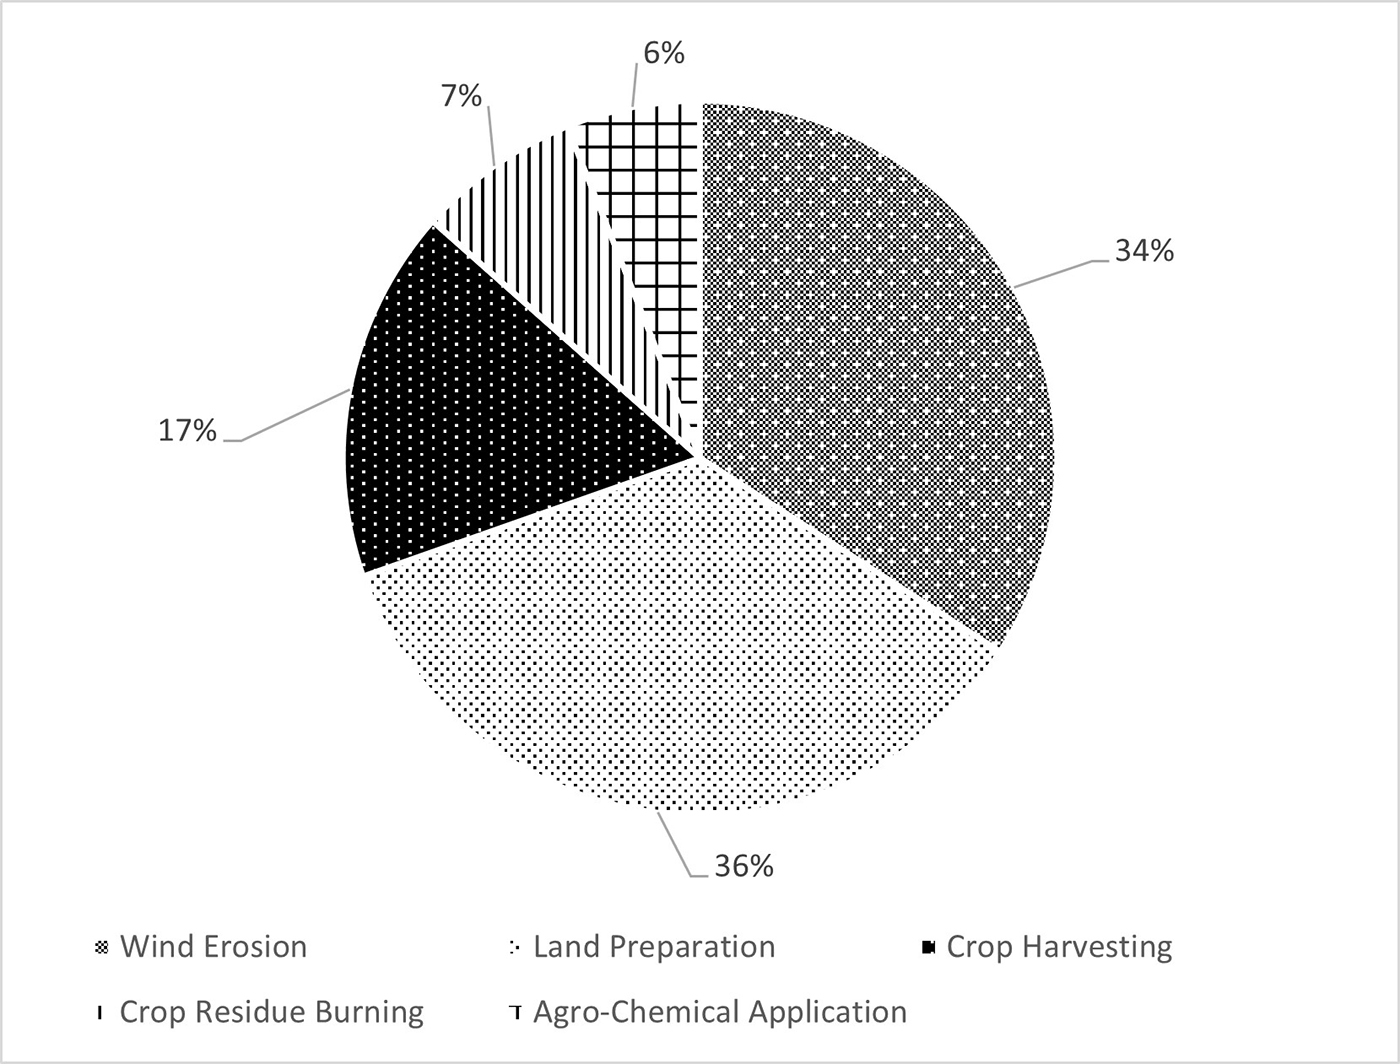
Figure 9b. Contribution of agriculture-related sources to PM10 emissions in 2016
Description of image above
| PM10 | % | |
|---|---|---|
|
Wind erosion |
202456445 |
34.13 |
|
Land preparation |
210519354 |
35.49 |
|
Crop harvesting |
100363338 |
16.92 |
|
Pollen |
0 |
0 |
|
Crop residue burning |
43874785 |
7.396 |
|
Agro-chemical application |
35970449 |
6.064 |
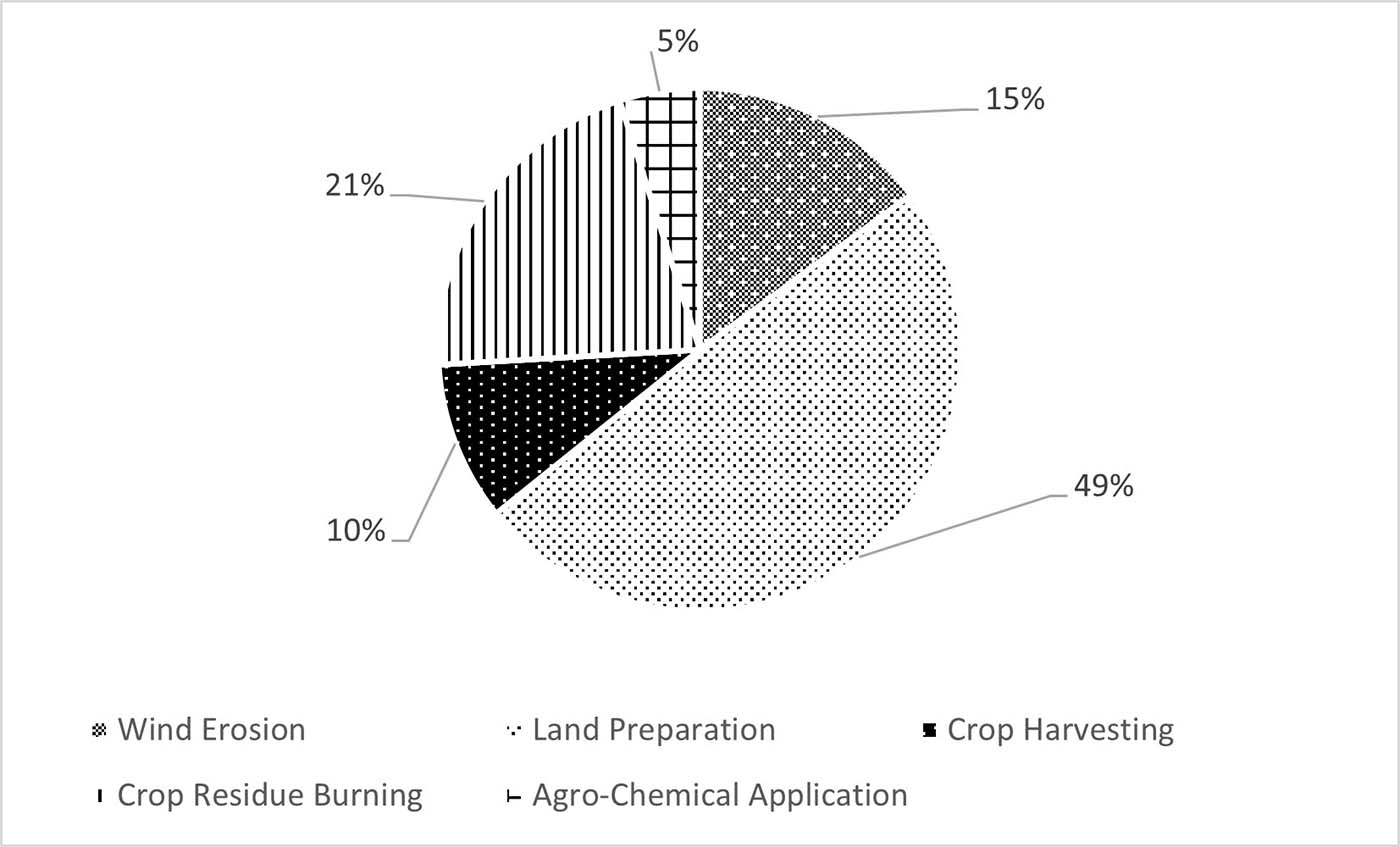
Figure 9c. Contribution of agriculture-related sources to PM2.5 emissions in 2016
Description of image above
| PM2.5 | % | |
|---|---|---|
|
Wind erosion |
30368467 |
14.93 |
|
Land preparation |
100247312 |
49.29 |
|
Crop harvesting |
20072668 |
9.869 |
|
Pollen |
0 |
0 |
|
Crop residue burning |
42613326 |
20.95 |
|
Agro-chemical application |
10089272 |
4.961 |
Response options
There are many land-use practices that can be modified in order to mitigate agricultural PM emissions. The specific mitigation measures that are useful depend on the agricultural operation concerned. Practices that are effective in reducing PM emissions include increasing soil cover on cropland and decreasing the area of summerfallow.
Primary PM from animal feeding operations is attributable to livestock activities in barns or on feedlots. PM emissions can be reduced by changing the production environment in the following ways: decreasing animals’ confinement time (or increasing the grazing period), collecting litter and manure more frequently, installing dust extraction or filtered ventilation systems, and sprinkling water mist or oil onto the floor or ground surface to reduce dust.
Increasing the amount of soil cover can bring about a significant decrease in PM emissions caused by wind erosion. The key practices that can be used to increase soil cover include using reduced tillage and no-till, decreasing the amount of land under summerfallow, increasing the area of permanent grassland, using forages in rotations, growing winter cover crops, and using strip cropping, contour cultivation and windbreaks.
Airborne soil PM emissions are generated during tillage by the mechanical operations used to prepare the soil. PM emissions from agricultural tillage are proportional to the area tilled, the type of tillage implement used (for example, disking versus ploughing) and the number of tillage operations performed in a year. Reducing tillage frequency or using no-till reduces PM emissions. In addition, using chemical weed control on summerfallow land can reduce PM emissions by decreasing the number of tillage operations required in a year.
PM emissions associated with crop harvesting are generated when combines and other types of farm machinery are operated in fields. These emissions vary with the type of crop. There are few specific practices that can reduce PM emissions from crop harvesting.
Crop harvesting under conditions of high relative humidity and low wind speed can mitigate PM emissions. Some practices used for wind erosion control, such as the use of terraces, contouring and strip-cropping, decrease the transport of harvested crop fragments by the wind. Using reduced tillage or no-till practices and managing crop residues decreases PM emissions from farm machinery operated in fields.
PM emissions can occur when fertilizer applications are made in windy conditions or when land preparation operations disturb the soil. Optimum nutrient management is the best way to reduce PM emissions associated with the application of fertilizer. This includes optimizing the timing of fertilizer application and fertilizer placement and matching applications to the nutrient needs of crops.
The application of agrochemicals to cropland is a widely used management practice in Canadian agricultural systems. This practice greatly improves productivity, but chemical drift from such applications may contribute to TSP emissions. Although the estimated emissions from this source are currently estimated to be very low, chemical drift may have significant negative local impacts compared to other agricultural sources. The risk of chemical drift and associated TSP emissions can be reduced by restricting applications to cool days with calm conditions, selecting the appropriate nozzle, reducing sprayer travel speed and lowering sprayer boom height.
Continued research and development will help to expand the existing knowledge base and increase confidence in reported values and the effectiveness of mitigation solutions. Research will also strengthen our predictive capacity, for instance, our ability to predict the effects of climate change and the associated changes in the agricultural landscape, which can affect future PM emissions. The knowledge that is acquired will allow the agricultural sector to continue to respond effectively and efficiently as markets, production systems and climates change.
References
Canadian Centre for Occupational Health and Safety, 2012. Canadian Centre for Occupational Health and Safety (last visited March 10, 2022)
Donham, K.J., and A. Thelin, 2006. Agricultural medicine: Rural occupational and environmental health for the health professions. Victoria, Australia: Blackwell Publishing.
Samet, J., and D. Krewski, 2007. Health effects associated with exposure to ambient air pollution. Journal of Toxicology and Environmental Health. 70: 227-242.
Saxton, K.E., 1996. Agricultural wind erosion and air quality impacts: A comprehensive research program. American Journal of Alternative Agriculture. 11: 64-70.
United States Environmental Protection Agency (U.S. EPA), 2004. Air quality criteria for particulate matter. EPA Report 600/P-99/002aF-bF. Washington, DC: Environmental Protection Agency.