

Note: This report includes forecasting data that is based on baseline historical data.
Executive summary
The snack market in United States (U.S.) is experiencing consistent growth across all categories. Over the 2018 to 2022 period, snacks saw 6.9% growth annually to a market value of US$156.7 billion.
Savoury snacks experienced the highest growth at 8.1% annually. Over 2023 to 2027, sweet biscuits, snack bars, and fruit snacks are projected to grow the strongest by 4.7% to 33.6 billion in 2027.
2022 marked the first full year of post-pandemic economic reopening, without foodservice limitations, with vaccinations fully available, and a return to hybrid or office working as well as students returning to school full time.
Ecommerce showed the highest growth during the pandemic, over 2018 to 2022, and is expected to continue growing at the expense of retail offline channels. Ecommerce sales grew 36.2% annually over 2018 to 2022.
A total of 21,523 new snack products were introduced over the 2018 to 2022 period. Top claims were kosher and no/low focused, while top flavours included plain, "flavours unavailable" followed by strawberry, sea salt, and peanut butter, suggesting that consumers prefer health-conscious snacks.
As snacks brands continue to innovate between health and comfort, perceptions of processed foods and sodium levels force consumers to continue balancing the craving for familiar comfort snacks against the trend of promoting the integration of healthier snacking habits into their daily lives.
Market overview
The snack market in the U.S. has grown consistently across all categories over 2018 to 2022 by 6.9% annually to a market value of US$156.7 billion. Savoury snacks experienced the highest growth at 8.1% annually. Over 2023 to 2027, sweet biscuits, snack bars, and fruit snacks are projected to grow the fastest by 4.7% to 33.6 billion in 2027.
As snacks brands continue to innovate in the health and comfort as perceptions of processed foods and sodium levels force consumers to balance craving for comfort and healthy snacks. For example, no/low claims, healthier production methods, and the replacement of certain ingredients are helping consumers reconcile consumption of their favourite snacks with their desire for healthier snacking.
In addition to ingredients, rising costs in other areas of production, such as transportation and sustainable fuels, are expected to encourage brands to integrate sustainability into brand development. The U.S.' Renewable Fuel Standard outlines standards for renewable fuels to replace or reduce petroleum-based transportation fuel, heating oil, or jet fuel through to 2022. This will result in continued rises in production costs over 2023 to 2027. Ultimately, product innovation and efforts to mediate costs will depend on brands' ability to take initiative on sustainable practices.
| Category | 2018 | 2022 | CAGR* (%) 2018-2022 | 2023 | 2027 | CAGR* (%) 2023-2027 |
|---|---|---|---|---|---|---|
| Snacks | 120,048.3 | 156,706.4 | 6.9 | 170,932.0 | 203,512.5 | 4.5 |
| Savoury snacks | 48,778.9 | 66,637.0 | 8.1 | 73,583.8 | 88,282.0 | 4.8 |
| Confectionery | 34,547.3 | 44,828.8 | 6.7 | 48,843.6 | 59,007.6 | 3.1 |
| Sweet biscuits, snack bars and fruit snacks | 21,097.5 | 26,394.5 | 5.8 | 28,510.0 | 33,616.7 | 4.7 |
| Ice cream | 15,624.6 | 18,846.1 | 4.8 | 19,994.5 | 22,606.2 | 4.2 |
|
Source: Euromonitor International, 2023 *CAGR: Compound annual growth rate |
||||||
Confectionery
Confectionary retail sales increased by 6.7% annually over the 2018 to 2022 period. All categories saw sales growth over 2018 to 2022 except gum, which declined 1.3%, with chocolate with toys and other sugar confectionary sales growing the fastest. Sales of confectionery subcategories are expected to rebound over the next five years by 3.3%. Within chocolate confectionery, sales of seasonal chocolate is forecast to grow the most by 4.5% annually over 2023 to 2027. Sales of sugar confectionery is expected to grow 4.3% and gum by 3.9% annually.
According to Euromonitor, the impacts of the flu, RSV, and COVID-19 in 2022 drove consumers to seek medicated confectionery, such as cough drops, which saw sales soar as a result. The transition to an endemic perception of COVID-19 may leave per capita consumption continually high with the normalisation of in-person work and social occasions.
Consumers' desire for more variety and intensity in snacking flavours is expected to increase demand for fruity, sour, and potentially spicy or botanical offerings. Viral trends have put assertive flavours and textures in the spotlight, such as with the social media frenzy over Toxic Waste sour candy. Novel packaging has also helped drive growth in the category with Bazooka's new Push Pop Gummy Pop, offering a playful multi-sensory experience in a reusable container. Nostalgia and cross-collaboration with non-confectionery categories provide viral marketing potential that engages well with generational shifts in consumer demographic. Although unit prices will increase along with the use of additional inputs, premium offerings is expected to be justifiable as buying power increases for those who still seek out the indulgence of sugary treats as increased costs will not necessarily deter consumers from seeking out these novelties.
At the channel level, the push by e-commerce towards convenience and instant fulfilment has placed more sugar confectionery in more virtual carts, with many delivery services translating the lessons of an impulse purchase strategy in traditional retail to their services' checkout experience.
| Category | 2018 | 2022 | CAGR* (%) 2018-2022 | 2023 | 2027 | CAGR* (%) 2023-2027 |
|---|---|---|---|---|---|---|
| Confectionery | 34,547.3 | 44,828.8 | 6.7 | 48,843.6 | 59,007.6 | 4.8 |
| Chocolate confectionery | 19,141.1 | 24,537.4 | 6.4 | 25,954.8 | 32,374.6 | 5.7 |
| Countlines | 6,367.3 | 8,113.4 | 6.2 | 8,490.5 | 10,365.5 | 5.1 |
| Chocolate pouches and bags | 4,506.5 | 6,102.0 | 7.9 | 6,785.4 | 8,550.2 | 5.9 |
| Seasonal chocolate | 2,994.5 | 3,805.1 | 6.2 | 3,901.6 | 4,945.2 | 6.1 |
| Tablets | 3,025.9 | 3,554.9 | 4.1 | 3,677.8 | 4,306.7 | 4.0 |
| Boxed assortments | 2,067.1 | 2,653.6 | 6.4 | 2,810.0 | 3,861.0 | 8.3 |
| Chocolate with toys | 179.8 | 308.4 | 14.4 | 289.5 | 346.0 | 4.6 |
| Gum | 3,522.9 | 3,337.4 | −1.3 | 3,675.1 | 4,359.9 | 4.4 |
| Chewing gum | 3,270.6 | 3,071.3 | −1.6 | 3,382.4 | 4,059.6 | 4.7 |
| Bubble gum | 252.3 | 266.1 | 1.3 | 292.7 | 300.2 | 0.6 |
| Sugar confectionery | 11,883.3 | 16,954.1 | 9.3 | 19,213.8 | 22,273.2 | 3.8 |
| Pastilles, gummies, jellies and chews | 5,516.6 | 7,960.4 | 9.6 | 8,779.4 | 10,151.8 | 3.7 |
| Other sugar confectionery | 2,472.2 | 4,263.9 | 14.6 | 5,070.4 | 6,158.4 | 5.0 |
| Mints | 1,403.2 | 1,419.0 | 0.3 | 1,536.0 | 1,804.9 | 4.1 |
| Medicated confectionery | 854.0 | 1,221.8 | 9.4 | 1,492.5 | 1,570.0 | 1.3 |
| Lollipops | 686.9 | 921.4 | 7.6 | 1,080.6 | 1,246.7 | 3.6 |
| Boiled sweets | 455.5 | 530.6 | 3.9 | 578.3 | 621.1 | 1.8 |
| Toffees, caramels and nougat | 325.8 | 426.1 | 6.9 | 455.3 | 484.0 | 1.5 |
| Liquorice | 169.1 | 210.7 | 5.7 | 221.3 | 236.4 | 1.7 |
|
Source: Euromonitor International, 2023 *CAGR: Compound annual growth rate |
||||||
| Brand (Company) | 2019 | 2020 | 2021 | 2022 | 2023 | CAGR* (%) 2019-2023 |
|---|---|---|---|---|---|---|
| Reese's (Hershey Co, The) | 2,905.3 | 3,277.3 | 3,716.6 | 4,181.5 | 4,664.3 | 12.6 |
| M&M's (Mars Inc) | 2,373.9 | 2,516.9 | 2,953.9 | 3,647.2 | 4,169.6 | 15.1 |
| Hershey's (Hershey Co, The) | 2,403.0 | 2,413.3 | 2,668.6 | 3,061.1 | 3,310.4 | 8.3 |
| Extra/Orbit (Mars Inc) | 1,101.8 | 873.8 | 916.8 | 1,105.0 | 1,206.3 | 2.3 |
| Snickers (Mars Inc) | 988.5 | 899.0 | 928.3 | 1,039.6 | 1,096.2 | 2.6 |
| Kit Kat (Nestlé SA) | 835.8 | 827.2 | 830.0 | 869.5 | 884.4 | 1.4 |
| Skittles (Mars Inc) | 533.0 | 486.0 | 637.2 | 730.8 | 812.8 | 11.1 |
| Ferrero Rocher (Ferrero & related parties) | 382.5 | 444.9 | 573.2 | 692.4 | 800.8 | 20.3 |
| Ghirardelli (Chocoladefabriken Lindt & Sprüngli AG) | 568.4 | 525.2 | 607.5 | 692.2 | 711.8 | 5.8 |
| Twix (Mars Inc) | 514.6 | 538.4 | 522.9 | 557.3 | 643.3 | 5.7 |
|
Source: Euromonitor International, 2023 *CAGR: Compound annual growth rate |
||||||
Ice cream
U.S. ice cream sales were steady over 2018 to 2022 and have achieved higher sales than those pre-pandemic, growing by 4.8% annually with the strongest sales growth in plant-based ice cream and frozen yogurt. 2022 marked the first full year of post-pandemic economic reopening, without foodservice limitations, with vaccinations fully available, and a return to hybrid or office working. Sales growth is expected to grow 3.1% annually over 2023 to 2027, as inflation brings price pressure over the next few years.
According to Euromonitor, post-pandemic lifestyles, as well as high inflationary pressures have translated into growth for some ice cream categories and stagnation or decline for others as the category readjusts. Most dairy based ice cream categories have seen small sales increases. Frozen yoghurt has seen a boom due mainly to brands such as Yasso's Greek yoghurt ice cream. Yasso has seen double-digit growth in the last few years. This presents challenges for dairy based ice cream but also opportunities in the health and wellness space. Brands associated with wellness are expected to enjoy a boost to their sales, due to their fit with young consumers healthy snacking routines. Healthy snacking includes both portion control as well as macronutrients. For ice cream, this means consumers either buying and eating less to allow for portion control, or buying more ice cream brands that promote certain health claims, such as no added sugar, a good source of protein, and no trans fats.
Plant-based ice cream has seen strong sales growth by 18.2% over 2018 to 2022, indicating consumers are drawn to its perceived health benefits and sustainability perception. Kind Bars is an example of a brand that has shown consistent growth in the last three years and presents opportunities in the multi-pack space for plant-based ice cream.
In 2022, consumers bought more than US$1 billion of ice cream in the U.S. through e-commerce. Shopping patterns resulted in significant growth in channel share for ice cream via e-commerce and this is set to continue in 2023. Meanwhile, convenience stores saw the closure of 1.5% of its stores in the US in 2022, presenting a trend of shifting convenience from stores to online and in-app purchasing. This has impacted some categories more than others, as bulk dairy ice cream is the largest category purchased through e-commerce channels, while impulse ice cream, which is often single-pack, still benefits from strong sales through convenience stores, set to account for nearly a third of value sales in 2023.
| Category | 2018 | 2022 | CAGR* (%) 2018-2022 | 2023 | 2027 | CAGR* (%) 2023-2027 |
|---|---|---|---|---|---|---|
| Ice cream | 15,624.6 | 18,846.1 | 4.8 | 19,994.5 | 22,606.2 | 3.1 |
| Take-home ice cream | 11,643.3 | 13,908.7 | 4.5 | 14,686.4 | 16,550.3 | 3.0 |
| Impulse ice cream | 2,943.7 | 3,285.0 | 2.8 | 3,407.5 | 3,397.2 | −0.1 |
| Plant-based ice cream | 307.6 | 600.1 | 18.2 | 735.9 | 1,256.7 | 14.3 |
| Frozen yoghurt | 280.2 | 517.9 | 16.6 | 598.9 | 753.5 | 5.9 |
| Unpackaged ice cream | 449.8 | 534.5 | 4.4 | 565.8 | 648.4 | 3.5 |
|
Source: Euromonitor International, 2023 *CAGR: Compound annual growth rate |
||||||
| Brand (Company) | 2019 | 2020 | 2021 | 2022 | 2023 | CAGR* (%) 2019-2023 |
|---|---|---|---|---|---|---|
| Häagen-Dazs (General Mills Inc) | 932.5 | 1,081.1 | 1,200.7 | 1,393.7 | 1,584.9 | 14.2 |
| Ben & Jerry's (Unilever Group) | 928.7 | 1,164.2 | 1,259.6 | 1,264.4 | 1,339.7 | 9.6 |
| Blue Bell (Blue Bell Creameries Inc) | 822.5 | 945.4 | 869.2 | 911.8 | 900.4 | 2.3 |
| Klondike (Unilever Group) | 572.1 | 610.7 | 585.7 | 669.4 | 704.4 | 5.3 |
| Outshine (Nestlé SA) | 497.1 | 495.8 | 529.5 | 598.4 | 658.2 | 7.3 |
| Drumstick (Nestlé SA) | 469.2 | 494.8 | 519.1 | 542.3 | 572.5 | 5.1 |
| Breyers (Unilever Group) | 537.8 | 582.9 | 547.5 | 542.6 | 524.2 | −0.6 |
| Nestlé (Nestlé SA) | 557.2 | 604.1 | 559.2 | 544.2 | 522.0 | −1.6 |
| Dreyer's/Edy's (Nestlé SA) | 606.3 | 647.9 | 615.1 | 556.7 | 517.6 | −3.9 |
| Tilamook (Tilamook CCA) | 202.3 | 281.9 | 305.6 | 367.7 | 420.6 | 20.1 |
|
Source: Euromonitor International, 2023 *CAGR: Compound annual growth rate |
||||||
Savoury snacks
Sales of savoury snacks in the U.S. grew by 8.1% annually over the 2018 to 2022, with the strongest sales growth in pretzels, popcorn, and salty snacks. Sales growth is expected to slow to 4.7% annually over 2023 to 2027, as inflation affects consumers' discretionary spending. According to Euromonitor, with workers following hybrid work models and students returning to pre-pandemic schedules, consumers are looking for ways to avoid the higher costs of buying lunches with snack packs that offer a variety of flavours. As inflation strains discretionary income for households with children, brands hope to tap into the flexible spending of childless adults with bolder, spicier flavour combinations. For example, Frito-Lay's decision to now offer Cheetos Bolitas, previously a flavour exclusive to Mexico, in the US shows brands are acknowledging and leaning into the diverse taste palates.
Over 2023 to 2027, consumers are expected to look for familiar comfort snacks in containers that provide storage and freshness even after the product has been opened. For example, low mess on-the-go snacks like Lay's Stax and Minis that are easier to carry and store, without the need for plastic bags to reseal. Similar trends will also be seen in non-potato chips snacks, such as pretzels.
Following high sales growth in 2021, growth in meat snacks flattened in 2022 and is set to continue in 2023, partly due to consumers experiencing diet burnout. Diets such as keto, which drove demand for products such as meat snacks during the pandemic, have since dropped out of favour and deemed unsustainable by consumers.
| Category | 2018 | 2022 | CAGR* (%) 2018-2022 | 2023 | 2027 | CAGR* (%) 2023-2027 |
|---|---|---|---|---|---|---|
| Savoury snacks | 48,778.9 | 66,637.0 | 8.1 | 73,583.8 | 88,282.0 | 4.7 |
| Salty snacks | 24,005.4 | 33,342.0 | 8.6 | 37,430.9 | 45,764.2 | 5.2 |
| Savoury biscuits | 6,803.6 | 8,646.2 | 6.2 | 9,449.5 | 10,712.1 | 3.2 |
| Nuts, seeds and trail mixes | 6,819.1 | 8,610.5 | 6.0 | 9,341.3 | 10,617.3 | 3.3 |
| Meat snacks | 3,513.3 | 4,828.6 | 8.3 | 4,995.7 | 6,050.2 | 4.9 |
| Popcorn | 3,205.4 | 4,489.4 | 8.8 | 4,996.2 | 5,935.4 | 4.4 |
| Other savoury snacks | 2,621.8 | 4,123.5 | 12.0 | 4,517.1 | 5,637.5 | 5.7 |
| Pretzels | 1,810.4 | 2,596.8 | 9.4 | 2,853.3 | 3,565.4 | 5.7 |
|
Source: Euromonitor International, 2023 *CAGR: Compound Annual Growth Rate |
||||||
| Brand (Company) | 2018 | 2019 | 2020 | 2021 | 2022 | CAGR* (%) 2018-2022 |
|---|---|---|---|---|---|---|
| Lay's (PepsiCo Inc) | 5,874.7 | 6,251.5 | 6,875.6 | 6,978.5 | 7,906.3 | 7.7 |
| Doritos (PepsiCo Inc) | 3,326.8 | 3,646.2 | 3,934.8 | 4,132.0 | 4,954.7 | 10.5 |
| Cheetos (PepsiCo Inc) | 2,221.1 | 2,471.6 | 2,672.6 | 2,876.3 | 3,391.3 | 11.2 |
| Jack Link's (Link Snacks Inc) | 1,598.5 | 1,671.7 | 1,881.4 | 2,308.7 | 2,394.3 | 10.6 |
| Ruffles (PepsiCo Inc) | 1,683.5 | 1,707.1 | 1,865.8 | 2,030.9 | 2,268.7 | 7.7 |
| Pringles (Kellogg Co) | 1,159.2 | 1,231.2 | 1,339.4 | 1,533.7 | 1,734.8 | 10.6 |
| Tostitos (PepsiCo Inc) | 1,368.9 | 1,401.5 | 1,608.9 | 1,511.0 | 1,669.0 | 5.1 |
| Fritos (PepsiCo Inc) | 1,217.5 | 1,253.6 | 1,340.3 | 1,398.6 | 1,603.3 | 7.1 |
| Cheez-It (Kellogg Co) | 1,153.4 | 1,209.5 | 1,336.1 | 1,408.4 | 1,568.9 | 8.0 |
| Wonderful (Wonderful Co LLC, The) | 819.7 | 889.7 | 935.6 | 1,145.3 | 1,373.3 | 13.8 |
|
Source: Euromonitor International, 2023 *CAGR: Compound annual growth rate |
||||||
Sweet biscuits, snack bars and fruit snacks
Retail sales of this category grew 5.8% annually to reach US$26.4 billion in 2022 and is expected to continue growing steadily by 4.2% annually from 2023 to 2027. Within this category, filled biscuits is largest with projected sales of US$5.5 billion in 2022, growing 7.0% annually. Processed fruit snacks are forecast to have the highest growth by 8.5%, followed by protein/energy bars.
According to Euromonitor, with the lifting of restrictions, people are returning to their pre-pandemic lifestyles and consumption is moving to schools, universities and workplaces, in addition to home consumption. The need for easy breakfast solutions is placing emphasis on cereal bars with sales quickly rising above pre-pandemic levels. As higher grocery costs collide with busier agendas, consumers are searching for affordable, convenient nutrition more frequently than before. Consumers are pre-planning more of their purchases by shifting to bulk/multipacks within snack bars, which is positively impacting all variants, but particularly fruit and nut bars, as they fulfil the consumer demand for a snack that is natural and can be taken on-the-go.
Inflationary pressures gave private label a jump in share in 2022; trends which are set to be maintained in 2023. For example, trading up to the consumption of premium snacks and trading down to private labels is one way consumers are willing to forego their brand loyalties. Although more consumers have moved to shopping in discounters, some have moved to e-commerce for its convenience. Price increases are likely to heighten this trend, leaving many mid-priced legacy brands hurt. Mondelez is expected to maintain its strong lead in sweet biscuits in 2023, while a surge of interest in Little Debbie is set to increase the value share of McKee Foods Corp. The strong performance of this brand has also driven the success of wafers, with sales growth in 2022 with this projected to continue in 2023.
| Category | 2018 | 2022 | CAGR* (%) 2018-2022 | 2023 | 2027 | CAGR* (%) 2023-2027 |
|---|---|---|---|---|---|---|
| Sweet biscuits, snack bars and fruit snacks | 21,097.5 | 26,394.5 | 5.8 | 28,510.0 | 33,616.7 | 4.2 |
| Filled biscuits | 4,155.9 | 5,455.4 | 7.0 | 5,830.6 | 6,481.5 | 2.7 |
| Protein/energy bars | 3,802.8 | 4,478.3 | 4.2 | 4,942.7 | 6,296.3 | 6.2 |
| Cereal bars | 3,142.6 | 3,805.3 | 4.9 | 4,168.0 | 5,220.3 | 5.8 |
| Cookies | 3,072.9 | 3,849.4 | 5.8 | 4,021.7 | 4,319.1 | 1.8 |
| Plain biscuits | 2,239.3 | 2,737.0 | 5.1 | 2,870.8 | 3,043.5 | 1.5 |
| Processed fruit snacks | 1,264.3 | 1,896.7 | 10.7 | 2,126.5 | 2,948.8 | 8.5 |
| Dried fruit | 1,115.4 | 1,314.3 | 4.2 | 1,374.1 | 1,633.9 | 4.4 |
| Fruit and nut bars | 950.9 | 1,039.1 | 2.2 | 1,147.1 | 1,361.7 | 4.4 |
| Chocolate coated biscuits | 863.6 | 1,123.9 | 6.8 | 1,229.6 | 1,334.8 | 2.1 |
| Wafers | 489.9 | 695.1 | 9.1 | 798.9 | 976.7 | 5.2 |
|
Source: Euromonitor International, 2023 *CAGR: Compound annual growth rate |
||||||
| Brand (Company) | 2018 | 2019 | 2020 | 2021 | 2022 | CAGR* (%) 2018-2022 |
|---|---|---|---|---|---|---|
| Oreo (Mondelez International Inc) | 1,554.3 | 1,664.2 | 1,973.8 | 2,105.6 | 2,276.5 | 10.0 |
| Nature Valley (General Mills Inc) | 972.4 | 946.9 | 882.9 | 1,043.6 | 1,178.3 | 4.9 |
| Chips Ahoy! (Mondelez International Inc) | 789.8 | 793.1 | 937.7 | 1,006.6 | 1,086.1 | 8.3 |
| KIND (Mars Inc) | 855.4 | 932.3 | 1,058.2 | |||
| Little Debbie (McKee Foods Corp) | 649.6 | 672.6 | 701.2 | 722.3 | 949.8 | 10.0 |
| Keebler (Ferrero & related parties) | 604.8 | 627.0 | 616.4 | 657.5 | ||
| Pepperidge Farm (Campbell Soup Co) | 443.8 | 454.1 | 507.3 | 531.8 | 590.9 | 7.4 |
| Betty Crocker (General Mills Inc) | 275.6 | 300.6 | 364.9 | 465.3 | 571.9 | 20.0 |
| Girl Scout cookies (Girl Scouts of the USA) | 634.8 | 644.5 | 606.9 | 535.4 | 565.9 | −2.8 |
| Welch's Fruit Snacks (National Grape Coop Assoc. Inc) | 314.4 | 349.1 | 382.1 | 493.1 | 563.3 | 15.7 |
|
Source: Euromonitor International, 2023 *CAGR: Compound annual growth rate |
||||||
Retail channels
In terms of distribution channels, ecommerce showed the highest growth during the pandemic, over 2018 to 2022, and is expected to continue growing at the expense of offline channels. Ecommerce sales grew 36.2% annually over 2018 to 2022.
Offline channels accounted for 91.2% of total sales in 2022. Discounters and warehouse clubs grew fastest by 8.5% and 8.4% over 2018 to 2022. All channels except vending and direct selling reported higher sales compared to pre-pandemic.
| Outlet type | 2018 | 2019 | 2020 | 2021 | 2022 | CAGR* % 2018-2022 |
|---|---|---|---|---|---|---|
| Retail channels | 120,048.3 | 124,386.8 | 130,831.7 | 139,305.0 | 156,706.4 | 7.3 |
| Convenience stores | 4,357.1 | 4,539.4 | 4,128.3 | 4,740.1 | 5,439.1 | 6.0 |
| Forecourt retailers | 14,541.4 | 15,162.4 | 13,765.3 | 15,018.3 | 16,984.6 | 4.5 |
| Supermarkets | 41,050.0 | 41,745.9 | 45,208.4 | 46,215.3 | 50,914.9 | 6.0 |
| Hypermarkets | 24,999.1 | 25,965.6 | 28,073.7 | 29,506.3 | 32,445.0 | 7.3 |
| Discounters | 1,872.6 | 2,117.9 | 2,395.6 | 2,423.2 | 2,652.9 | 8.5 |
| Warehouse clubs | 8,332.9 | 8,673.9 | 9,470.4 | 9,962.6 | 11,242.4 | 8.4 |
| Food/drink/tobacco specialists | 2,605.4 | 2,676.3 | 2,336.7 | 2,550.8 | 2,898.2 | 3.4 |
| Small local grocers | 2,519.1 | 2,516.9 | 2,295.8 | 2,321.9 | 2,411.6 | −0.5 |
| General merchandise stores | 4,999.7 | 5,204.3 | 5,568.9 | 5,712.2 | 6,127.7 | 5.3 |
| Health and beauty specialists | 5,663.4 | 5,625.3 | 4,957.3 | 5,681.9 | 6,439.1 | 4.1 |
| Other non-grocery retailers | 2,529.6 | 2,537.9 | 2,211.1 | 2,569.6 | 2,714.9 | 4.8 |
| Vending | 1,950.8 | 1,934.8 | 1,183.0 | 1,423.9 | 1,669.2 | −1.5 |
| Direct selling | 1,137.2 | 1,138.4 | 1,127.7 | 1,027.9 | 997.4 | −3.0 |
| Retail Ecommerce | 3,490.0 | 4,547.9 | 8,109.4 | 10,151.0 | 13,769.4 | 36.2 |
|
Source: Euromonitor International, 2023 *CAGR: Compound annual growth rate |
||||||
New product launches
A total of 21,523 new snack products were introduced over the 2018-22 period. Top claims were kosher and no/low focused, while top flavours included plain, "flavours unavailable" followed by strawberry, sea salt, and peanut butter, which suggests that consumers prefer health-conscious snacks.
| Product attributes | Number of new products by year | Total | ||||
|---|---|---|---|---|---|---|
| 2018 | 2019 | 2020 | 2021 | 2022 | ||
| Yearly product launches | 4,147 | 5,222 | 4,117 | 3,947 | 4,090 | 21,523 |
| Top 10 claims | ||||||
| Kosher | 2,148 | 2,687 | 2,161 | 2,104 | 1,867 | 10,967 |
| Low/No/Reduced allergen | 1,607 | 2,044 | 1,622 | 1,408 | 1,386 | 8,067 |
| Gluten free | 1,513 | 1,905 | 1,499 | 1,294 | 1,290 | 7,501 |
| GMO free | 1,080 | 1,457 | 1,101 | 899 | 841 | 5,378 |
| Social media | 901 | 1,187 | 1,024 | 995 | 1,001 | 5,108 |
| No additives/preservatives | 1,000 | 1,144 | 1,017 | 844 | 818 | 4,823 |
| Free from added/artificial flavourings | 655 | 714 | 603 | 560 | 552 | 3,084 |
| Seasonal | 497 | 837 | 529 | 507 | 657 | 3,027 |
| Ethical - environmentally friendly package | 477 | 616 | 478 | 561 | 592 | 2,724 |
| Vegan/No animal ingredients | 444 | 623 | 564 | 481 | 469 | 2,581 |
| Top 10 companies | ||||||
| Target | 47 | 94 | 124 | 129 | 144 | 538 |
| Hershey | 85 | 95 | 75 | 105 | 104 | 464 |
| Aldi | 55 | 95 | 92 | 99 | 113 | 454 |
| Mars Wrigley Confectionery | 51 | 131 | 91 | 84 | 68 | 425 |
| Frito-Lay | 50 | 90 | 72 | 96 | 103 | 411 |
| H-E-B | 85 | 64 | 89 | 72 | 32 | 342 |
| Kroger | 70 | 48 | 51 | 99 | 62 | 330 |
| Lidl | 36 | 0 | 22 | 86 | 149 | 293 |
| Better Living Brands | 69 | 84 | 19 | 86 | 33 | 291 |
| Whole Foods Market | 36 | 73 | 53 | 79 | 43 | 284 |
| Top 5 flavours (including blend) | ||||||
| Unflavoured/Plain | 466 | 570 | 483 | 440 | 456 | 2,415 |
| Flavours unavailable | 109 | 171 | 84 | 97 | 106 | 567 |
| Strawberry | 103 | 143 | 92 | 95 | 121 | 554 |
| Salt (Sea)/Fleur de sel | 81 | 107 | 97 | 67 | 68 | 420 |
| Peanut butter | 71 | 111 | 68 | 87 | 78 | 415 |
| Top 5 ingredients | ||||||
| White sugar (Food) | 2,241 | 2,887 | 2,104 | 2,169 | 2,416 | 11,817 |
| Salt (Food) | 2,064 | 2,560 | 2,049 | 2,045 | 2,084 | 10,802 |
| Natural X flavourings (food) | 1,917 | 2,271 | 1,759 | 1,810 | 1,895 | 9,652 |
| Food acids | 1,609 | 1,913 | 1,538 | 1,574 | 1,673 | 8,307 |
| Soy lecithin (food) | 1,322 | 1,714 | 1,091 | 1,155 | 1,189 | 6,471 |
| Launch types | ||||||
| New variety/range extension | 1,477 | 1,955 | 1,679 | 1,529 | 1,564 | 8,204 |
| New packaging | 1,443 | 1,758 | 1,217 | 1,282 | 1,363 | 7,063 |
| New product | 899 | 1,158 | 1,004 | 891 | 985 | 4,937 |
| Relaunch | 324 | 340 | 202 | 235 | 172 | 1,273 |
| New formulation | 4 | 11 | 15 | 10 | 6 | 46 |
| Top 5 package types | ||||||
| Flexible | 2,320 | 3,210 | 2,304 | 2,132 | 2,394 | 12,360 |
| Flexible stand-up pouch | 644 | 815 | 753 | 796 | 782 | 3,790 |
| Tub | 471 | 356 | 405 | 385 | 324 | 1,941 |
| Carton | 177 | 214 | 147 | 129 | 74 | 741 |
| Jar | 72 | 70 | 109 | 105 | 144 | 500 |
| Location of manufacturer | ||||||
| Not specified | 2,454 | 2,919 | 2,468 | 2,462 | 2,276 | 12,579 |
| United States | 902 | 1,028 | 786 | 599 | 621 | 3,936 |
| Canada | 187 | 287 | 190 | 220 | 195 | 1,079 |
| Mexico | 122 | 138 | 85 | 152 | 140 | 637 |
| Germany | 51 | 115 | 52 | 50 | 141 | 409 |
| Source: Mintel GNPD, 2023 | ||||||
New product examples
Peanut Butter Piloncillo Corn Bar
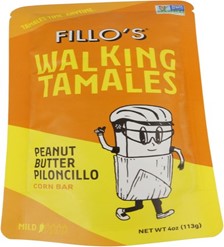
| Company | Sofrito Foods |
|---|---|
| Brand | Fillo's Walking Tamales |
| Category | Snacks |
| Sub-category | Corn-based snacks |
| Market | United States |
| Price in US dollars | 2.50 |
Fillo's Walking Tamales Peanut Butter Piloncillo Corn Bar retails in a 4 ounce pack. - Mild - Heat level of one out of five - Open and eat - Can be enjoyed warm - Microwaveable - Logos and certifications: QR code, Non GMO Project Verified.
Tapatío Mexican Hot Chocolate French Ice Cream
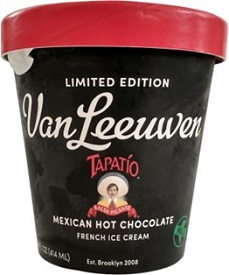
| Company | Van Leeuwen |
|---|---|
| Brand | Van Leeuwen |
| Category | Desserts and ice cream |
| Sub-category | Dairy based ice cream and frozen yogurt |
| Market | United States |
| Price in US dollars | 4.98 |
Van Leeuwen Tapatío Mexican Hot Chocolate French Ice Cream retails in a 14 fluid ounce pack. - Limited edition - Mild - Made using twice as many egg yolks as standard ice cream - Chocolate ice cream with marshmallows and fudge swirls - With added Tapatío hot sauce
Propolis Soothing Honey Lozenges
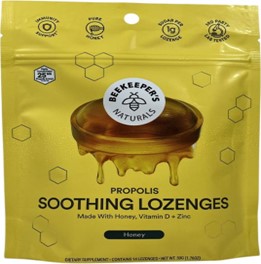
| Company | Beekeeper's Naturals |
|---|---|
| Brand | Beekeeper's Naturals |
| Category | Sugar and gum confectionery |
| Sub-category | Medicated confectionery |
| Market | United States |
| Price in US dollars | 8.99 |
Beekeeper's Naturals Propolis Soothing Honey Lozenges retail in a 1.76 ounce pack with 14 lozenges. - Made with pure honey, vitamin D + zinc - Immunity support - 1 gram sugar per lozenge - 3rd party lab tested - Highly concentrated 25 milligrams propolis extract per serving - Dietary supplement - Powered by propolis, backed by science - Made with nature-powered ingredients that promote immune health while soothing dry, scratchy throats - Logos and certifications: Female Founded, Certified B Corporation
Kyoto Style Cold Brew Coffee Dark Chocolate
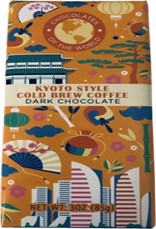
| Company | Astor Chocolate |
|---|---|
| Brand | Chocolates of the World |
| Category | Chocolate confectionery |
| Sub-category | Chocolate tablets |
| Market | United States |
| Price in US dollars | 2.99 |
Chocolates of the World Kyoto Style Cold Brew Coffee Dark Chocolate retails in a 3 ounce pack. - Logos and certifications: Kosher
For more information
The Canadian Trade Commissioner Service:
International Trade Commissioners can provide Canadian industry with on-the-ground expertise regarding market potential, current conditions and local business contacts, and are an excellent point of contact for export advice.
More agri-food market intelligence:
International agri-food market intelligence
Discover global agriculture and food opportunities, the complete library of Global Analysis reports, market trends and forecasts, and information on Canada's free trade agreements.
Agri-food market intelligence service
Canadian agri-food and seafood businesses can take advantage of a customized service of reports and analysis, and join our email subscription service to have the latest reports delivered directly to their inbox.
More on Canada's agriculture and agri-food sectors:
Canada's agriculture sectors
Information on the agriculture industry by sector. Data on international markets. Initiatives to support awareness of the industry in Canada. How the department engages with the industry.
For additional information on the upcoming Natural Food Products Expo East, please contact:
Cecile Landgrebe
Trade Commissioner
Consulate General of Canada
Government of Canada
ecile.landgrebe@international.gc.ca
Resources
- Euromonitor International:
- Snacks in USA (July 2023)
- Savoury snacks in USA (July 2023)
- Chocolate confectionary in USA (July 2023)
- Gum in USA (July 2023)
- Ice cream in USA (July 2023)
- Sugar confectionary in USA (July 2023)
- Sweet biscuits, snack bars, and fruit snacks in USA (July 2023)
- Mintel GNPD, 2023
Sector Trends Analysis – Snack trends in the United States
Global Analysis Report
Prepared by: Kris Clipsham, Market Analyst
© His Majesty the King in Right of Canada, represented by the Minister of Agriculture and Agri-Food (2023).
Photo credits
All photographs reproduced in this publication are used by permission of the rights holders.
All images, unless otherwise noted, are copyright His Majesty the King in Right of Canada.
To join our distribution list or to suggest additional report topics or markets, please contact:
Agriculture and Agri-Food Canada, Global Analysis1341 Baseline Rd, Tower 5, 3rd floor
Ottawa ON K1A 0C5
Canada
Email: aafc.mas-sam.aac@agr.gc.ca
The Government of Canada has prepared this report based on primary and secondary sources of information. Although every effort has been made to ensure that the information is accurate, Agriculture and Agri-Food Canada (AAFC) assumes no liability for any actions taken based on the information contained herein.
Reproduction or redistribution of this document, in whole or in part, must include acknowledgement of agriculture and agri-food Canada as the owner of the copyright in the document, through a reference citing AAFC, the title of the document and the year. Where the reproduction or redistribution includes data from this document, it must also include an acknowledgement of the specific data source(s), as noted in this document.
Agriculture and Agri-Food Canada provides this document and other report services to agriculture and food industry clients free of charge.